 🏗️ New Construction
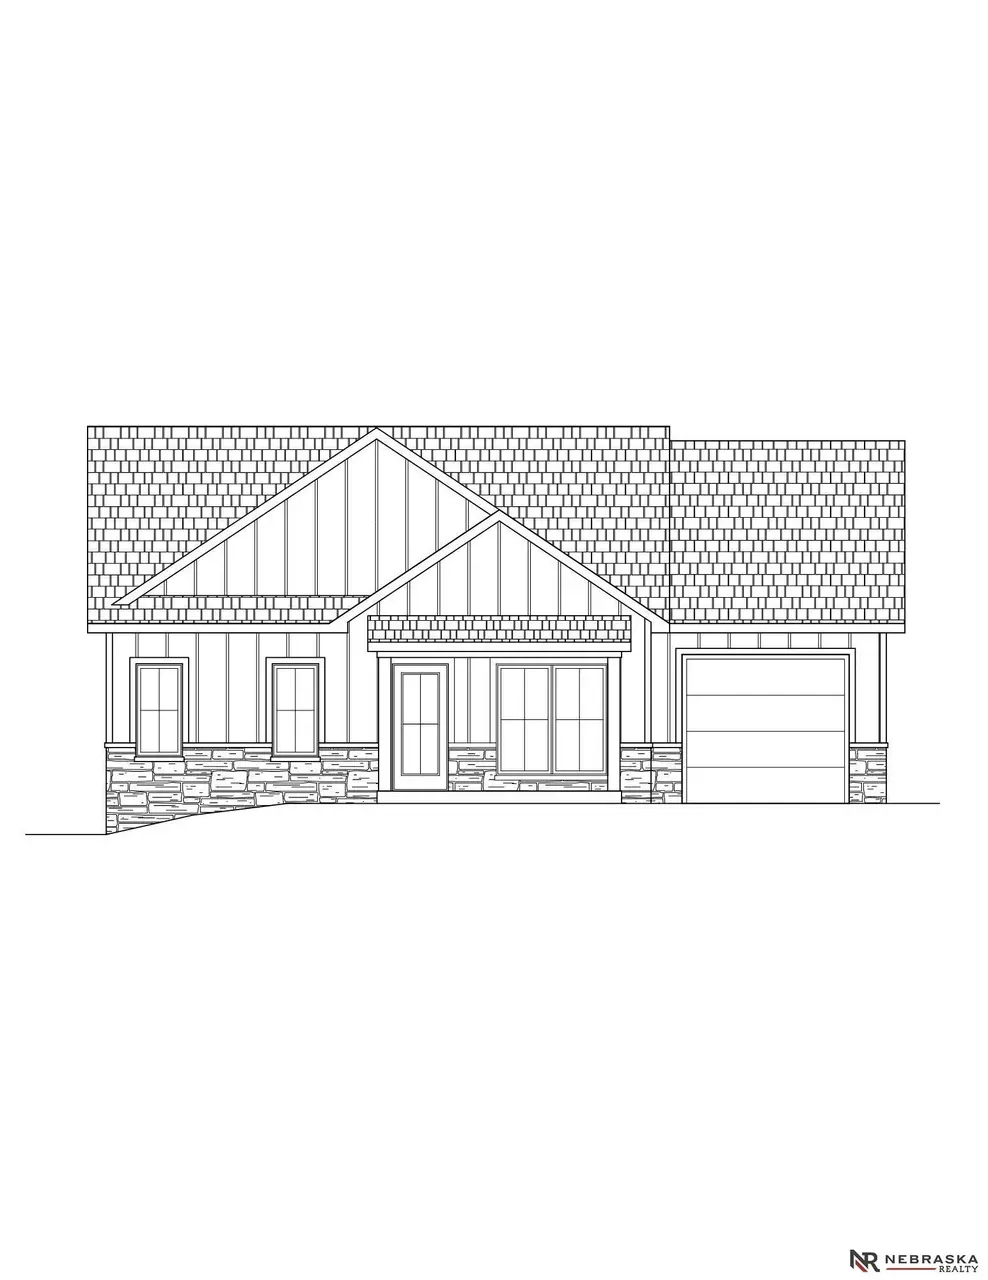
9533 S 87th St · Lincoln, NE
Flood risk No data
- FEMA flood zone
- —
- Chance of flooding over 30 yrs
- —
- Est. flood insurance / yr
- —
Fire risk No data
- Est. fire insurance / yr
- —
Heat risk No data
- Hot days now (above threshold)
- —
- Hot days in 30 yrs
- —
Wind risk No data
- Chance of severe wind over 30 yrs
- —
Air-quality risk No data
- Unhealthy air days now
- —
- Unhealthy air days in 30 yrs
- —
Risk factors via First Street. Map © Google.
Why this score? — see what drove the F grade
The composite is a weighted blend of 9 inputs, each scored 0–100. Each bar is that input's sub-score; the figure is the points it added to the 100-point composite (weight × sub-score).
- ARV discount +7.5/15.0
- Appreciation +6.4/10.0
- Schools +4.4/10.0
- Livability +4.2/5.0
- Cash flow +3.8/30.0
- Condition / age +2.5/5.0
- Rent growth +1.7/5.0
- 1% rule +0.2/10.0
- DSCR +0.0/10.0
$385,000
🖨 Deal sheet 📄 Offer letter ✓ Due diligence
Listing remarks
Discover comfort, space, and modern living in this beautifully designed 3-bedroom, 3-bath home offering 1,804 sq ft of finished living area! The main level features a bright, open layout perfect for both everyday living and entertaining, along with two generously sized bedrooms and two well-appointed bathrooms. Downstairs, you’ll love the expansive family room—ideal for movie nights, game days, or hosting guests. The lower level also includes a spacious third bedroom and a full bathroom, creating the perfect private retreat or guest suite. Exterior features a 2-stall tandem garage. Call today!
Key facts
- 6,098 sq ft lot
- 2 garage spots
- Built 2026
Property features AI
Finance
- HOA & community: Homeowners association with annual fee of $600; Association fee covers common area maintenance and trash
Exterior
- Parking: Attached tandem garage with space for 2 cars; Two covered parking spaces
- Security: Exterior accessible (accessibility features)
- Utilities: Public water; Public sewer
- Home design: Single-family residence (residential); Under construction / new construction (built 2026); Living area above grade approximately 1,047 square feet; total finished area above and below grade approximately 1,804 square feet
- Construction: Concrete perimeter foundation; Built in 2026; Built by Buhr/GBL Homes
- Exterior features: Porch and covered patio; Sprinkler system; Drain tile; Lot roughly 52 x 120 (about 0.14 acre)
Interior
- Kitchen: Kitchen on the main floor with luxury vinyl plank flooring
- Bedrooms: Primary bedroom on main floor (12 x 12); Second bedroom on main floor (12 x 12); Third bedroom in basement (11 x 12)
- Flooring: Luxury vinyl plank in living areas and kitchen; Wall-to-wall carpeting in bedrooms and basement family room
- Bathrooms: Three bathrooms total: two full baths and one three-quarter bath; Two bathrooms on the main level
- Heating & cooling: Electric forced-air heating; Central air conditioning
- Interior features: Basement with egress; Finished basement area (approximately 757 square feet); Wall-to-wall carpeting in bedrooms and basement family room; Luxury vinyl plank in living room, kitchen, and laundry area; No fireplace
- Laundry & utility: Laundry area with luxury vinyl plank flooring
Neighborhood map
What this means for you Summary
Snapshot
- This is a 3-bed/3.0-bath single-family listed at $385k.
Deal economics
- At list price, monthly cash flow is $-1k ($-15k/yr) — negative.
- To cash-flow at today's rent, offer at most $256k (33.5% below list).
- To meet the 1% rule (rent ≥ 1% of price), the offer needs to be $230k (40.2% below list).
- Recommended offer: $230k (40.2% below list) — sets the bar for 1% rule.
Location & tenants
- Location reads 85/100 on livability (#5 in NE, #545 nationally) — a professional / high-income tenant draw. Strengths: amenities A+, cost of living A+, housing A+; Watch: crime D+.
- Lincoln Public Schools (urban): math 50% / reading 53% proficiency, ranked #59 of 111 in NE (top 53%) — acceptable for families but not a draw, mixed tenant base, ~2y average lease.
- Zoned schools: Wysong Elementary (math 69% / reading 75%, grade A-, #27 of 502 statewide, top 7%, 697 students, 8% FRL); Moore Middle School (math 78% / reading 69%, grade A, #4 of 128 statewide, top 2%, 738 students, 10% FRL) — zoned schools average 9% FRL vs 37% district-wide (28 pts lower); this property's tenant base skews higher-income than the district average.
- Zoned-school proficiency averages 73% at this address vs 52% district-wide (+21 pts) — the actual schools serving this property are materially stronger than the Lincoln Public Schools average implies; a family-tenant draw the district grade alone would hide.
- Market conditions: Rents falling (-3.0%/yr); 144 active listings in the ZIP; 9 comparable units currently listed for rent nearby; rentals lingering (median 44d on market — plan ~5-8 weeks vacancy on turnover, expect pricing pressure); 56% of comp listings sitting > 30 days — soft ceiling on asking rent; high-income renter base; 1,940 units permitted in Lancaster County in 2024 (895 in 5+ unit buildings).
Forward outlook
- In year one you build about $15k of equity ($3k loan paydown + $12k appreciation (2.8% local appreciation)).
- Lancaster County population projected at +37% by 2050 — long-run rental-demand tailwind backs the buy-and-hold thesis.
- By year 3, paydown + projected appreciation supports a ~$38k cash-out refi (75% LTV) — recoverable capital for the next deal without selling this one.
Negotiation context
- It's been on market 44 days — a 3% lower offer ($373k) is reasonable based on typical stale-listing flexibility.
Questions for the listing agent
- What do current leases actually rent for vs. the listed asking? Can we see a recent rent roll and the last 12 months of T-12 income?
- It's been on market 44 days. Have you received any prior offers? Is the seller open to a 40% concession, seller financing, or rate buy-down credit?
- What does the HOA fee cover, when was the last increase, and are there any pending special assessments or reserve-fund shortfalls?
- Is there a deadline driving the sale (1031 exchange, divorce, estate, relocation)? That informs how much negotiation room exists.
- Schools are A-rated — typically a magnet for longer-tenancy family renters. What's the average tenant stay here, and is there a school-zone premium baked into asking?
- Crime grade is D in this area — have there been break-ins, vandalism, or insurance claims at this property in the last 3 years? What carrier currently insures it and at what premium?
- The area grade is low — what's the realistic commute time and amenity access for the typical tenant pool here? Any planned neighborhood developments (good or bad) we should know about?
- What's the average days-on-market for RENTAL listings here right now (not sales)? A rising rental-DOM trend means longer vacancies and softer asking-rent achievability than the comps imply.
- What's the recent tenant-quality profile in this submarket — average credit score on applications, eviction rate, late-payment / NSF rate, and stable-employment percentage? A property-management company in the area should have these aggregated.
- How much new for-sale + rental construction is in the pipeline within 1–3 miles? Heavy new supply typically softens prices + rents 12–24 months out; constrained supply supports both.
Investment metrics
- 1% rule
- 0.52% ✗
- Cap rate
- 2.82%
- Cash-on-cash
- -12.39%
- DSCR
- 0.45
- GRM
- 15.9
CMA / ARV
- ARV (median comp)
- $440,001
- List price
- $385,000
- Delta
- -12.50%
- Verdict
- UNDERPRICED
- Comps
- 20 within 1.0 mi
Show comp detail 6 sales within ~0.75 mi
| Address | Dist | Beds/Ba | Sqft | Sold | Price | $/sf | Match |
|---|---|---|---|---|---|---|---|
| 9530 Burton St | 0.71mi | 4/2.0 (+1) | 1,636 (-9%) | 3mo | $256,000 | $156 | 40 |
| 7700 Ponce Dr | 0.59mi | 3/2.5 | 1,631 (-10%) | 22mo | $523,890 | $321 | 36 |
| 7930 Patrick Ave | 0.72mi | 3/2.5 | 1,664 (-8%) | 20mo | $548,340 | $330 | 35 |
| 8000 Ephraem St | 0.75mi | 3/2.0 | 1,680 (-7%) | 18mo | $550,525 | $328 | 34 |
| 8010 Patrick Ave | 0.69mi | 3/2.5 | 1,631 (-10%) | 19mo | $499,950 | $307 | 34 |
| 9601 Chester St | 0.69mi | 4/2.0 (+1) | 1,680 (-7%) | 22mo | $208,500 | $124 | 29 |
Match score weights: distance 35% · size 25% · config 20% · recency 20%. Top-matched comps best support the ARV.
Projected returns pro-forma
2.8% appreciation · 0.0% rent growth · sell at horizon
- IRR
- -5.6%
- Equity multiple
- 0.68×
- Total profit
- $-39,287
- Equity at exit
- $192,969
- IRR
- -1.5%
- Equity multiple
- 0.77×
- Total profit
- $-28,332
- Equity at exit
- $293,654
Cash invested: $123,200 (down + closing). Projections, not guarantees.
Landlord ↔ Tenant lean methodology
- Overall (STATE)
- 83 Strongly Landlord-Friendly
- State Nebraska
- 83 Strongly Landlord-Friendly · R+13
- County
- — inherits STATE
- City
- — inherits STATE
ZIP-level market 68526
- Home prices YoY
- 1.1%
- Rents YoY
- -3.0%
- Active inventory
- 144
- Price-to-rent
- 13.9×
Monthly cashflow live
- Estimated rent
- $2,302 high interval (Pro) →
- Mortgage (P&I)
- −$2,307
- Tax est. 1.5%
- −$550 /mo · $6,600/yr
- Insurance
- −$183
- HOA
- −$50
- Vacancy / Maint / Mgmt
- −$483
- Net cashflow
- $-1,272
Break-even live
UW: 25.0% down · 7.5% · 30yr · 1.5% tax · 5.0% vac · 8.0% maint · 8.0% mgmt
Financing live
Cash to close
- Down payment
- $110,000
- Closing costs
- $13,200
- Reserves months
- —
- Total cash needed
- —
Loan-product check · same deal, 3 products live
Conventional
25% down · 7.5% · 30yr
- Down + closing
- —
- Monthly P&I
- —
- Monthly cashflow
- —
- DSCR
- —
- Eligible?
- —
Personal DTI + credit; lowest rate.
DSCR
20% down · 8.5% · 30yr
- Down + closing
- —
- Monthly P&I
- —
- Monthly cashflow
- —
- DSCR
- —
- Eligible?
- —
No personal income docs; deal must DSCR.
Hard money
10% down · 12.0% · 12mo
- Down + closing
- —
- Monthly P&I
- —
- Monthly cashflow
- —
- DSCR
- —
- Eligible?
- —
Short-term bridge; refi at stabilization.
Rent comps 9 comps
| Address | Beds | Baths | Sqft | Rent | $/sqft | DOM | Units | Dist |
|---|---|---|---|---|---|---|---|---|
| 8812 Bristlecone Dr Lincoln, NE | 2.0 | 2.5 | 1770 | $2,195 | $1.24 | 43d | 1 | 0.27mi |
| 9746 S 89th St Lincoln, NE | 3.0 | 3.0 | 2157 | $2,550 | $1.18 | 13d | 1 | 0.30mi |
| 7777 Aero Dr Lincoln, NE | 4.0 | 3.0 | 2404 | $2,800 | $1.16 | 43d | 1 | 0.54mi |
| 8850 S 78th St Lincoln, NE | 4.0 | 3.0 | 2400 | $2,900 | $1.21 | 43d | 1 | 0.68mi |
| 7920 Patrick Ave Lincoln, NE | 3.0 | 2.0 | 1515 | $3,150 | $2.08 | 43d | 1 | 0.74mi |
| 9330 S 74th St Lincoln, NE | 4.0 | 3.0 | 2404 | $2,800 | $1.16 | 43d | 1 | 0.76mi |
| 8300 Renatta Dr Lincoln, NE | 1.0–3.0 | 1.0–2.0 | 979 | $2,300 | $2.35 | 13d | 18 | 1.16mi |
| 7210 S 89th St Lincoln, NE | 2.0 | 1.0–2.0 | 928 | $1,815 | $1.96 | 13d | 46 | 1.45mi |
| 9100 Heritage Lakes Dr Lincoln, NE | 3.0 | 1.0–2.0 | 953 | $1,905 | $2.00 | 13d | 18 | 1.49mi |
HOA detail
- Monthly dues
- $50 · $600/yr
Listing history 16 events
-
2026-06-18days on market $385,000 Active 44 DOM
-
2026-06-17days on market $385,000 Active 43 DOM
-
2026-06-16days on market $385,000 Active 42 DOM
-
2026-06-15days on market $385,000 Active 41 DOM
-
2026-06-14days on market $385,000 Active 39 DOM
-
2026-06-10days on market $385,000 Active 36 DOM
-
2026-06-09days on market $385,000 Active 35 DOM
-
2026-06-08days on market $385,000 Active 34 DOM
-
2026-06-07days on market $385,000 Active 33 DOM
-
2026-06-05days on market $385,000 Active 30 DOM
-
2026-06-03days on market $385,000 Active 29 DOM
-
2026-06-02days on market $385,000 Active 28 DOM
-
2026-06-01days on market $385,000 Active 27 DOM
-
2026-05-31days on market $385,000 Active 26 DOM
-
2026-05-30days on market $385,000 Active 25 DOM
-
2026-05-05$385,000 New 612-char remark
ⓘ Source: listings_history table (triggers on properties + properties_extension) + one-shot
backfill from property_details.listing_events for pre-trigger history.
Nearby sold comps map
Loading sold comps map…
Walkable amenities ~0.75 mi
Loading nearby amenities…
Taxation est. · year 1
- Rental income
- $27,623
- − Mortgage interest
- −$24,647
- − Property taxes
- −$6,600
- − Insurance
- −$2,200
- − Repairs & maintenance
- −$2,210
- − Management
- −$2,210
- − HOA
- −$600
- − Depreciation
- −$12,800
- Taxable loss
- −$23,644
- Est. tax savings @ 24.0%
- +$5,674
- After-tax cash flow
- $-9,592/yr
For passive investors: Depreciation is non-cash, so a rental often shows a tax loss while cash-flowing — sheltering income. Rental losses are passive: they offset passive income freely, and up to $25,000/yr can offset ordinary (W-2) income if you actively participate and your MAGI is under $100k (phasing out to $0 by $150k); unused losses carry forward. On sale, claimed depreciation is recaptured at up to 25%, and gains may owe capital-gains tax (a 1031 exchange can defer both). Figures are a year-1 estimate at your 24.0% rate — not tax advice; consult a CPA.
Schools (NCES district)
- District
- Lincoln Public Schools
- NCES district ID
- 3172840
- Math proficiency
- 50% ▼ -6.00%
- Reading proficiency
- 53% ▼ -3.00%
- Median HH income
- $50,273
- Composite
- 44.05/100
- National rank
- #2880
- State rank
- #59 of 111 in NE
Livability — Lincoln
- Score
- 85/100
- State rank
- #5
- US rank
- #545
Category grades
Schools grade is shown separately in the Schools card above.
Census & demographics
- Census place
- Lincoln, NE
- County
- Lancaster County · 291,509 people
- City population
- 291,509
- Metro
- Lincoln, NE
- Population (ZIP)
- 7,944
- Household income
- $113,910
- Rent vs Own
- Severe rent burden
- 209.0
Population outlook (Lancaster County) Hauer SSP2
- Today (2025)
- 352,806 people
- By 2030
- 377,899 · +7.1%
- By 2040
- 428,582 · +21.5%
- By 2050
- 483,103 · +36.9%
- By 2075
- 632,390 · +79.2%
- By 2100
- 759,513 · +115.3%
Race, ethnicity, and origin ACS 2023
- Neighborhood character
- Predominantly White (88%)
- Race & ethnicity
- White 88% Hispanic / Latino 4% Two or more races 4% Asian 4%
- Common ancestry
- Slovak 4% Italian 2% Iranian 2%
- Foreign-born
- 5% · Canada, Vietnam, South Korea
- Languages at home
- 94% English-only · Spanish 2% Vietnamese 1% Other Indo-European 1%
Political lean MEDSL · Lancaster
- 2024 margin
- Toss-up / Even · D 51.4% · R 47.1% · Other 1.5%
- 2008→2024 swing
- -0.7pp no change · 2008: 5.0pp · 2024: 4.3pp
- All cycles
- 2024: D+4.3 2020: D+7.8 2016: D+0.1 2012: R+1.0 2008: D+5.0
Not yet ingested
- Civics
- —
Market trends
- HPI YoY
- ▲ 2.80%
- Current HPI
- 263.2041
- Rent YoY
- ▼ -3.02%
- Metro
- Lincoln, NE
- State GDP YoY
- ▲ 0.68%
- F500 in state
- 2
Industry mix (Fortune 500 HQ in NE)
| Industry | F500 HQs | Revenue |
|---|---|---|
| Conglomerate | 1 | $371B |
|
||
Price history
1 event — show timeline
- 2026-05-05 Listed $385,000 GPRMLS
Cash-flow waterfall
monthlySold comps — $/sqft
last 12 mo · ≤1 miLoading sold comps…