486 Benson Hurst Dr SW · Mableton, GA
Flood risk 1/10 · Minimal
- FEMA flood zone
- X (unshaded)
- Chance of flooding over 30 yrs
- 0.0%
- Est. flood insurance / yr
- $473 – $860
Fire risk 1/10 · Minimal
- Est. fire insurance / yr
- $963 – $1,789
Heat risk 5/10 · Moderate
- Hot days now (above 103°F)
- 7 days/yr
- Hot days in 30 yrs
- 18 days/yr
Wind risk 5/10 · Moderate
- Chance of severe wind over 30 yrs
- 25.0%
Air-quality risk 4/10 · Minor
- Unhealthy air days now
- 4 days/yr
- Unhealthy air days in 30 yrs
- 5 days/yr
Risk factors via First Street. Map © Google.
Why this score? — see what drove the D- grade
The composite is a weighted blend of 9 inputs, each scored 0–100. Each bar is that input's sub-score; the figure is the points it added to the 100-point composite (weight × sub-score).
- ARV discount +15.0/15.0
- Cash flow +7.8/30.0
- Schools +3.8/10.0
- Livability +3.5/5.0
- Rent growth +3.4/5.0
- Condition / age +2.5/5.0
- 1% rule +2.0/10.0
- DSCR +1.9/10.0
- Appreciation +0.0/10.0
$350,000
🖨 Deal sheet (PDF) 📄 Offer letter ✓ Due diligence
Listing remarks MLS
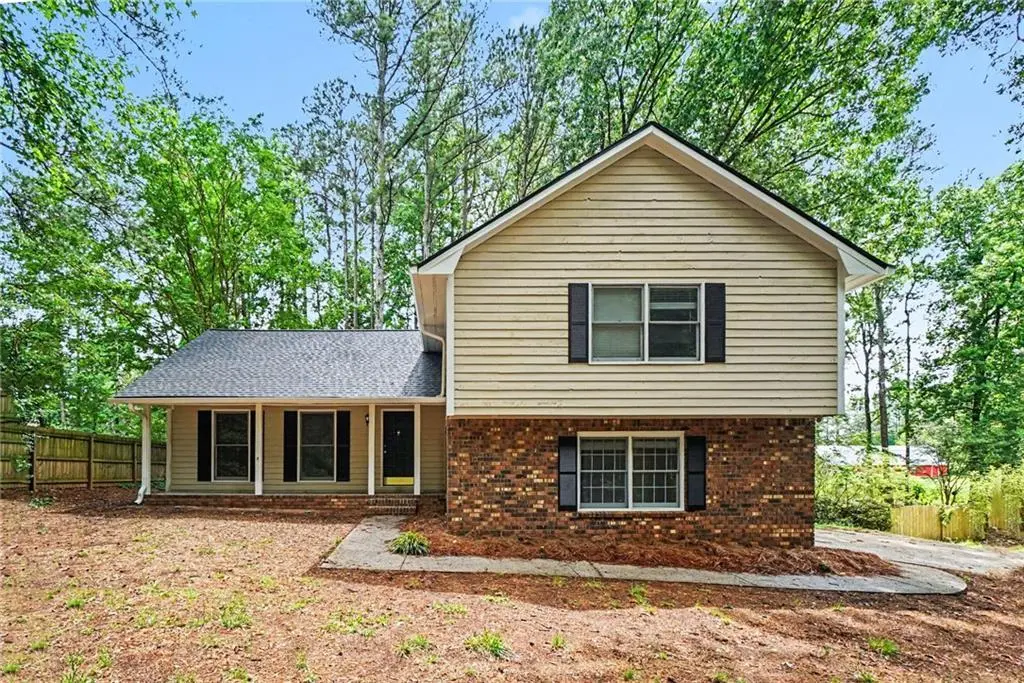
This 5-bedroom, 3-bathroom two-story home is an ideal investor special for those looking for a high-potential project. The property features a desirable open floorplan that provides a modern, airy feel through the main living areas, which are finished with a mix of laminate flooring and carpeting. The kitchen is equipped with durable Formica countertops and leads toward a private backyard, offering plenty of space for outdoor improvements. With five full bedrooms and three bathrooms, this home has the structural layout and square footage to become a high-value asset once the necessary renovations are completed.
Key facts
- Private backyard
- Open floorplan
- 0.24 acre lot
Tags
Property features AI
Exterior
- Parking: Driveway parking; Open parking available
- Utilities: Public water; Septic tank sewer; Electricity available
- Home design: Two levels; Resale property
- Construction: Brick and vinyl siding exterior; Shingle roof; Slab foundation
- Exterior features: Private entrance; Private yard; Patio (screened)
Interior
- Kitchen: Dishwasher; Disposal; Electric range
- Bedrooms: One main-level bedroom; Four upper-level bedrooms; Split bedroom plan
- Flooring: Carpet; Luxury vinyl; Vinyl
- Bathrooms: Three full bathrooms; One main-level bathroom; Two full upper-level bathrooms; Master bathroom with shower (no tub)
- Heating & cooling: Central heating; Central air; Ceiling fan(s)
- Interior features: One fireplace located in the living room; Walk-in closet(s); No common walls
- Laundry & utility: Laundry area (other/unspecified)
Neighborhood map
What this means for you Summary
Snapshot
- This is a 3-bed/2.0-bath single-family listed at $350k.
Deal economics
- At list price, monthly cash flow is $-389 ($-5k/yr) — negative.
- To cash-flow at today's rent, offer at most $281k (19.7% below list).
- To meet the 1% rule (rent ≥ 1% of price), the offer needs to be $246k (29.8% below list).
- Recommended offer: $246k (29.8% below list) — sets the bar for 1% rule.
- Cap rate 5.0% vs local median 4.0% in Mableton — meaningfully above typical; check what's discounted (condition, days-on-market, listing class) to confirm the premium yield is real.
Location & tenants
- Location reads 70/100 on livability (#94 in GA) — a middle-class / working-renter tenant base. Strengths: housing A+, cost of living A-, crime B+; Watch: amenities F, commute D-.
- Cobb County (suburban): math 39% / reading 45% proficiency, ranked #25 of 174 in GA (top 14%) — families likely to look elsewhere, expect single-tenant / working-renter base with shorter leases.
- Zoned schools: Mableton Elementary School (math 18% / reading 21%, grade F, #878 of 1,228 statewide, top 75%, 898 students, 81% FRL); Floyd Middle School (math 17% / reading 24%, grade F, #345 of 470 statewide, top 74%, 845 students, 80% FRL); South Cobb High School (math 21% / reading 20%, grade F, #231 of 424 statewide, top 54%, 2,127 students, 67% FRL) — zoned schools average 76% FRL vs 39% district-wide (37 pts higher); higher-poverty schools than district average — tighter screening recommended.
- Zoned-school proficiency averages 20% at this address vs 42% district-wide (-22 pts) — the specific schools serving this property underperform the Cobb County average; the district grade overstates school quality for this exact location.
- Market conditions: Rents rising (+3.7%/yr); 405 active listings in the ZIP; 13 comparable units currently listed for rent nearby; rentals at typical pace (median 24d on market — plan ~3-4 weeks tenant-placement turnaround); solid renter incomes; 1,625 units permitted in Cobb County in 2024 (389 in 5+ unit buildings).
Forward outlook
- Local home prices are declining (-3.0%/yr); year-one equity from $2k of loan paydown is wiped out by about $10k of value loss. Plan a longer hold.
- Cobb County population projected at +33% by 2050 — long-run rental-demand tailwind backs the buy-and-hold thesis.
Negotiation context
- It's been on market 24 days — a 2% lower offer ($345k) is reasonable based on typical stale-listing flexibility.
- 2 sale attempts with the ask held roughly flat each time — persistent listings suggest the price (not the market) is what's stuck; bring a comps-based counter.
- Current owner paid $114k; list at $350k implies a 207% gain — meaningful room to come down on a strong offer.
Risks & watch-outs
- Climate carrying-cost: moderate wind risk, 25% chance of damaging wind over 30y; extreme-heat days projected 7→18/yr by 2055 (HVAC capex compounding) — expect insurance premiums to compound above CPI over the hold.
Questions for the listing agent
- What do current leases actually rent for vs. the listed asking? Can we see a recent rent roll and the last 12 months of T-12 income?
- Built in 1978 — when were the roof, HVAC, electrical panel, plumbing, and water heater last replaced?
- Is there a deadline driving the sale (1031 exchange, divorce, estate, relocation)? That informs how much negotiation room exists.
- Schools are F-rated, which usually means shorter tenancies and higher turnover. Who's the typical renter profile here, and what's been the actual vacancy rate?
- The area grade is low — what's the realistic commute time and amenity access for the typical tenant pool here? Any planned neighborhood developments (good or bad) we should know about?
- What's the average days-on-market for RENTAL listings here right now (not sales)? A rising rental-DOM trend means longer vacancies and softer asking-rent achievability than the comps imply.
- What's the recent tenant-quality profile in this submarket — average credit score on applications, eviction rate, late-payment / NSF rate, and stable-employment percentage? A property-management company in the area should have these aggregated.
- How much new for-sale + rental construction is in the pipeline within 1–3 miles? Heavy new supply typically softens prices + rents 12–24 months out; constrained supply supports both.
Investment metrics
- 1% rule
- 0.70% ✗
- Cap rate
- 4.96%
- Cash-on-cash
- -4.77%
- DSCR
- 0.79
- GRM
- 11.9
CMA / ARV
- ARV (on-the-fly)
- $462,208
- Comps found
- 12
Show comp detail 12 sales within ~0.75 mi
| Address | Dist | Beds/Ba | Sqft | Sold | Price | $/sf | Match |
|---|---|---|---|---|---|---|---|
| 658 Benson Hurst Dr SW | 0.35mi | 4/3.5 (+1) | 2,505 (-0%) | 0mo | $435,000 | $174 | 72 |
| 4615 Oakland Ter SW | 0.34mi | 3/3.0 | 2,397 (-5%) | 2mo | $440,000 | $184 | 71 |
| 721 Shannon Green Cir SW | 0.07mi | 4/3.0 (+1) | 2,276 (-9%) | 2mo | $415,000 | $182 | 70 |
| 4788 Langford Ct SW | 0.20mi | 4/2.5 (+1) | 2,733 (+9%) | 8mo | $495,000 | $181 | 63 |
| 4781 Langford Ct SW | 0.22mi | 4/2.5 (+1) | 2,291 (-9%) | 9mo | $450,000 | $196 | 61 |
| 570 Carlouetta Rd SW | 0.31mi | 3/2.0 | 2,180 (-13%) | 4mo | $402,500 | $185 | 60 |
| 4806 Lismoor Trce SW | 0.69mi | 4/2.5 (+1) | 2,516 (+0%) | 2mo | $455,000 | $181 | 59 |
| 420 Northland Rd SW | 0.21mi | 4/2.0 (+1) | 2,225 (-11%) | 9mo | $426,000 | $191 | 58 |
| 4733 Stridemore Ct | 0.69mi | 3/2.5 | 2,759 (+10%) | 3mo | $435,000 | $158 | 47 |
| 4782 Donnegal Ct SE | 0.65mi | 4/2.5 (+1) | 2,368 (-6%) | 8mo | $412,400 | $174 | 46 |
| 221 Shady Ln SW | 0.50mi | 3/2.5 | 2,165 (-14%) | 7mo | $415,000 | $192 | 46 |
| 4487 S Springwood Dr SW | 0.59mi | 4/2.5 (+1) | 2,227 (-11%) | 6mo | $439,000 | $197 | 41 |
Match score weights: distance 35% · size 25% · config 20% · recency 20%. Top-matched comps best support the ARV.
Projected returns pro-forma
-3.0% appreciation · 3.66% rent growth · sell at horizon
- IRR
- -23.7%
- Equity multiple
- 0.18×
- Total profit
- $-79,886
- Equity at exit
- $52,186
- IRR
- -17.1%
- Equity multiple
- 0.03×
- Total profit
- $-94,727
- Equity at exit
- $30,262
Cash invested: $98,000 (down + closing). Projections, not guarantees.
Landlord ↔ Tenant lean methodology
- Overall (STATE)
- 90 Strongly Landlord-Friendly
- State Georgia
- 90 Strongly Landlord-Friendly · R+3
- County
- — inherits STATE
- City
- — inherits STATE
ZIP-level market 30126
- Rents YoY
- 3.7%
- Active inventory
- 405
- Price-to-rent
- 11.9×
Monthly cashflow live
- Estimated rent
- $2,458 high interval (Pro) →
- Mortgage (P&I)
- −$1,835
- Tax from tax record
- −$350 /mo · $4,203/yr
- Insurance
- −$146
- HOA
- −$0
- Vacancy / Maint / Mgmt
- −$516
- Net cashflow
- $-389
Break-even live
Sensitivity live
| Price | -10% $-191 | -5% $-290 | +0% $-389 | +5% $-488 | +10% $-587 |
|---|---|---|---|---|---|
| Rent | -10% $-584 | -5% $-486 | +0% $-389 | +5% $-292 | +10% $-195 |
| Rate | -1.0pp $-213 | -0.5pp $-300 | base $-389 | +0.5pp $-480 | +1.0pp $-572 |
UW: 25.0% down · 7.5% · 30yr · 1.5% tax · 5.0% vac · 8.0% maint · 8.0% mgmt
Financing live
Cash to close
- Down payment
- $87,500
- Closing costs
- $10,500
- Reserves months
- —
- Total cash needed
- —
Loan-product check · same deal, 3 products live
Conventional
25% down · 7.5% · 30yr
- Down + closing
- —
- Monthly P&I
- —
- Monthly cashflow
- —
- DSCR
- —
- Eligible?
- —
Personal DTI + credit; lowest rate.
DSCR
20% down · 8.5% · 30yr
- Down + closing
- —
- Monthly P&I
- —
- Monthly cashflow
- —
- DSCR
- —
- Eligible?
- —
No personal income docs; deal must DSCR.
Hard money
10% down · 12.0% · 12mo
- Down + closing
- —
- Monthly P&I
- —
- Monthly cashflow
- —
- DSCR
- —
- Eligible?
- —
Short-term bridge; refi at stabilization.
Rent comps 13 comps
| Address | Beds | Baths | Sqft | Rent | $/sqft | DOM | Units | Dist |
|---|---|---|---|---|---|---|---|---|
| 493 Benson Hurst Dr SW Mableton, GA | 4.0 | 2.5 | 2250 | $2,450 | $1.09 | 20d | 1 | 0.03mi |
| 485 Valley Creek Rd SW Mableton, GA | 4.0 | 2.0 | 1950 | $2,179 | $1.12 | 24d | 1 | 0.34mi |
| 4250 Tin Hare Ln SW Mableton, GA | 3.0 | 2.5 | 2030 | $2,800 | $1.38 | 26d | 1 | 0.51mi |
| 4897 Conductor Way SW Mableton, GA | 4.0 | 2.5 | 2106 | $2,950 | $1.40 | 1d | 1 | 0.71mi |
| 620 Gregory Manor Dr SW Smyrna, GA | 3.0 | 2.5 | 2429 | $2,425 | $1.00 | 24d | 1 | 0.81mi |
| 4292 Gregory Ln SW Smyrna, GA | 4.0 | 3.0 | 2230 | $3,625 | $1.63 | 45d | 1 | 0.87mi |
| 4667 Glore Rd SW Mableton, GA | 4.0 | 2.0 | 1857 | $5,800 | $3.12 | 45d | 1 | 0.92mi |
| 1073 Wisteria Dr SW Mableton, GA | 2.0 | 1.0 | 1964 | $1,295 | $0.66 | 26d | 1 | 1.04mi |
| 5161 Madison Green Dr SW Mableton, GA | 4.0 | 3.5 | 3054 | $8,450 | $2.77 | 45d | 1 | 1.18mi |
| 1056 Whistle Dr Austell, GA | 3.0 | 2.0 | 2254 | $2,240 | $0.99 | 1d | 1 | 1.19mi |
| 5485 Blossomwood TRL SW #4 Mableton, GA | 3.0 | 4.0 | 2040 | $2,550 | $1.25 | 7d | 1 | 1.32mi |
| 3979 Covey Flush Ct SW Smyrna, GA | 3.0 | 3.5 | 2491 | $2,300 | $0.92 | 24d | 1 | 1.46mi |
| 4265 Fawn Ln SE Smyrna, GA | 3.0 | 2.0 | 1769 | $2,652 | $1.50 | 26d | 1 | 1.49mi |
Listing history 19 events
-
2026-06-21days on market $350,000 Active 24 DOM
-
2026-06-18days on market $350,000 Active 21 DOM
-
2026-06-17days on market $350,000 Active 20 DOM
-
2026-06-16days on market $350,000 Active 19 DOM
-
2026-06-15days on market $350,000 Active 18 DOM
-
2026-06-13days on market $350,000 Active 16 DOM
-
2026-06-13days on market $350,000 Active 15 DOM
-
2026-06-09days on market $350,000 Active 12 DOM
-
2026-06-08days on market $350,000 Active 11 DOM
-
2026-06-07days on market $350,000 Active 10 DOM
-
2026-06-04days on market $350,000 Active 7 DOM
-
2026-06-03days on market $350,000 Active 6 DOM
-
2026-06-02days on market $350,000 Active 5 DOM
-
2026-06-01days on market $350,000 Active 4 DOM
-
2026-05-31days on market $350,000 Active 3 DOM
-
2026-05-27$350,000 Active
Show marketing remark (618 chars)
This 5-bedroom, 3-bathroom two-story home is an ideal investor special for those looking for a high-potential project. The property features a desirable open floorplan that provides a modern, airy feel through the main living areas, which are finished with a mix of laminate flooring and carpeting. The kitchen is equipped with durable Formica countertops and leads toward a private backyard, offering plenty of space for outdoor improvements. With five full bedrooms and three bathrooms, this home has the structural layout and square footage to become a high-value asset once the necessary renovations are completed.
-
2026-05-27$350,000 New 618-char remark
Show marketing remark (618 chars)
This 5-bedroom, 3-bathroom two-story home is an ideal investor special for those looking for a high-potential project. The property features a desirable open floorplan that provides a modern, airy feel through the main living areas, which are finished with a mix of laminate flooring and carpeting. The kitchen is equipped with durable Formica countertops and leads toward a private backyard, offering plenty of space for outdoor improvements. With five full bedrooms and three bathrooms, this home has the structural layout and square footage to become a high-value asset once the necessary renovations are completed.
-
1993-10-19soldstatus $114,000
-
1979-01-01soldstatus $56,000
ⓘ Source: listings_history table (triggers on properties + properties_extension) + one-shot
backfill from property_details.listing_events for pre-trigger history.
Tax reassessment forecast GA · Resets to sale price
- Current annual tax
- $4,203 · $350/mo
- Projected year-2 tax
- $4,203 · $350/mo
- Expected delta
- $0/yr ($0/mo · 0.0%)
ⓘ Screening estimate from a state-policy table — verify with the county assessor before closing.
Climate risk First Street
- Flood 1/10 Low FEMA zone X (unshaded) · 0% chance over 30 yrs
- Wildfire 1/10 Low
- Heat 5/10 Major 7 d/yr ≥103°F today · 18 d/yr by 30 yrs out
- Wind 5/10 Major 25% chance of damaging wind over 30 yrs
- Air quality 4/10 Moderate 4 unhealthy d/yr today · 5 by 30 yrs out
Nearby sold comps map
Loading sold comps map…
Walkable amenities ~0.75 mi
Loading nearby amenities…
Taxation est. · year 1
- Rental income
- $29,501
- − Mortgage interest
- −$19,605
- − Property taxes
- −$4,203
- − Insurance
- −$1,750
- − Repairs & maintenance
- −$2,360
- − Management
- −$2,360
- − Depreciation
- −$10,182
- Taxable loss
- −$10,959
- Est. tax savings @ 24.0%
- +$2,630
- After-tax cash flow
- $-2,042/yr
For passive investors: Depreciation is non-cash, so a rental often shows a tax loss while cash-flowing — sheltering income. Rental losses are passive: they offset passive income freely, and up to $25,000/yr can offset ordinary (W-2) income if you actively participate and your MAGI is under $100k (phasing out to $0 by $150k); unused losses carry forward. On sale, claimed depreciation is recaptured at up to 25%, and gains may owe capital-gains tax (a 1031 exchange can defer both). Figures are a year-1 estimate at your 24.0% rate — not tax advice; consult a CPA.
Schools (NCES district)
- District
- Cobb County
- NCES district ID
- 1301290
- Math proficiency
- 39% ▼ -15.00%
- Reading proficiency
- 45% ▼ -10.00%
- Median HH income
- $68,845
- Composite
- 37.93/100
- National rank
- #4308
- State rank
- #25 of 174 in GA
Livability — Mableton
- Score
- 70/100
- State rank
- #94
- US rank
- #7534
Category grades
Schools grade is shown separately in the Schools card above.
Census & demographics
- Census place
- Mableton, GA
- County
- Cobb County · 777,758 people
- City population
- 41,829
- Metro
- Atlanta-Sandy Springs-Alpharetta, GA
- Population (ZIP)
- 41,829
- Household income
- $101,891
- Rent vs Own
- Severe rent burden
- 1046.0
Population outlook (Cobb County) Hauer SSP2
- Today (2025)
- 868,385 people
- By 2030
- 929,614 · +7.1%
- By 2040
- 1,047,533 · +20.6%
- By 2050
- 1,155,537 · +33.1%
- By 2075
- 1,405,030 · +61.8%
- By 2100
- 1,555,058 · +79.1%
Race, ethnicity, and origin ACS 2023
- Neighborhood character
- Diverse neighborhood (Simpson 0.69)
- Race & ethnicity
- Black 42% White 30% Hispanic / Latino 20% Two or more races 8% Asian 4% Native American 1%
- Hispanic origin (detail)
- Mexican 11% Cuban 1%
- Common ancestry
- Slovak 1% Italian 1% Lithuanian 1%
- Foreign-born
- 16% · Canada, China
- Languages at home
- 77% English-only · Spanish 17% Other Indo-European 3% French/Haitian/Cajun 1%
Political lean MEDSL · Cobb
- 2024 margin
- D (+14.9) · D 56.9% · R 42.0% · Other 1.1%
- 2008→2024 swing
- +24.3pp toward D · 2008: -9.4pp · 2024: 14.9pp
- All cycles
- 2024: D+14.9 2020: D+14.3 2016: D+2.1 2012: R+12.6 2008: R+9.4
Not yet ingested
- Civics
- —
Market trends
- HPI YoY
- ▼ -239.35%
- Current HPI
- 230.378
- Rent YoY
- ▲ 3.66%
- Metro
- Atlanta-Sandy Springs-Alpharetta, GA
- State GDP YoY
- ▲ 2.66%
- F500 in state
- 28
Industry mix (Fortune 500 HQ in GA)
| Industry | F500 HQs | Revenue |
|---|---|---|
| Paper / Packaging | 2 | $29B |
|
||
| Retail | 1 | $160B |
|
||
| Transportation / Logistics | 1 | $91B |
|
||
| Airlines | 1 | $62B |
|
||
| Consumer Goods | 1 | $47B |
|
||
| Utilities | 1 | $25B |
|
||
Price history
+525.0% since first listed4 events — show timeline
- 2026-05-27 Listed $350,000 GAMLS
- 2026-05-27 Listed $350,000 FMLS
- 1993-10-19 Sold (Public Records) $114,000 Public Records
- 1979-01-01 Sold (Public Records) $56,000 Public Records
Property tax history
+7.4%/yrLatest (2025): $4,203 · +7.3% YoY. Source: county tax records.
Cash-flow waterfall
monthlySold comps — $/sqft
last 12 mo · ≤1 miLoading sold comps…