 🏷️ Likely Rental
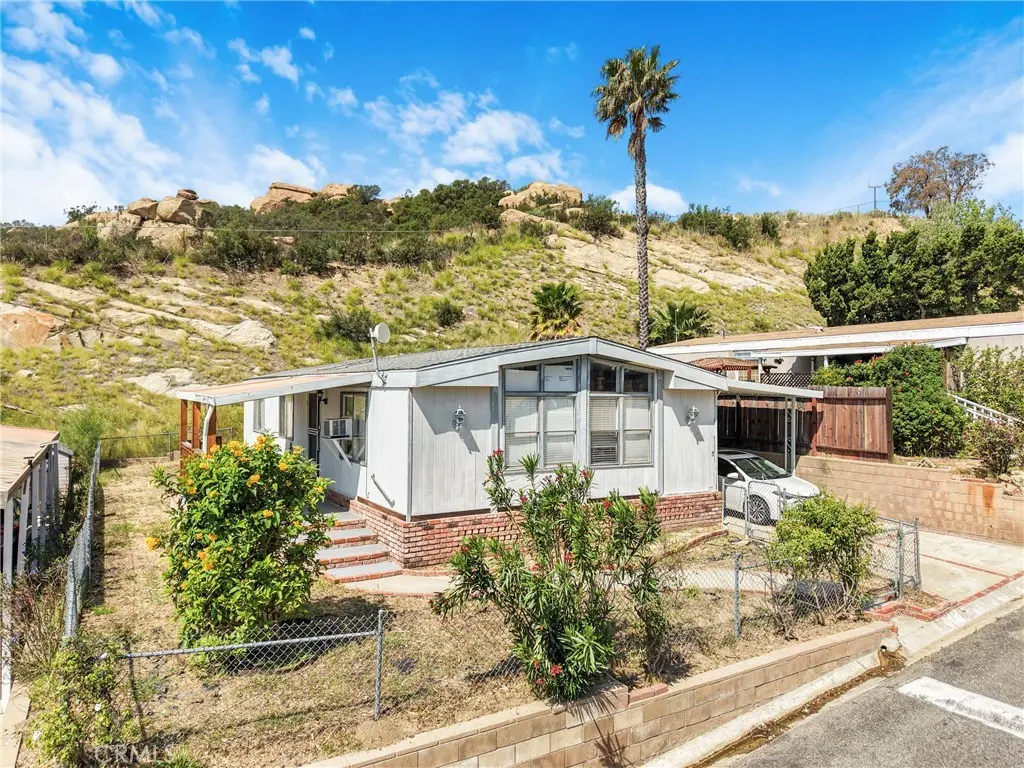
24425 Woolsey Canyon Rd #5 · Los Angeles, CA
Flood risk 7/10 · Major
- FEMA flood zone
- D
- Chance of flooding over 30 yrs
- 0.6%
- Est. flood insurance / yr
- $544 – $1,084
Fire risk 7/10 · Major
- Est. fire insurance / yr
- $659 – $1,223
Heat risk 4/10 · Minor
- Hot days now (above 101°F)
- 7 days/yr
- Hot days in 30 yrs
- 20 days/yr
Wind risk 1/10 · Minimal
- Chance of severe wind over 30 yrs
- —
Air-quality risk 4/10 · Minor
- Unhealthy air days now
- 6 days/yr
- Unhealthy air days in 30 yrs
- 6 days/yr
Risk factors via First Street. Map © Google.
Why this score? — see what drove the C- grade
The composite is a weighted blend of 9 inputs, each scored 0–100. Each bar is that input's sub-score; the figure is the points it added to the 100-point composite (weight × sub-score).
- Cash flow +15.0/30.0
- ARV discount +15.0/15.0
- 1% rule +5.0/10.0
- DSCR +5.0/10.0
- Schools +3.6/10.0
- Livability +3.4/5.0
- Condition / age +2.8/5.0
- Rent growth +1.7/5.0
- Appreciation +0.0/10.0
$102,000
🖨 Deal sheet 📄 Offer letter ✓ Due diligence
Listing remarks MLS
Rare opportunity to own one of the more spaciously situated homes in Summit Mobile Home Park. This double wide sits in a less dense pocket of the community where majestic mountain backdrops meet sweeping valley views that come alive at night. Beyond the setting, residents enjoy a pet friendly lifestyle with access to a pool, spa, and clubhouse, plus available RV parking and some of the best walking, hiking, and biking trails the West Hills area has to offer. Shopping, dining, and freeway access are minutes away, with Westfield Topanga and The Village a short fifteen minute drive. Room to breathe, a view worth coming home to, and a community that delivers.
Key facts
- Access to spa
- Access to clubhouse
- Available rv parking
Tags
Neighborhood map
What this means for you Summary
Snapshot
- This is a 2-bed/2.0-bath manufactured listed at $102k. Condition is rated average.
Deal economics
- At list price, monthly cash flow is $3k ($33k/yr) — positive.
- The deal already cash-flows at list — no discount required.
- Meets the 1% rule at list price ($4k rent vs $102k).
- Recommended offer: $96k (6.0% below list) — sets the bar for market timing.
- Cap rate 39.3% vs local median 2.1% in Los Angeles — top-decile yield for the area; either an underpriced asset or a hidden risk that comps aren't pricing in. Stress-test before assuming the spread holds.
Location & tenants
- Location reads 68/100 on livability (#273 in CA) — a middle-class / working-renter tenant base. Strengths: amenities A+, commute A+, employment B; Watch: health & safety C-, schools D+, crime F.
- Los Angeles Unified (urban): math 29% / reading 54% proficiency, ranked #223 of 517 in CA (top 43%) — families likely to look elsewhere, expect single-tenant / working-renter base with shorter leases; 67% free/reduced lunch — lower-income household profile, screen leases tightly.
- Market conditions: Rents falling (-3.2%/yr); 122 active listings in the ZIP; 4 comparable units currently listed for rent nearby; rentals lingering (median 44d on market — plan ~5-8 weeks vacancy on turnover, expect pricing pressure); 50% of comp listings sitting > 30 days — soft ceiling on asking rent; solid renter incomes; 19,697 units permitted in Los Angeles County in 2024 (9,426 in 5+ unit buildings).
- At $4,331/mo this rent would consume 58% of the median local household income ($90k/yr) (locally 2821% of renters already pay >50% of income on rent) — very limited rent-growth headroom before tenants either downsize or default.
Forward outlook
- Local home prices are declining (-3.0%/yr); year-one equity from $705 of loan paydown is wiped out by about $3k of value loss. Plan a longer hold.
- Los Angeles County population projected at +9% by 2050 — modest demand growth; plan on rents tracking national, not racing it.
- At projected returns (-3.0% appreciation + 0.0% rent growth), your $29k cash investment doubles in ~1 year — after that, you're playing with house money.
Negotiation context
- It's been on market 80 days — a 6% lower offer ($96k) is reasonable based on typical stale-listing flexibility.
Risks & watch-outs
- Watch-outs: flood insurance adds $68/mo.
- Climate carrying-cost: major flood risk; major wildfire risk — expect insurance premiums to compound above CPI over the hold.
Questions for the listing agent
- It's been on market 80 days. Have you received any prior offers? Is the seller open to a 6% concession, seller financing, or rate buy-down credit?
- What's the actual annual flood-insurance premium (NFIP or private), and is the property in a SFHA with mandatory coverage?
- Why hasn't it sold? Are there any deal-killer items the seller is aware of (foundation, flood, title, zoning, code violations)?
- Is there a deadline driving the sale (1031 exchange, divorce, estate, relocation)? That informs how much negotiation room exists.
- Schools are D-rated, which usually means shorter tenancies and higher turnover. Who's the typical renter profile here, and what's been the actual vacancy rate?
- Crime grade is F in this area — have there been break-ins, vandalism, or insurance claims at this property in the last 3 years? What carrier currently insures it and at what premium?
- What's the average days-on-market for RENTAL listings here right now (not sales)? A rising rental-DOM trend means longer vacancies and softer asking-rent achievability than the comps imply.
- What's the recent tenant-quality profile in this submarket — average credit score on applications, eviction rate, late-payment / NSF rate, and stable-employment percentage? A property-management company in the area should have these aggregated.
- How much new for-sale + rental construction is in the pipeline within 1–3 miles? Heavy new supply typically softens prices + rents 12–24 months out; constrained supply supports both.
Investment metrics
- 1% rule
- 4.25% ✓
- Cap rate
- 39.25%
- Cash-on-cash
- 117.70%
- DSCR
- 6.24
- GRM
- 2.0
CMA / ARV
- ARV (median comp)
- $144,079
- List price
- $102,000
- Delta
- -29.21%
- Verdict
- UNDERPRICED
- Comps
- 20 within 1.0 mi
Show comp detail 11 sales within ~0.75 mi
| Address | Dist | Beds/Ba | Sqft | Sold | Price | $/sf | Match |
|---|---|---|---|---|---|---|---|
| 24425 Woolsey Canyon Rd #92 | 0.00mi | 2/2.0 | 1,152 (0%) | 1mo | $193,000 | $168 | 99 |
| 24425 Woolsey Canyon Rd #132 | 0.00mi | 3/2.0 (+1) | 1,143 (-1%) | 1mo | $150,000 | $131 | 92 |
| 24303 Woolsey Canyon Rd #19 | 0.28mi | 3/2.0 (+1) | 1,152 (0%) | 2mo | $180,000 | $156 | 80 |
| 24425 Woolsey Canyon Rd #85 | 0.00mi | 2/2.0 | 1,056 (-8%) | 10mo | $145,000 | $137 | 78 |
| 24425 Woolsey Canyon Rd #169 | 0.00mi | 2/2.0 | 1,056 (-8%) | 10mo | $129,000 | $122 | 78 |
| 24425 Woolsey Canyon Rd #87 | 0.00mi | 3/2.0 (+1) | 1,200 (+4%) | 14mo | $147,000 | $123 | 77 |
| 24303 Woolsey Cyn #154 | 0.28mi | 2/2.0 | 1,152 (0%) | 14mo | $100,000 | $87 | 75 |
| 24425 Woolsey Canyon Rd #8 | 0.00mi | 2/2.0 | 1,056 (-8%) | 15mo | $106,000 | $100 | 73 |
| 24425 Woolsey Cyn #141 | 0.00mi | 3/2.0 (+1) | 1,296 (+12%) | 13mo | $152,000 | $117 | 63 |
| 24303 Woolsey Cyn #26 | 0.28mi | 2/2.0 | 1,248 (+8%) | 19mo | $149,000 | $119 | 57 |
| 24303 Woolsey Canyon Rd #111 | 0.28mi | 2/2.0 | 1,248 (+8%) | 23mo | $159,000 | $127 | 54 |
Match score weights: distance 35% · size 25% · config 20% · recency 20%. Top-matched comps best support the ARV.
Projected returns pro-forma
-3.0% appreciation · 0.0% rent growth · sell at horizon
- IRR
- —
- Equity multiple
- 6.07×
- Total profit
- $144,935
- Equity at exit
- $15,209
- IRR
- —
- Equity multiple
- 11.56×
- Total profit
- $301,562
- Equity at exit
- $8,819
Cash invested: $28,560 (down + closing). Projections, not guarantees.
Landlord ↔ Tenant lean methodology
- Overall (CITY)
- 0 Strongly Tenant-Friendly
- State California
- 18 Strongly Tenant-Friendly · D+13
- County
- — inherits STATE
- City Los Angeles
- 0 Strongly Tenant-Friendly · D+22
ZIP-level market 91304
- Rents YoY
- -3.2%
- Active inventory
- 122
- Price-to-rent
- 2.0×
Monthly cashflow live
- Estimated rent
- $4,331 medium interval (Pro) →
- Mortgage (P&I)
- −$535
- Tax from tax record
- −$43 /mo · $512/yr
- Insurance
- −$42
- Flood insurance flood zone
- −$68 /mo · $814/yr
- HOA
- −$0
- Vacancy / Maint / Mgmt
- −$909
- Net cashflow
- $2,734
Break-even live
UW: 25.0% down · 7.5% · 30yr · 1.5% tax · 5.0% vac · 8.0% maint · 8.0% mgmt
Financing live
Cash to close
- Down payment
- $25,500
- Closing costs
- $3,060
- Reserves months
- —
- Total cash needed
- —
Loan-product check · same deal, 3 products live
Conventional
25% down · 7.5% · 30yr
- Down + closing
- —
- Monthly P&I
- —
- Monthly cashflow
- —
- DSCR
- —
- Eligible?
- —
Personal DTI + credit; lowest rate.
DSCR
20% down · 8.5% · 30yr
- Down + closing
- —
- Monthly P&I
- —
- Monthly cashflow
- —
- DSCR
- —
- Eligible?
- —
No personal income docs; deal must DSCR.
Hard money
10% down · 12.0% · 12mo
- Down + closing
- —
- Monthly P&I
- —
- Monthly cashflow
- —
- DSCR
- —
- Eligible?
- —
Short-term bridge; refi at stabilization.
Rent comps 4 comps
| Address | Beds | Baths | Sqft | Rent | $/sqft | DOM | Units | Dist |
|---|---|---|---|---|---|---|---|---|
| 110 Box Canyon Rd Canoga Park, CA | 3.0 | 2.0 | 1500 | $7,000 | $4.67 | 1d | 1 | 0.67mi |
| 8808 Chatlake Dr West Hills, CA | 3.0 | 1.0 | 1250 | $4,250 | $3.40 | 18d | 1 | 0.97mi |
| 9251 Notre Dame Ave Chatsworth, CA | 3.0 | 2.0 | 1310 | $4,200 | $3.21 | 43d | 1 | 1.37mi |
| 9552 Ventura Way Chatsworth, CA | 3.0 | 2.0 | 900 | $4,200 | $4.67 | 43d | 1 | 1.38mi |
Listing history 14 events
-
2026-06-18days on market $102,000 Active 80 DOM
-
2026-06-17days on market $102,000 Active 79 DOM
-
2026-06-16days on market $102,000 Active 78 DOM
-
2026-06-15days on market $102,000 Active 77 DOM
-
2026-06-13days on market $102,000 Active 75 DOM
-
2026-06-09days on market $102,000 Active 71 DOM
-
2026-06-08days on market $102,000 Active 70 DOM
-
2026-06-07days on market $102,000 Active 69 DOM
-
2026-06-04days on market $102,000 Active 66 DOM
-
2026-06-03days on market $102,000 Active 65 DOM
-
2026-06-02days on market $102,000 Active 64 DOM
-
2026-06-01days on market $102,000 Active 63 DOM
-
2026-05-31days on market $102,000 Active 62 DOM
-
2026-03-30$102,000 Active 663-char remark
Show marketing remark (663 chars)
Rare opportunity to own one of the more spaciously situated homes in Summit Mobile Home Park. This double wide sits in a less dense pocket of the community where majestic mountain backdrops meet sweeping valley views that come alive at night. Beyond the setting, residents enjoy a pet friendly lifestyle with access to a pool, spa, and clubhouse, plus available RV parking and some of the best walking, hiking, and biking trails the West Hills area has to offer. Shopping, dining, and freeway access are minutes away, with Westfield Topanga and The Village a short fifteen minute drive. Room to breathe, a view worth coming home to, and a community that delivers.
ⓘ Source: listings_history table (triggers on properties + properties_extension) + one-shot
backfill from property_details.listing_events for pre-trigger history.
Tax reassessment forecast CA · Resets to sale price
- Current annual tax
- $512 · $43/mo
- Projected year-2 tax
- $775 · $65/mo
- Expected delta
- +$263/yr (+$22/mo · 51.5%)
ⓘ Screening estimate from a state-policy table — verify with the county assessor before closing.
Climate risk First Street
- Flood 7/10 Severe FEMA zone D · 60% chance over 30 yrs
- Wildfire 7/10 Severe
- Heat 4/10 Moderate 7 d/yr ≥101°F today · 20 d/yr by 30 yrs out
- Wind 1/10 Low
- Air quality 4/10 Moderate 6 unhealthy d/yr today · 6 by 30 yrs out
Nearby sold comps map
Loading sold comps map…
Walkable amenities ~0.75 mi
Loading nearby amenities…
Taxation est. · year 1
- Rental income
- $51,971
- − Mortgage interest
- −$5,714
- − Property taxes
- −$512
- − Insurance
- −$1,324
- − Repairs & maintenance
- −$4,158
- − Management
- −$4,158
- − Depreciation
- −$2,967
- Taxable income
- $33,139
- Est. tax owed @ 24.0%
- −$7,953
- After-tax cash flow
- $24,849/yr
For passive investors: Depreciation is non-cash, so a rental often shows a tax loss while cash-flowing — sheltering income. Rental losses are passive: they offset passive income freely, and up to $25,000/yr can offset ordinary (W-2) income if you actively participate and your MAGI is under $100k (phasing out to $0 by $150k); unused losses carry forward. On sale, claimed depreciation is recaptured at up to 25%, and gains may owe capital-gains tax (a 1031 exchange can defer both). Figures are a year-1 estimate at your 24.0% rate — not tax advice; consult a CPA.
Condition & rehab AI · 12 photos
This mid-level rehab property offers a good opportunity for an investor to improve its curb appeal and interior aesthetics, enhancing its resale and rental value.
Repairs flagged
- Moderate siding — Weathered and discolored
- Moderate paint — Worn paint on walls and exterior
- Moderate landscaping — Overgrown areas need trimming
Value-add opportunities
- Both painting and repainting — Enhances curb appeal and interior aesthetics
- Both landscaping — Improves curb appeal and enhances property value
- Rental HVAC maintenance — Ensures comfort and energy efficiency
Renovation cost estimate screening
| Repair item | Severity | Est. cost |
|---|---|---|
| siding · Weathered and discolored | Moderate | $3,000–15,000 |
| paint · Worn paint on walls and exterior | Moderate | $3,000–15,000 |
| landscaping · Overgrown areas need trimming | Moderate | $3,000–15,000 |
| Total estimated repair cost · 3 items | $9,000–45,000 |
Value-add ROI direction
- Both painting and repainting — Enhances curb appeal and interior aesthetics ↑
- Both landscaping — Improves curb appeal and enhances property value ↑
- Rental HVAC maintenance — Ensures comfort and energy efficiency ↑
ⓘ Cost ranges are severity-bucket heuristics (US national rule-of-thumb). Get contractor quotes + a written scope before underwriting a rehab budget.
Schools (NCES district)
- District
- Los Angeles Unified
- NCES district ID
- 0622710
- Math proficiency
- 29% ▼ -4.00%
- Reading proficiency
- 54% ▲ 10.00%
- Median HH income
- $50,403
- Composite
- 35.67/100
- National rank
- #4875
- State rank
- #223 of 517 in CA
Livability — Los Angeles
- Score
- 68/100
- State rank
- #273
- US rank
- #9237
Category grades
Schools grade is shown separately in the Schools card above.
Census & demographics
- County
- Los Angeles County · 9,444,647 people
- City population
- 3,838,149
- Metro
- Los Angeles-Long Beach-Anaheim, CA
- Population (ZIP)
- 52,474
- Household income
- $90,007
- Rent vs Own
- Severe rent burden
- 2821.0
Population outlook (Los Angeles County) Hauer SSP2
- Today (2025)
- 10,940,515 people
- By 2030
- 11,256,481 · +2.9%
- By 2040
- 11,729,929 · +7.2%
- By 2050
- 11,948,407 · +9.2%
- By 2075
- 11,818,114 · +8.0%
- By 2100
- 10,842,928 · -0.9%
Race, ethnicity, and origin ACS 2023
- Neighborhood character
- Diverse neighborhood (Simpson 0.69)
- Race & ethnicity
- Hispanic / Latino 42% White 32% Asian 17% Two or more races 11% Black 4%
- Hispanic origin (detail)
- Mexican 26%
- Common ancestry
- Scotch-Irish 2% Romanian 2% Slovak 1%
- Foreign-born
- 38% · Canada, Vietnam, China
- Languages at home
- 45% English-only · Spanish 34% Other Indo-European 8% Tagalog/Filipino 4%
Political lean MEDSL · Los Angeles
- 2024 margin
- Solid D (+32.9) · D 64.8% · R 31.9% · Other 3.3%
- 2008→2024 swing
- -7.4pp toward R · 2008: 40.4pp · 2024: 32.9pp
- All cycles
- 2024: D+32.9 2020: D+44.2 2016: D+48.0 2012: D+40.0 2008: D+40.4
Not yet ingested
- Civics
- —
Market trends
- HPI YoY
- ▼ -805.65%
- Current HPI
- 351.4216
- Rent YoY
- ▼ -3.21%
- Metro
- Los Angeles-Long Beach-Anaheim, CA
- State GDP YoY
- ▲ 3.21%
- F500 in state
- 116
Industry mix (Fortune 500 HQ in CA)
| Industry | F500 HQs | Revenue |
|---|---|---|
| Technology | 27 | $1,492B |
|
||
| Financial Services | 3 | $174B |
|
||
| Retail | 3 | $44B |
|
||
| Insurance | 3 | $26B |
|
||
| Media / Entertainment | 2 | $115B |
|
||
| Pharmaceuticals / Biotech | 2 | $62B |
|
||
Price history
1 event — show timeline
- 2026-03-30 Listed $102,000 CRMLS
Property tax history
+25.4%/yrLatest (2025): $512 · +25.4% YoY. Source: county tax records.
Cash-flow waterfall
monthlySold comps — $/sqft
last 12 mo · ≤1 miLoading sold comps…