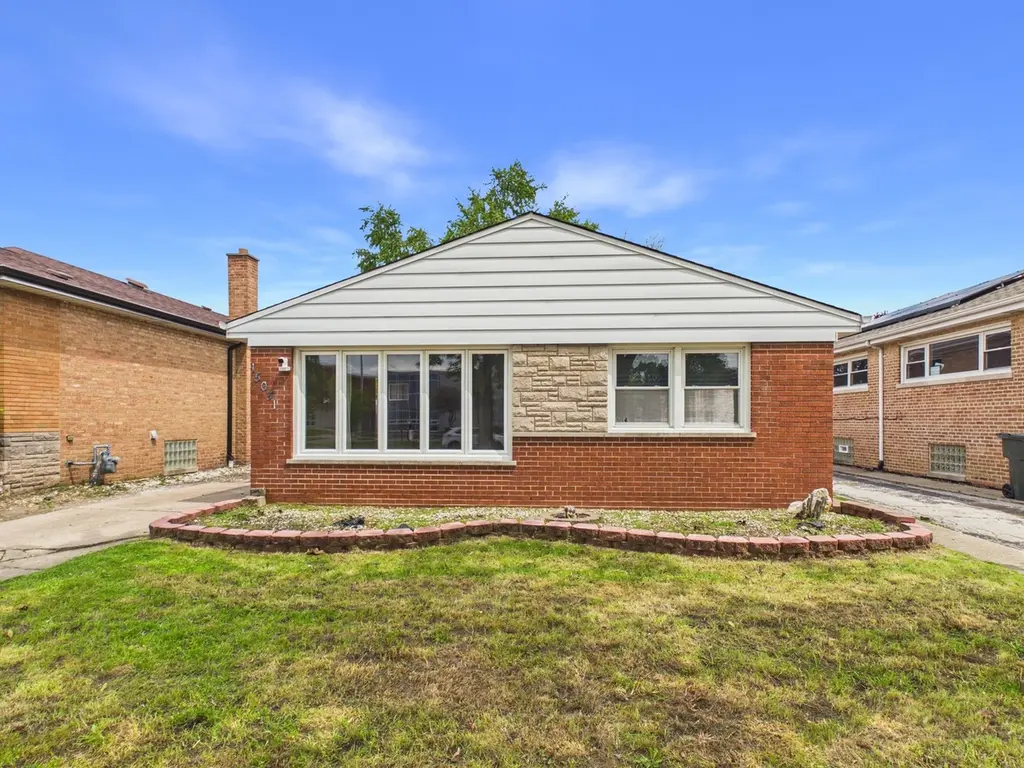
15031 Cottage Grove Ave · Dolton, IL
Flood risk 1/10 · Minimal
- FEMA flood zone
- X (unshaded)
- Chance of flooding over 30 yrs
- 0.0%
- Est. flood insurance / yr
- $473 – $860
Fire risk 1/10 · Minimal
- Est. fire insurance / yr
- $804 – $1,492
Heat risk 3/10 · Minor
- Hot days now (above 101°F)
- 7 days/yr
- Hot days in 30 yrs
- 15 days/yr
Wind risk 2/10 · Minimal
- Chance of severe wind over 30 yrs
- —
Air-quality risk 4/10 · Minor
- Unhealthy air days now
- 4 days/yr
- Unhealthy air days in 30 yrs
- 5 days/yr
Risk factors via First Street. Map © Google.
Why this score? — see what drove the B+ grade
The composite is a weighted blend of 9 inputs, each scored 0–100. Each bar is that input's sub-score; the figure is the points it added to the 100-point composite (weight × sub-score).
- Cash flow +30.0/30.0
- ARV discount +15.0/15.0
- 1% rule +10.0/10.0
- DSCR +10.0/10.0
- Rent growth +4.9/5.0
- Livability +3.7/5.0
- Condition / age +2.5/5.0
- Schools +0.7/10.0
- Appreciation +0.0/10.0
$135,500
🖨 Deal sheet 📄 Offer letter ✓ Due diligence
Listing remarks
Welcome to Craftsman House Remodeled to PERFECTION. Fully Rehabbed INside and OUTside with ALL PASSED VILLAGE INSPECTIONS! Ready for any Weather Conditions with New Windows, Electrical, Plumbing and much more. Contemporary Remodeled Kitchen, Brand New Appliances, Quartz Countertops, Bright and Spacious Floor Plan. Lovely 2 Full Baths on each Level. Get Ready to be Impressed :) Schedule a Showing Today!
Key facts
- Quartz countertops
- Remodeled kitchen
- Full baths
Tags
Neighborhood map
What this means for you Summary
Snapshot
- This is a 3-bed/1.5-bath single-family listed at $136k.
Deal economics
- At list price, monthly cash flow is $1k ($13k/yr) — positive.
- The deal already cash-flows at list — no discount required.
- Meets the 1% rule at list price ($3k rent vs $136k).
- Recommended offer: $133k (1.5% below list) — sets the bar for market timing.
- Cap rate 15.5% vs local median 9.3% in Dolton — top-decile yield for the area; either an underpriced asset or a hidden risk that comps aren't pricing in. Stress-test before assuming the spread holds.
Location & tenants
- Location reads 74/100 on livability (#263 in IL, #4,883 nationally) — a middle-class / working-renter tenant base. Strengths: commute A+, cost of living A+, housing A+; Watch: employment C-, health & safety C-, schools F.
- Thornton Twp Hsd 205 (suburban): math 7% / reading 8% proficiency, ranked #594 of 620 in IL (top 96%) — low school quality limits family demand, transient renter base, plan for 1-2y turnover.
- Market conditions: Rents rising fast (+9.7%/yr); 130 active listings in the ZIP; 19 comparable units currently listed for rent nearby; rentals leasing fast (median 11d on market — plan ~1-2 weeks tenant-placement turnaround); 6,272 units permitted in Cook County in 2024 (4,658 in 5+ unit buildings).
- At $2,505/mo this rent would consume 52% of the median local household income ($58k/yr) (locally 919% of renters already pay >50% of income on rent) — very limited rent-growth headroom before tenants either downsize or default.
Forward outlook
- Local home prices are declining (-3.0%/yr); year-one equity from $937 of loan paydown is wiped out by about $4k of value loss. Plan a longer hold.
- At projected returns (-3.0% appreciation + 8.0% rent growth), your $38k cash investment doubles in ~4 years — after that, you're playing with house money.
Negotiation context
- It's been on market 29 days — a 2% lower offer ($133k) is reasonable based on typical stale-listing flexibility.
- 15 sale attempts since 4y ago; this cycle's ask has dropped $12k (8%) from the opening price — seller is motivated, your offer sets the floor, not the list.
- Current owner paid $110k; 24% above their basis — modest negotiation headroom, anchor on the comps not their cost.
Risks & watch-outs
- Watch-outs: built in 1959 — expect roof / HVAC / electrical / plumbing capex.
Questions for the listing agent
- Built in 1959 — when were the roof, HVAC, electrical panel, plumbing, and water heater last replaced?
- Is there a deadline driving the sale (1031 exchange, divorce, estate, relocation)? That informs how much negotiation room exists.
- Schools are F-rated, which usually means shorter tenancies and higher turnover. Who's the typical renter profile here, and what's been the actual vacancy rate?
- Crime grade is D in this area — have there been break-ins, vandalism, or insurance claims at this property in the last 3 years? What carrier currently insures it and at what premium?
- What's the average days-on-market for RENTAL listings here right now (not sales)? A rising rental-DOM trend means longer vacancies and softer asking-rent achievability than the comps imply.
- What's the recent tenant-quality profile in this submarket — average credit score on applications, eviction rate, late-payment / NSF rate, and stable-employment percentage? A property-management company in the area should have these aggregated.
- How much new for-sale + rental construction is in the pipeline within 1–3 miles? Heavy new supply typically softens prices + rents 12–24 months out; constrained supply supports both.
Investment metrics
- 1% rule
- 1.85% ✓
- Cap rate
- 15.53%
- Cash-on-cash
- 32.98%
- DSCR
- 2.47
- GRM
- 4.5
CMA / ARV
- ARV (on-the-fly)
- $189,442
- Comps found
- 12
Show comp detail 12 sales within ~0.75 mi
| Address | Dist | Beds/Ba | Sqft | Sold | Price | $/sf | Match |
|---|---|---|---|---|---|---|---|
| 14927 Cottage Grove Ave | 0.14mi | 3/2.0 | 1,095 (-9%) | 1mo | $250,000 | $228 | 76 |
| 619 E 152nd St | 0.50mi | 3/1.5 | 1,146 (-4%) | 1mo | $153,000 | $134 | 69 |
| 15505 Drexel Ave | 0.57mi | 4/2.0 (+1) | 1,200 (+0%) | 2mo | $205,000 | $171 | 65 |
| 717 E 154th St | 0.45mi | 3/1.0 | 1,120 (-7%) | 2mo | $177,000 | $158 | 65 |
| 15043 Meadow Ln | 0.60mi | 3/1.0 | 1,151 (-4%) | 1mo | $130,000 | $113 | 62 |
| 14842 Shepard Dr | 0.70mi | 3/1.5 | 1,141 (-5%) | 2mo | $135,000 | $118 | 58 |
| 1138 E 151st St | 0.45mi | 3/1.5 | 1,056 (-12%) | 2mo | $210,000 | $199 | 58 |
| 14819 Evers St | 0.47mi | 4/2.0 (+1) | 1,304 (+9%) | 0mo | $227,000 | $174 | 56 |
| 15509 Rose Dr | 0.56mi | 2/1.0 (-1) | 1,100 (-8%) | 0mo | $135,000 | $123 | 53 |
| 15310 Oak St | 0.47mi | 4/1.5 (+1) | 1,037 (-14%) | 1mo | $190,000 | $183 | 49 |
| 15539 Minerva Ave | 0.73mi | 3/1.5 | 1,050 (-12%) | 2mo | $134,000 | $128 | 44 |
| 15518 Maple St | 0.70mi | 4/2.0 (+1) | 1,345 (+12%) | 1mo | $120,000 | $89 | 39 |
Match score weights: distance 35% · size 25% · config 20% · recency 20%. Top-matched comps best support the ARV.
Projected returns pro-forma
-3.0% appreciation · 8.0% rent growth · sell at horizon
- IRR
- 33.7%
- Equity multiple
- 2.52×
- Total profit
- $57,723
- Equity at exit
- $20,203
- IRR
- 43.3%
- Equity multiple
- 6.17×
- Total profit
- $196,176
- Equity at exit
- $11,716
Cash invested: $37,940 (down + closing). Projections, not guarantees.
Landlord ↔ Tenant lean methodology
- Overall (STATE)
- 43 Moderately Tenant-Leaning
- State Illinois
- 43 Moderately Tenant-Leaning · D+7
- County
- — inherits STATE
- City
- — inherits STATE
ZIP-level market 60419
- Home prices YoY
- -25.7%
- Rents YoY
- 9.7%
- Active inventory
- 130
- Price-to-rent
- 4.5×
Monthly cashflow live
- Estimated rent
- $2,505 high interval (Pro) →
- Mortgage (P&I)
- −$711
- Tax est. 1.5%
- −$169 /mo · $2,032/yr
- Insurance
- −$56
- HOA
- −$0
- Vacancy / Maint / Mgmt
- −$526
- Net cashflow
- $1,043
Break-even live
UW: 25.0% down · 7.5% · 30yr · 1.5% tax · 5.0% vac · 8.0% maint · 8.0% mgmt
Financing live
Cash to close
- Down payment
- $33,875
- Closing costs
- $4,065
- Reserves months
- —
- Total cash needed
- —
Loan-product check · same deal, 3 products live
Conventional
25% down · 7.5% · 30yr
- Down + closing
- —
- Monthly P&I
- —
- Monthly cashflow
- —
- DSCR
- —
- Eligible?
- —
Personal DTI + credit; lowest rate.
DSCR
20% down · 8.5% · 30yr
- Down + closing
- —
- Monthly P&I
- —
- Monthly cashflow
- —
- DSCR
- —
- Eligible?
- —
No personal income docs; deal must DSCR.
Hard money
10% down · 12.0% · 12mo
- Down + closing
- —
- Monthly P&I
- —
- Monthly cashflow
- —
- DSCR
- —
- Eligible?
- —
Short-term bridge; refi at stabilization.
Rent comps 19 comps
| Address | Beds | Baths | Sqft | Rent | $/sqft | DOM | Units | Dist |
|---|---|---|---|---|---|---|---|---|
| 14916 Langley Ave Dolton, IL | 3.0 | 1.5 | 1418 | $2,500 | $1.76 | 24d | 1 | 0.26mi |
| 14817 Champlain Ave Dolton, IL | 2.0 | 1.0 | 980 | $2,430 | $2.48 | 22d | 1 | 0.38mi |
| 15231 Hastings Dr Dolton, IL | 4.0 | 1.5 | 1487 | $2,146 | $1.44 | 7d | 1 | 0.58mi |
| 15238 Doctor Martin Luther King Junior Dr Unit 2W Dolton, IL | 2.0 | 1.0 | 800 | $1,500 | $1.88 | 10d | 1 | 0.61mi |
| 15509 Park Ln South Holland, IL | 4.0 | 1.5 | 1200 | $3,400 | $2.83 | 7d | 1 | 0.61mi |
| 15509 Park Ln South Holland, IL | 4.0 | 1.5 | 1200 | $3,400 | $2.83 | 24d | 1 | 0.61mi |
| 14500 Cottage Grove Ave Unit 3 Dolton, IL | 2.0 | 1.0 | 1000 | $1,475 | $1.48 | 24d | 1 | 0.76mi |
| 14716 Dorchester Ave Dolton, IL | 3.0 | 2.0 | 1250 | $2,800 | $2.24 | 19d | 1 | 0.83mi |
| 14738 Blackstone Ave Dolton, IL | 3.0 | 1.0 | 1017 | $2,400 | $2.36 | 10d | 1 | 0.91mi |
| 14433 Woodlawn Ave Dolton, IL | 4.0 | 2.0 | 1300 | $2,000 | $1.54 | 18d | 1 | 0.91mi |
| 14305 Irving Ave Unit 2 Dolton, IL | 3.0 | 1.0 | 1100 | $2,200 | $2.00 | 24d | 1 | 1.00mi |
| 14610 Blackstone Ave Dolton, IL | 3.0 | 1.0 | 1017 | $2,400 | $2.36 | 6d | 1 | 1.01mi |
| 409 Madison Ave Unit 2 Calumet City, IL | 3.0 | 1.5 | 1200 | $1,795 | $1.50 | 3d | 1 | 1.20mi |
| 16001 Avalon Ave South Holland, IL | 3.0 | 2.0 | 1136 | $3,330 | $2.93 | 6d | 1 | 1.25mi |
| 14844 Wabash Ave Dolton, IL | 3.0 | 1.5 | 1277 | $2,320 | $1.82 | 24d | 1 | 1.27mi |
| 660 Clyde Ave Calumet City, IL | 3.0 | 1.5 | 1400 | $1,750 | $1.25 | 3d | 1 | 1.36mi |
| 405 Clyde Ave Calumet City, IL | 3.0 | 1.0 | 973 | $2,300 | $2.36 | 1d | 1 | 1.38mi |
| 14124 Manor Ave Dolton, IL | 3.0 | 2.0 | 1440 | $2,390 | $1.66 | 24d | 1 | 1.50mi |
| 16246 Dobson Ave South Holland, IL | 3.0 | 2.0 | 1250 | $3,170 | $2.54 | 1d | 1 | 1.50mi |
Listing history 49 events
-
2026-06-18days on market $135,500 Active 29 DOM
-
2026-06-17days on market $135,500 Active 28 DOM
-
2026-06-16days on market $135,500 Active 27 DOM
-
2026-06-15days on market $135,500 Active 26 DOM
-
2026-06-13days on market $135,500 Active 24 DOM
-
2026-06-13days on market $135,500 Active 23 DOM
-
2026-06-09days on market $135,500 Active 20 DOM
-
2026-06-08days on market $135,500 Active 19 DOM
-
2026-06-07days on market $135,500 Active 18 DOM
-
2026-06-04pricedays on market $135,500 Active 15 DOM
-
2026-06-03days on market $147,500 Active 14 DOM
-
2026-06-02days on market $147,500 Active 13 DOM
-
2026-06-01days on market $147,500 Active 12 DOM
-
2026-05-31days on market $147,500 Active 11 DOM
-
2026-05-20historical
-
2026-05-20$147,500 Active
-
2025-12-22status Temporarily No Showings
-
2025-08-20historical
-
2025-08-20status Temporarily No Showings
-
2025-07-22historical
-
2025-07-22status Temporarily No Showings
-
2025-07-21historical
-
2025-07-21status Temporarily No Showings
-
2025-06-20historical
-
2025-06-20status Temporarily No Showings
-
2025-06-10historical
-
2025-03-04price
-
2025-02-04status Active
-
2025-02-01historical
-
2024-12-02price
-
2024-11-22price
-
2024-11-01Active
-
2023-05-09historical Contingent - No Showings
-
2023-05-08historical
-
2023-05-02Active
-
2023-05-02historical
-
2023-04-05Active
-
2023-04-05historical
-
2023-03-15Active
-
2023-03-15historical
-
2022-12-21Active
-
2022-12-21historical
-
2022-10-17Active
-
2022-06-09soldstatus $109,700 Closed
-
2022-04-27historical Contingent - Continue to Show
-
2022-04-14status Active
-
2022-04-08historical Contingent - Continue to Show
-
2022-02-24$99,900 Active
-
1987-07-01soldstatus $65,000
ⓘ Source: listings_history table (triggers on properties + properties_extension) + one-shot
backfill from property_details.listing_events for pre-trigger history.
Climate risk First Street
- Flood 1/10 Low FEMA zone X (unshaded) · 0% chance over 30 yrs
- Wildfire 1/10 Low
- Heat 3/10 Moderate 7 d/yr ≥101°F today · 15 d/yr by 30 yrs out
- Wind 2/10 Low
- Air quality 4/10 Moderate 4 unhealthy d/yr today · 5 by 30 yrs out
Nearby sold comps map
Loading sold comps map…
Walkable amenities ~0.75 mi
Loading nearby amenities…
Taxation est. · year 1
- Rental income
- $30,061
- − Mortgage interest
- −$7,590
- − Property taxes
- −$2,032
- − Insurance
- −$678
- − Repairs & maintenance
- −$2,405
- − Management
- −$2,405
- − Depreciation
- −$3,942
- Taxable income
- $11,009
- Est. tax owed @ 24.0%
- −$2,642
- After-tax cash flow
- $9,869/yr
For passive investors: Depreciation is non-cash, so a rental often shows a tax loss while cash-flowing — sheltering income. Rental losses are passive: they offset passive income freely, and up to $25,000/yr can offset ordinary (W-2) income if you actively participate and your MAGI is under $100k (phasing out to $0 by $150k); unused losses carry forward. On sale, claimed depreciation is recaptured at up to 25%, and gains may owe capital-gains tax (a 1031 exchange can defer both). Figures are a year-1 estimate at your 24.0% rate — not tax advice; consult a CPA.
Schools (NCES district)
- District
- Thornton Twp Hsd 205
- NCES district ID
- 1738970
- Math proficiency
- 7% ▬ 0.00%
- Reading proficiency
- 8% ▼ -2.00%
- Median HH income
- $43,392
- Composite
- 6.92/100
- National rank
- #9976
- State rank
- #594 of 620 in IL
Livability — Dolton
- Score
- 74/100
- State rank
- #263
- US rank
- #4883
Category grades
Schools grade is shown separately in the Schools card above.
Census & demographics
- Census place
- Dolton, IL
- County
- Cook County · 4,486,803 people
- City population
- 20,825
- Metro
- Chicago-Naperville-Elgin, IL-IN-WI
- Population (ZIP)
- 20,825
- Household income
- $57,887
- Rent vs Own
- Severe rent burden
- 919.0
Population outlook (Cook County) Hauer SSP2
- Today (2025)
- 5,347,519 people
- By 2030
- 5,357,703 · +0.2%
- By 2040
- 5,324,924 · -0.4%
- By 2050
- 5,230,762 · -2.2%
- By 2075
- 4,785,735 · -10.5%
- By 2100
- 4,188,836 · -21.7%
Race, ethnicity, and origin ACS 2023
- Neighborhood character
- Predominantly Black (91%)
- Race & ethnicity
- Black 91% White 4% Two or more races 3% Hispanic / Latino 1%
- Common ancestry
- Romanian 1% Hispanic 1%
- Foreign-born
- 3% · Canada
- Languages at home
- 95% English-only · French/Haitian/Cajun 2% Spanish 1%
Political lean MEDSL · Cook
- 2024 margin
- Solid D (+42.0) · D 70.4% · R 28.4% · Other 1.2%
- 2008→2024 swing
- -11.4pp toward R · 2008: 53.4pp · 2024: 42.0pp
- All cycles
- 2024: D+42.0 2020: D+50.3 2016: D+53.0 2012: D+49.4 2008: D+53.4
Not yet ingested
- Civics
- —
Market trends
- HPI YoY
- ▼ -66.88%
- Current HPI
- 193.2346
- Rent YoY
- ▲ 9.65%
- Metro
- Chicago-Naperville-Elgin, IL-IN-WI
- State GDP YoY
- ▲ 1.59%
- F500 in state
- 60
Industry mix (Fortune 500 HQ in IL)
| Industry | F500 HQs | Revenue |
|---|---|---|
| Insurance | 4 | $201B |
|
||
| Consumer Goods | 4 | $87B |
|
||
| Industrial Machinery | 3 | $64B |
|
||
| Healthcare | 2 | $55B |
|
||
| Retail / Pharmacy | 1 | $148B |
|
||
| Agriculture / Food | 1 | $86B |
|
||
Price history
+126.9% since first listed35 events — show timeline
- 2026-05-20 Listed $147,500 MRED as Distributed by MLS Grid
- 2026-05-20 Listing Removed — MRED as Distributed by MLS Grid
- 2025-12-22 Relisted — MRED as Distributed by MLS Grid
- 2025-08-20 Listing Removed — MRED as Distributed by MLS Grid
- 2025-08-20 Relisted — MRED as Distributed by MLS Grid
- 2025-07-22 Listing Removed — MRED as Distributed by MLS Grid
- 2025-07-22 Relisted — MRED as Distributed by MLS Grid
- 2025-07-21 Listing Removed — MRED as Distributed by MLS Grid
- 2025-07-21 Relisted — MRED as Distributed by MLS Grid
- 2025-06-20 Listing Removed — MRED as Distributed by MLS Grid
- 2025-06-20 Relisted — MRED as Distributed by MLS Grid
- 2025-06-10 Listing Removed — MRED as Distributed by MLS Grid
- 2025-03-04 Price Changed — MRED as Distributed by MLS Grid
- 2025-02-04 Relisted — MRED as Distributed by MLS Grid
- 2025-02-01 Listing Removed — MRED as Distributed by MLS Grid
- 2024-12-02 Price Changed — MRED as Distributed by MLS Grid
- 2024-11-22 Price Changed — MRED as Distributed by MLS Grid
- 2024-11-01 Listed — MRED as Distributed by MLS Grid
- 2023-05-09 Contingent — MRED as Distributed by MLS Grid
- 2023-05-08 Listing Removed — MRED as Distributed by MLS Grid
- 2023-05-02 Listing Removed — MRED as Distributed by MLS Grid
- 2023-05-02 Listed — MRED as Distributed by MLS Grid
- 2023-04-05 Listing Removed — MRED as Distributed by MLS Grid
- 2023-04-05 Listed — MRED as Distributed by MLS Grid
- 2023-03-15 Listing Removed — MRED as Distributed by MLS Grid
- 2023-03-15 Listed — MRED as Distributed by MLS Grid
- 2022-12-21 Listing Removed — MRED as Distributed by MLS Grid
- 2022-12-21 Listed — MRED as Distributed by MLS Grid
- 2022-10-17 Listed — MRED as Distributed by MLS Grid
- 2022-06-09 Sold (MLS) $109,700 MRED as Distributed by MLS Grid
- 2022-04-27 Contingent — MRED as Distributed by MLS Grid
- 2022-04-14 Relisted — MRED as Distributed by MLS Grid
- 2022-04-08 Contingent — MRED as Distributed by MLS Grid
- 2022-02-24 Listed $99,900 MRED as Distributed by MLS Grid
- 1987-07-01 Sold (Public Records) $65,000 Public Records
Property tax history
+5.4%/yrLatest (2023): $8,463 · +20.9% YoY. Source: county tax records.
Cash-flow waterfall
monthlySold comps — $/sqft
last 12 mo · ≤1 miLoading sold comps…