 Triplex
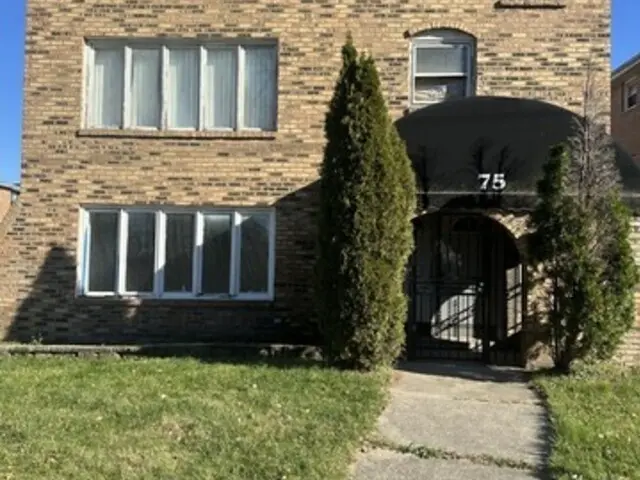
75 Paxton Ave · Calumet City, IL
Flood risk 4/10 · Minor
- FEMA flood zone
- X (unshaded)
- Chance of flooding over 30 yrs
- 0.23%
- Est. flood insurance / yr
- $473 – $860
Fire risk 1/10 · Minimal
- Est. fire insurance / yr
- $804 – $1,492
Heat risk 3/10 · Minor
- Hot days now (above 101°F)
- 7 days/yr
- Hot days in 30 yrs
- 15 days/yr
Wind risk 2/10 · Minimal
- Chance of severe wind over 30 yrs
- —
Air-quality risk 4/10 · Minor
- Unhealthy air days now
- 4 days/yr
- Unhealthy air days in 30 yrs
- 5 days/yr
Risk factors via First Street. Map © Google.
Why this score? — see what drove the B- grade
The composite is a weighted blend of 9 inputs, each scored 0–100. Each bar is that input's sub-score; the figure is the points it added to the 100-point composite (weight × sub-score).
- Cash flow +30.0/30.0
- 1% rule +10.0/10.0
- DSCR +10.0/10.0
- ARV discount +7.5/15.0
- Rent growth +4.0/5.0
- Livability +3.6/5.0
- Condition / age +2.5/5.0
- Schools +0.7/10.0
- Appreciation +0.0/10.0
$241,000
🖨 Deal sheet (PDF) 📄 Offer letter ✓ Due diligence
Multi-family units
County records classify this as Multi-Family (5+ Unit). Listing-text estimate: 3 units. estimate disagrees with records
5+ unit building — per-unit beds/baths from public records are typically unavailable; the breakdown below (if shown) is an estimate from the listing text.
Listing remarks
THIS PROPERTY AWAITS THE INVESTOR OR MULTI FAMILY BUYER. THE AFTER REPAIR VALUE IS About 400K! A PERFECT PROPERTY FOR EXTRA INCOME OR PERSONAL RESIDENCE. COME AND SEE! YOU WILL NOT REGRET IT. .. This Property is being SOLD AS IS!!!
Key facts
- 6,200 sq ft lot
- 2 garage spots
- Built 1979
Property features AI
Finance
- Other: Four-unit building total; Not rebuilt or rehabbed according to listing data
- Financial info: Special service area: No
Exterior
- Parking: Attached garage with 2 garage spaces (2 total parking spaces)
- Utilities: Water source: Lake Michigan; Public sewer
- Home design: Two-to-four-unit residential building; Fee simple ownership; Approximately 41–50 years old; Brick construction
- Construction: Brick exterior
- Exterior features: Lot dimensions approximately 62 x 100; Lot size less than 0.25 acre; Near commuter transit options (commuter bus and train) and interstate access; School bus service available
Interior
- Bedrooms: Eight bedrooms total across the building; Unit breakdown: two 3-bedroom units (1st and 2nd floors), two 1-bedroom units (3rd floor)
- Bathrooms: Four full bathrooms and two half bathrooms in the building; Each 3-bedroom unit has one full bath and one half bath; Each 1-bedroom unit has one full bath
- Heating & cooling: Natural gas heating
- Interior features: 18 total rooms; Contains 3-bedroom units in the building
- Laundry & utility: Tenants pay electric, gas, and heat for each unit
Neighborhood map
What this means for you Summary
Snapshot
- This is a 3 × 2-bed/?-bath units multifamily listed at $241k.
Deal economics
- At list price, monthly cash flow is $3k ($35k/yr) — positive. Per door: $963/mo.
- The deal already cash-flows at list — no discount required.
- Meets the 1% rule at list price ($6k rent vs $241k).
- Recommended offer: $227k (6.0% below list) — sets the bar for market timing.
- Cap rate 20.7% vs local median 8.3% in Calumet City — top-decile yield for the area; either an underpriced asset or a hidden risk that comps aren't pricing in. Stress-test before assuming the spread holds.
Location & tenants
- Location reads 71/100 on livability (#330 in IL) — a middle-class / working-renter tenant base. Strengths: commute A+, cost of living A+, housing A+; Watch: employment C-, crime D-, amenities F.
- Thornton Twp Hsd 205 (suburban): math 7% / reading 8% proficiency, ranked #594 of 620 in IL (top 96%) — low school quality limits family demand, transient renter base, plan for 1-2y turnover.
- Zoned schools: Caroline Sibley Elem School (math 0% / reading 5%, grade F, #1,923 of 2,056 statewide, top 94%, 518 students, 0% FRL); Creative Communications Acad (math 2% / reading 2%, grade F, #660 of 665 statewide, top 100%, 177 students, 0% FRL); Thornridge High School (math 8% / reading 8%, grade F, #589 of 693 statewide, top 86%, 1,057 students, 0% FRL).
- Market conditions: Rents rising fast (+6.2%/yr); 196 active listings in the ZIP; 6,272 units permitted in Cook County in 2024 (4,658 in 5+ unit buildings).
- At $5,766/mo this rent would consume 125% of the median local household income ($55k/yr) (locally 2415% of renters already pay >50% of income on rent) — very limited rent-growth headroom before tenants either downsize or default.
Forward outlook
- Local home prices are declining (-3.0%/yr); year-one equity from $2k of loan paydown is wiped out by about $7k of value loss. Plan a longer hold.
- At projected returns (-3.0% appreciation + 6.2% rent growth), your $67k cash investment doubles in ~3 years — after that, you're playing with house money.
Negotiation context
- It's been on market 73 days — a 6% lower offer ($227k) is reasonable based on typical stale-listing flexibility.
- 4 sale attempts since 5y ago with the ask held roughly flat each time — persistent listings suggest the price (not the market) is what's stuck; bring a comps-based counter.
- Current owner paid $129k; list at $241k implies a 87% gain — meaningful room to come down on a strong offer.
Questions for the listing agent
- It's been on market 73 days. Have you received any prior offers? Is the seller open to a 6% concession, seller financing, or rate buy-down credit?
- Can we see the unit-by-unit rent roll, current vacancy, and any below-market leases? What's the average tenancy length?
- What capital expenditures (roof, boiler, parking lot, exteriors) have been made in the last 5 years, and what's planned in the next 2?
- Built in 1979 — when were the roof, HVAC, electrical panel, plumbing, and water heater last replaced?
- Why hasn't it sold? Are there any deal-killer items the seller is aware of (foundation, flood, title, zoning, code violations)?
- Is there a deadline driving the sale (1031 exchange, divorce, estate, relocation)? That informs how much negotiation room exists.
- Schools are F-rated, which usually means shorter tenancies and higher turnover. Who's the typical renter profile here, and what's been the actual vacancy rate?
- Crime grade is D in this area — have there been break-ins, vandalism, or insurance claims at this property in the last 3 years? What carrier currently insures it and at what premium?
- What's the average days-on-market for RENTAL listings here right now (not sales)? A rising rental-DOM trend means longer vacancies and softer asking-rent achievability than the comps imply.
- What's the recent tenant-quality profile in this submarket — average credit score on applications, eviction rate, late-payment / NSF rate, and stable-employment percentage? A property-management company in the area should have these aggregated.
- How much new apartment / multifamily construction is in the pipeline within 1–3 miles? Heavy new supply (>2% of stock underway) typically softens rents 12–24 months out; light construction supports rent growth.
Investment metrics
- 1% rule
- 2.39% ✓
- Cap rate
- 20.68%
- Cash-on-cash
- 51.39%
- DSCR
- 3.29
- GRM
- 3.5
CMA / ARV
No comps found within radius.
Projected returns pro-forma
-3.0% appreciation · 6.17% rent growth · sell at horizon
- IRR
- 52.8%
- Equity multiple
- 3.43×
- Total profit
- $164,052
- Equity at exit
- $35,934
- IRR
- 59.3%
- Equity multiple
- 7.87×
- Total profit
- $463,297
- Equity at exit
- $20,837
Cash invested: $67,480 (down + closing). Projections, not guarantees.
Landlord ↔ Tenant lean methodology
- Overall (STATE)
- 43 Moderately Tenant-Leaning
- State Illinois
- 43 Moderately Tenant-Leaning · D+7
- County
- — inherits STATE
- City
- — inherits STATE
ZIP-level market 60409
- Home prices YoY
- -27.6%
- Rents YoY
- 6.2%
- Active inventory
- 196
- Price-to-rent
- 10.4×
Monthly cashflow live
- Estimated rent
- $5,766 high interval (Pro) →
- Mortgage (P&I)
- −$1,264
- Tax est. 1.5%
- −$301 /mo · $3,615/yr
- Insurance
- −$100
- HOA
- −$0
- Vacancy / Maint / Mgmt
- −$1,211
- Net cashflow
- $2,890
Break-even live
Sensitivity live
| Price | -10% $3,056 | -5% $2,973 | +0% $2,890 | +5% $2,806 | +10% $2,723 |
|---|---|---|---|---|---|
| Rent | -10% $2,434 | -5% $2,662 | +0% $2,890 | +5% $3,117 | +10% $3,345 |
| Rate | -1.0pp $3,011 | -0.5pp $2,951 | base $2,890 | +0.5pp $2,827 | +1.0pp $2,764 |
3-unit breakdown (identical units grouped — click to expand)
| Units | Beds | Baths | Est. rent |
|---|---|---|---|
| 3× units | 2 | — | $5,766 |
| #1 | 2 | — | $1,922 |
| #2 | 2 | — | $1,922 |
| #3 | 2 | — | $1,922 |
| Total (3 units) | $5,766 | ||
UW: 25.0% down · 7.5% · 30yr · 1.5% tax · 5.0% vac · 8.0% maint · 8.0% mgmt
Financing live
Cash to close
- Down payment
- $60,250
- Closing costs
- $7,230
- Reserves months
- —
- Total cash needed
- —
Loan-product check · same deal, 3 products live
Conventional
25% down · 7.5% · 30yr
- Down + closing
- —
- Monthly P&I
- —
- Monthly cashflow
- —
- DSCR
- —
- Eligible?
- —
Personal DTI + credit; lowest rate.
DSCR
20% down · 8.5% · 30yr
- Down + closing
- —
- Monthly P&I
- —
- Monthly cashflow
- —
- DSCR
- —
- Eligible?
- —
No personal income docs; deal must DSCR.
Hard money
10% down · 12.0% · 12mo
- Down + closing
- —
- Monthly P&I
- —
- Monthly cashflow
- —
- DSCR
- —
- Eligible?
- —
Short-term bridge; refi at stabilization.
Listing history 25 events
-
2026-06-21days on market $241,000 Active 73 DOM
-
2026-06-18days on market $241,000 Active 70 DOM
-
2026-06-17days on market $241,000 Active 69 DOM
-
2026-06-16days on market $241,000 Active 68 DOM
-
2026-06-15days on market $241,000 Active 67 DOM
-
2026-06-13days on market $241,000 Active 65 DOM
-
2026-06-13days on market $241,000 Active 64 DOM
-
2026-06-09days on market $241,000 Active 61 DOM
-
2026-06-08days on market $241,000 Active 60 DOM
-
2026-06-07days on market $241,000 Active 59 DOM
-
2026-06-04days on market $241,000 Active 56 DOM
-
2026-06-03days on market $241,000 Active 55 DOM
-
2026-06-02days on market $241,000 Active 54 DOM
-
2026-06-01days on market $241,000 Active 53 DOM
-
2026-05-31days on market $241,000 Active 52 DOM
-
2026-04-09$241,000 Active
-
2024-12-05historical
-
2024-11-11Active
-
2024-11-11historical
-
2024-07-01Active
-
2024-04-15soldstatus $129,000
-
2021-10-01status Pending
-
2021-09-30historical
-
2021-08-11Active
-
1996-12-06soldstatus $199,000
ⓘ Source: listings_history table (triggers on properties + properties_extension) + one-shot
backfill from property_details.listing_events for pre-trigger history.
Climate risk First Street
- Flood 4/10 Moderate FEMA zone X (unshaded) · 23% chance over 30 yrs
- Wildfire 1/10 Low
- Heat 3/10 Moderate 7 d/yr ≥101°F today · 15 d/yr by 30 yrs out
- Wind 2/10 Low
- Air quality 4/10 Moderate 4 unhealthy d/yr today · 5 by 30 yrs out
Nearby sold comps map
Loading sold comps map…
Walkable amenities ~0.75 mi
Loading nearby amenities…
Taxation est. · year 1
- Rental income
- $69,192
- − Mortgage interest
- −$13,500
- − Property taxes
- −$3,615
- − Insurance
- −$1,205
- − Repairs & maintenance
- −$5,535
- − Management
- −$5,535
- − Depreciation
- −$7,011
- Taxable income
- $32,791
- Est. tax owed @ 24.0%
- −$7,870
- After-tax cash flow
- $26,806/yr
For passive investors: Depreciation is non-cash, so a rental often shows a tax loss while cash-flowing — sheltering income. Rental losses are passive: they offset passive income freely, and up to $25,000/yr can offset ordinary (W-2) income if you actively participate and your MAGI is under $100k (phasing out to $0 by $150k); unused losses carry forward. On sale, claimed depreciation is recaptured at up to 25%, and gains may owe capital-gains tax (a 1031 exchange can defer both). Figures are a year-1 estimate at your 24.0% rate — not tax advice; consult a CPA.
Schools (NCES district)
- District
- Thornton Twp Hsd 205
- NCES district ID
- 1738970
- Math proficiency
- 7% ▬ 0.00%
- Reading proficiency
- 8% ▼ -2.00%
- Median HH income
- $43,392
- Composite
- 6.92/100
- National rank
- #9976
- State rank
- #594 of 620 in IL
Livability — Calumet City
- Score
- 71/100
- State rank
- #330
- US rank
- #6552
Category grades
Schools grade is shown separately in the Schools card above.
Census & demographics
- Census place
- Calumet City, IL
- County
- Cook County · 4,486,803 people
- City population
- 35,100
- Metro
- Chicago-Naperville-Elgin, IL-IN-WI
- Population (ZIP)
- 35,100
- Household income
- $55,369
- Rent vs Own
- Severe rent burden
- 2415.0
Population outlook (Cook County) Hauer SSP2
- Today (2025)
- 5,347,519 people
- By 2030
- 5,357,703 · +0.2%
- By 2040
- 5,324,924 · -0.4%
- By 2050
- 5,230,762 · -2.2%
- By 2075
- 4,785,735 · -10.5%
- By 2100
- 4,188,836 · -21.7%
Race, ethnicity, and origin ACS 2023
- Neighborhood character
- Predominantly Black (74%)
- Race & ethnicity
- Black 74% Hispanic / Latino 15% White 7% Two or more races 4%
- Hispanic origin (detail)
- Mexican 14%
- Common ancestry
- Romanian 2%
- Foreign-born
- 9% · Canada
- Languages at home
- 83% English-only · Spanish 14%
Political lean MEDSL · Cook
- 2024 margin
- Solid D (+42.0) · D 70.4% · R 28.4% · Other 1.2%
- 2008→2024 swing
- -11.4pp toward R · 2008: 53.4pp · 2024: 42.0pp
- All cycles
- 2024: D+42.0 2020: D+50.3 2016: D+53.0 2012: D+49.4 2008: D+53.4
Not yet ingested
- Civics
- —
Market trends
- HPI YoY
- ▼ -75.01%
- Current HPI
- 197.2137
- Rent YoY
- ▲ 6.17%
- Metro
- Chicago-Naperville-Elgin, IL-IN-WI
- State GDP YoY
- ▲ 1.59%
- F500 in state
- 60
Industry mix (Fortune 500 HQ in IL)
| Industry | F500 HQs | Revenue |
|---|---|---|
| Insurance | 4 | $201B |
|
||
| Consumer Goods | 4 | $87B |
|
||
| Industrial Machinery | 3 | $64B |
|
||
| Healthcare | 2 | $55B |
|
||
| Retail / Pharmacy | 1 | $148B |
|
||
| Agriculture / Food | 1 | $86B |
|
||
Price history
+21.1% since first listed10 events — show timeline
- 2026-04-09 Listed $241,000 MRED as Distributed by MLS Grid
- 2024-12-05 Listing Removed — MRED as Distributed by MLS Grid
- 2024-11-11 Listing Removed — MRED as Distributed by MLS Grid
- 2024-11-11 Listed — MRED as Distributed by MLS Grid
- 2024-07-01 Listed — MRED as Distributed by MLS Grid
- 2024-04-15 Sold (Public Records) $129,000 Public Records
- 2021-10-01 Pending — MRED as Distributed by MLS Grid
- 2021-09-30 Listing Removed — MRED as Distributed by MLS Grid
- 2021-08-11 Listed — MRED as Distributed by MLS Grid
- 1996-12-06 Sold (Public Records) $199,000 Public Records
Property tax history
+2.6%/yrLatest (2023): $15,611 · +6.7% YoY. Source: county tax records.
Cash-flow waterfall
monthlySold comps — $/sqft
last 12 mo · ≤1 miLoading sold comps…