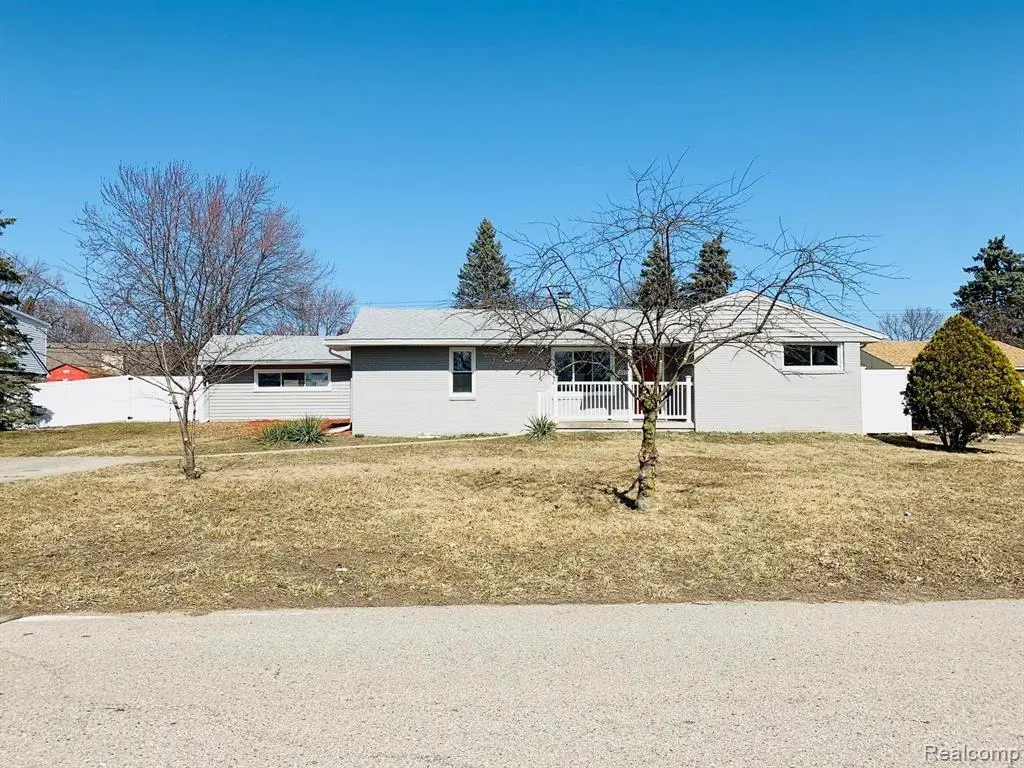
2075 Gulliver Dr · Troy, MI
Flood risk 1/10 · Minimal
- FEMA flood zone
- X (unshaded)
- Chance of flooding over 30 yrs
- 0.0%
- Est. flood insurance / yr
- $507 – $1,088
Fire risk 1/10 · Minimal
- Est. fire insurance / yr
- $784 – $1,456
Heat risk 3/10 · Minor
- Hot days now (above 97°F)
- 7 days/yr
- Hot days in 30 yrs
- 15 days/yr
Wind risk 2/10 · Minimal
- Chance of severe wind over 30 yrs
- —
Air-quality risk 3/10 · Minor
- Unhealthy air days now
- 3 days/yr
- Unhealthy air days in 30 yrs
- 4 days/yr
Risk factors via First Street. Map © Google.
Why this score? — see what drove the C grade
The composite is a weighted blend of 9 inputs, each scored 0–100. Each bar is that input's sub-score; the figure is the points it added to the 100-point composite (weight × sub-score).
- Cash flow +16.6/30.0
- ARV discount +14.5/15.0
- Schools +6.5/10.0
- DSCR +5.1/10.0
- 1% rule +4.0/10.0
- Livability +3.9/5.0
- Rent growth +2.5/5.0
- Condition / age +2.5/5.0
- Appreciation +0.0/10.0
$359,900
🖨 Deal sheet 📄 Offer letter ✓ Due diligence
Listing remarks
Beautiful move-in ready ranch in the desirable John Arbor subdivision of Troy. This home offers plenty of living space on an extra-LARGE lot with a big private fenced backyard—perfect for outdoor enjoyment. Located in Troy Schools, The Home is situated near multiple LAKES and a GOLF COURSE, close to major roads, shopping, and just 15 minutes from Somerset Mall. * Seller is offering a credit toward buyer’s closing costs or rate buy-down with an acceptable offer—an excellent opportunity to personalize this home while building equity. * Featuring 4 bedrooms and 2 full baths, according to seller this home includes: newer tile floors (2023), HVAC (2023), hot water tank (2023),
Key facts
- 0.31 acre lot
- Built 1956
- Listed 13 days
Neighborhood map
What this means for you Summary
Snapshot
- This is a 3-bed/2.0-bath single-family listed at $360k.
Deal economics
- At list price, monthly cash flow is $216 ($3k/yr) — positive.
- The deal already cash-flows at list — no discount required.
- To meet the 1% rule (rent ≥ 1% of price), the offer needs to be $326k (9.5% below list).
- Recommended offer: $326k (9.5% below list) — sets the bar for 1% rule.
- Cap rate 7.0% vs local median 3.6% in Troy — top-decile yield for the area; either an underpriced asset or a hidden risk that comps aren't pricing in. Stress-test before assuming the spread holds.
Location & tenants
- Location reads 78/100 on livability (#113 in MI, #2,684 nationally) — a middle-class / working-renter tenant base. Strengths: employment A+, housing A+, schools A; Watch: health & safety D+, amenities F, commute F.
- Troy School District (urban): math 68% / reading 75% proficiency, ranked #8 of 540 in MI (top 2%) — strong family-tenant draw, lease renewals of 3-5y typical; only 10% free/reduced lunch — higher-income household profile.
- Market conditions: 120 active listings in the ZIP; 5 comparable units currently listed for rent nearby; rentals at typical pace (median 22d on market — plan ~3-4 weeks tenant-placement turnaround); 40% of comp listings sitting > 30 days — soft ceiling on asking rent; high-income renter base; 2,614 units permitted in Oakland County in 2024 (721 in 5+ unit buildings).
Forward outlook
- Local home prices are declining (-3.0%/yr); year-one equity from $2k of loan paydown is wiped out by about $11k of value loss. Plan a longer hold.
- Oakland County population projected at +10% by 2050 — modest demand growth; plan on rents tracking national, not racing it.
Negotiation context
- Only 14 days on market — expect competitive offers; lowballing is unlikely to land.
- 10 sale attempts since 8y ago with the ask held roughly flat each time — persistent listings suggest the price (not the market) is what's stuck; bring a comps-based counter.
Risks & watch-outs
- Watch-outs: built in 1956 — expect roof / HVAC / electrical / plumbing capex.
Questions for the listing agent
- Built in 1956 — when were the roof, HVAC, electrical panel, plumbing, and water heater last replaced?
- Is there a deadline driving the sale (1031 exchange, divorce, estate, relocation)? That informs how much negotiation room exists.
- Schools are A-rated — typically a magnet for longer-tenancy family renters. What's the average tenant stay here, and is there a school-zone premium baked into asking?
- What's the average days-on-market for RENTAL listings here right now (not sales)? A rising rental-DOM trend means longer vacancies and softer asking-rent achievability than the comps imply.
- What's the recent tenant-quality profile in this submarket — average credit score on applications, eviction rate, late-payment / NSF rate, and stable-employment percentage? A property-management company in the area should have these aggregated.
- How much new for-sale + rental construction is in the pipeline within 1–3 miles? Heavy new supply typically softens prices + rents 12–24 months out; constrained supply supports both.
Investment metrics
- 1% rule
- 0.90% ✗
- Cap rate
- 7.01%
- Cash-on-cash
- 2.57%
- DSCR
- 1.11
- GRM
- 9.2
CMA / ARV
- ARV (median comp)
- $425,868
- List price
- $359,900
- Delta
- -13.14%
- Verdict
- UNDERPRICED
- Comps
- 20 within 1.0 mi
Show comp detail 12 sales within ~0.75 mi
| Address | Dist | Beds/Ba | Sqft | Sold | Price | $/sf | Match |
|---|---|---|---|---|---|---|---|
| 6425 Southpointe Dr | 0.29mi | 3/2.5 | 2,034 (+3%) | 4mo | $550,000 | $270 | 76 |
| 1106 E South Blvd | 0.36mi | 3/2.5 | 2,049 (+3%) | 12mo | $440,000 | $215 | 66 |
| 6747 Emerald Lake Dr | 0.43mi | 3/2.5 | 2,003 (+1%) | 20mo | $445,000 | $222 | 60 |
| 1120 Michelson Rd | 0.55mi | 3/2.0 | 1,882 (-5%) | 7mo | $325,000 | $173 | 60 |
| 6288 Crescent Way Dr | 0.49mi | 3/2.5 | 1,917 (-3%) | 14mo | $517,000 | $270 | 58 |
| 1966 Chancery Ave | 0.18mi | 4/2.5 (+1) | 2,132 (+8%) | 17mo | $450,000 | $211 | 57 |
| 6621 Northpoint Dr | 0.40mi | 3/2.0 | 1,767 (-11%) | 9mo | $538,000 | $304 | 56 |
| 6605 Emerald Lake Dr | 0.58mi | 3/2.0 | 1,786 (-10%) | 2mo | $482,500 | $270 | 54 |
| 6874 Little Creek Dr | 0.36mi | 3/2.5 | 1,694 (-14%) | 8mo | $338,000 | $200 | 50 |
| 3678 John R Rd | 0.70mi | 3/1.5 | 1,854 (-6%) | 12mo | $320,000 | $173 | 45 |
| 6472 Emerald Lake Dr | 0.56mi | 3/2.5 | 2,151 (+9%) | 17mo | $425,000 | $198 | 43 |
| 1462 Three Lakes Dr | 0.66mi | 4/2.0 (+1) | 1,697 (-14%) | 12mo | $390,000 | $230 | 30 |
Match score weights: distance 35% · size 25% · config 20% · recency 20%. Top-matched comps best support the ARV.
Projected returns pro-forma
-3.0% appreciation · 3.0% rent growth · sell at horizon
- IRR
- -12.3%
- Equity multiple
- 0.56×
- Total profit
- $-44,622
- Equity at exit
- $53,662
- IRR
- -3.2%
- Equity multiple
- 0.79×
- Total profit
- $-21,305
- Equity at exit
- $31,118
Cash invested: $100,772 (down + closing). Projections, not guarantees.
Landlord ↔ Tenant lean methodology
- Overall (STATE)
- 62 Landlord-Friendly
- State Michigan
- 62 Landlord-Friendly · EVEN
- County
- — inherits STATE
- City
- — inherits STATE
ZIP-level market 48085
- Active inventory
- 120
- Price-to-rent
- 9.2×
Monthly cashflow live
- Estimated rent
- $3,255 high interval (Pro) →
- Mortgage (P&I)
- −$1,887
- Tax from tax record
- −$319 /mo · $3,827/yr
- Insurance
- −$150
- HOA
- −$0
- Vacancy / Maint / Mgmt
- −$684
- Net cashflow
- $216
Break-even live
UW: 25.0% down · 7.5% · 30yr · 1.5% tax · 5.0% vac · 8.0% maint · 8.0% mgmt
Financing live
Cash to close
- Down payment
- $89,975
- Closing costs
- $10,797
- Reserves months
- —
- Total cash needed
- —
Loan-product check · same deal, 3 products live
Conventional
25% down · 7.5% · 30yr
- Down + closing
- —
- Monthly P&I
- —
- Monthly cashflow
- —
- DSCR
- —
- Eligible?
- —
Personal DTI + credit; lowest rate.
DSCR
20% down · 8.5% · 30yr
- Down + closing
- —
- Monthly P&I
- —
- Monthly cashflow
- —
- DSCR
- —
- Eligible?
- —
No personal income docs; deal must DSCR.
Hard money
10% down · 12.0% · 12mo
- Down + closing
- —
- Monthly P&I
- —
- Monthly cashflow
- —
- DSCR
- —
- Eligible?
- —
Short-term bridge; refi at stabilization.
Rent comps 5 comps
| Address | Beds | Baths | Sqft | Rent | $/sqft | DOM | Units | Dist |
|---|---|---|---|---|---|---|---|---|
| 5944 Willow Grv Troy, MI | 3.0 | 2.0 | 1850 | $4,250 | $2.30 | 43d | 1 | 0.97mi |
| 1128 Alameda Blvd Unit 1128 Troy, MI | 2.0 | 2.0 | 1457 | $2,150 | $1.48 | 21d | 1 | 0.99mi |
| 1901 Village Green Blvd Rochester Hills, MI | 3.0 | 1.0–2.0 | 1025 | $2,509 | $2.45 | 1d | 28 | 1.15mi |
| 6525 Norton Dr Troy, MI | 4.0 | 2.0 | 2047 | $2,800 | $1.37 | 43d | 1 | 1.48mi |
| 5363 English Dr Troy, MI | 4.0 | 2.5 | 2515 | $3,300 | $1.31 | 1d | 1 | 1.50mi |
Listing history 41 events
-
2026-06-18days on market $359,900 Active 14 DOM
-
2026-06-17days on market $359,900 Active 13 DOM
-
2026-06-16days on market $359,900 Active 12 DOM
-
2026-06-15days on market $359,900 Active 11 DOM
-
2026-06-13days on market $359,900 Active 9 DOM
-
2026-06-13days on market $359,900 Active 8 DOM
-
2026-06-09days on market $359,900 Active 5 DOM
-
2026-06-08days on market $359,900 Active 4 DOM
-
2026-06-07pricestatusdays on market $359,900 Active 3 DOM
-
2026-05-16historical
-
2026-05-16historical
-
2026-03-27price $369,900
-
2026-03-26price $369,900
-
2026-03-19$374,900 Active
-
2026-03-19$374,900 Active
-
2026-03-15historical
-
2025-11-20historical
-
2025-09-08$389,900 Active
-
2025-09-08$389,900 Active
-
2025-09-05historical
-
2025-07-16price $399,900
-
2025-07-15price $399,900
-
2025-07-04$410,000 Active
-
2025-07-04$410,000 Active
-
2025-07-01historical
-
2023-07-07soldstatus $350,000
-
2021-04-22soldstatus $275,000
-
2021-04-20soldstatus $275,000 Sold
-
2021-04-20soldstatus $275,000 Closed
-
2021-04-10status Pending
-
2021-04-10status Pending
-
2021-04-07price $289,900
-
2021-04-06price $289,900
-
2021-03-20$299,900 Active
-
2021-03-20$299,900 Active
-
2018-04-09soldstatus $170,000 Sold
-
2018-04-09soldstatus $170,000 Closed
-
2018-03-26status Pending
-
2018-03-26status Pending
-
2018-03-20$169,900 Active
-
2018-03-20$169,900 Active
ⓘ Source: listings_history table (triggers on properties + properties_extension) + one-shot
backfill from property_details.listing_events for pre-trigger history.
Tax reassessment forecast MI · Partial reset (capped growth)
- Current annual tax
- $3,827 · $319/mo
- Projected year-2 tax
- $4,685 · $390/mo
- Expected delta
- +$858/yr (+$71/mo · 22.4%)
ⓘ Screening estimate from a state-policy table — verify with the county assessor before closing.
Climate risk First Street
- Flood 1/10 Low FEMA zone X (unshaded) · 0% chance over 30 yrs
- Wildfire 1/10 Low
- Heat 3/10 Moderate 7 d/yr ≥97°F today · 15 d/yr by 30 yrs out
- Wind 2/10 Low
- Air quality 3/10 Moderate 3 unhealthy d/yr today · 4 by 30 yrs out
Nearby sold comps map
Loading sold comps map…
Walkable amenities ~0.75 mi
Loading nearby amenities…
Taxation est. · year 1
- Rental income
- $39,065
- − Mortgage interest
- −$20,160
- − Property taxes
- −$3,827
- − Insurance
- −$1,800
- − Repairs & maintenance
- −$3,125
- − Management
- −$3,125
- − Depreciation
- −$10,470
- Taxable loss
- −$3,442
- Est. tax savings @ 24.0%
- +$826
- After-tax cash flow
- $3,413/yr
For passive investors: Depreciation is non-cash, so a rental often shows a tax loss while cash-flowing — sheltering income. Rental losses are passive: they offset passive income freely, and up to $25,000/yr can offset ordinary (W-2) income if you actively participate and your MAGI is under $100k (phasing out to $0 by $150k); unused losses carry forward. On sale, claimed depreciation is recaptured at up to 25%, and gains may owe capital-gains tax (a 1031 exchange can defer both). Figures are a year-1 estimate at your 24.0% rate — not tax advice; consult a CPA.
Schools (NCES district)
- District
- Troy School District
- NCES district ID
- 2634260
- Math proficiency
- 68% ▼ -3.00%
- Reading proficiency
- 75% ▼ -2.00%
- Median HH income
- $90,920
- Composite
- 64.5/100
- National rank
- #539
- State rank
- #8 of 540 in MI
Livability — Troy
- Score
- 78/100
- State rank
- #113
- US rank
- #2684
Category grades
Schools grade is shown separately in the Schools card above.
Census & demographics
- Census place
- Troy, MI
- County
- Oakland County · 1,009,092 people
- City population
- 87,898
- Metro
- Detroit-Warren-Dearborn, MI
- Population (ZIP)
- 27,231
- Household income
- $146,390
- Rent vs Own
- Severe rent burden
- 39.0
Population outlook (Oakland County) Hauer SSP2
- Today (2025)
- 1,335,747 people
- By 2030
- 1,375,100 · +2.9%
- By 2040
- 1,435,385 · +7.5%
- By 2050
- 1,469,250 · +10.0%
- By 2075
- 1,531,946 · +14.7%
- By 2100
- 1,450,485 · +8.6%
Race, ethnicity, and origin ACS 2023
- Neighborhood character
- Predominantly White (68%)
- Race & ethnicity
- White 68% Asian 21% Two or more races 5% Black 4% Hispanic / Latino 2%
- Common ancestry
- Romanian 11% Italian 3% Slovak 2%
- Foreign-born
- 26% · Canada, China, South Korea
- Languages at home
- 72% English-only · Other Indo-European 9% Chinese 4% Other Asian/Pacific 4%
Political lean MEDSL · Oakland
- 2024 margin
- D (+10.6) · D 54.4% · R 43.8% · Other 1.9%
- 2008→2024 swing
- -3.9pp toward R · 2008: 14.5pp · 2024: 10.6pp
- All cycles
- 2024: D+10.6 2020: D+14.1 2016: D+8.1 2012: D+8.1 2008: D+14.5
Not yet ingested
- Civics
- —
Market trends
- HPI YoY
- ▼ -326.83%
- Current HPI
- 184.4445
- Rent YoY
- —
- Metro
- Detroit-Warren-Dearborn, MI
- State GDP YoY
- ▲ 1.37%
- F500 in state
- 28
Industry mix (Fortune 500 HQ in MI)
| Industry | F500 HQs | Revenue |
|---|---|---|
| Automotive Parts | 3 | $48B |
|
||
| Automotive | 2 | $372B |
|
||
| Chemicals | 1 | $45B |
|
||
| Automotive Retail | 1 | $29B |
|
||
| Healthcare / Medical Devices | 1 | $23B |
|
||
| Automotive Technology | 1 | $20B |
|
||
Price history
+117.7% since first listed32 events — show timeline
- 2026-05-16 Listing Removed — REALCOMP
- 2026-05-16 Listing Removed — MiRealSource-MiMLS
- 2026-03-27 Price Changed $369,900 MiRealSource-MiMLS
- 2026-03-26 Price Changed $369,900 REALCOMP
- 2026-03-19 Listed $374,900 REALCOMP
- 2026-03-19 Listed $374,900 MiRealSource-MiMLS
- 2026-03-15 Coming Soon — MiRealSource-MiMLS
- 2025-11-20 Listing Removed — MiRealSource-MiMLS
- 2025-09-08 Listed $389,900 REALCOMP
- 2025-09-08 Listed $389,900 MiRealSource-MiMLS
- 2025-09-05 Listing Removed — MiRealSource-MiMLS
- 2025-07-16 Price Changed $399,900 MiRealSource-MiMLS
- 2025-07-15 Price Changed $399,900 REALCOMP
- 2025-07-04 Listed $410,000 MiRealSource-MiMLS
- 2025-07-04 Listed $410,000 REALCOMP
- 2025-07-01 Coming Soon — MiRealSource-MiMLS
- 2023-07-07 Sold (Public Records) $350,000 Public Records
- 2021-04-22 Sold (Public Records) $275,000 Public Records
- 2021-04-20 Sold (MLS) $275,000 MiRealSource-MiMLS
- 2021-04-20 Sold (MLS) $275,000 REALCOMP
- 2021-04-10 Pending — MiRealSource-MiMLS
- 2021-04-10 Pending — REALCOMP
- 2021-04-07 Price Changed $289,900 MiRealSource-MiMLS
- 2021-04-06 Price Changed $289,900 REALCOMP
- 2021-03-20 Listed $299,900 MiRealSource-MiMLS
- 2021-03-20 Listed $299,900 REALCOMP
- 2018-04-09 Sold (MLS) $170,000 MiRealSource-MiMLS
- 2018-04-09 Sold (MLS) $170,000 REALCOMP
- 2018-03-26 Pending — MiRealSource-MiMLS
- 2018-03-26 Pending — REALCOMP
- 2018-03-20 Listed $169,900 MiRealSource-MiMLS
- 2018-03-20 Listed $169,900 REALCOMP
Property tax history
+5.3%/yrLatest (2025): $3,827 · -17.3% YoY. Source: county tax records.
Cash-flow waterfall
monthlySold comps — $/sqft
last 12 mo · ≤1 miLoading sold comps…