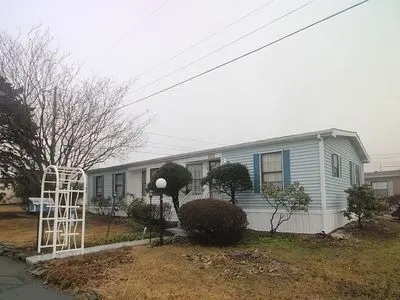
301 3rd St · South Heidelberg, PA
Flood risk No data
- FEMA flood zone
- —
- Chance of flooding over 30 yrs
- —
- Est. flood insurance / yr
- —
Fire risk No data
- Est. fire insurance / yr
- —
Heat risk No data
- Hot days now (above threshold)
- —
- Hot days in 30 yrs
- —
Wind risk No data
- Chance of severe wind over 30 yrs
- —
Air-quality risk No data
- Unhealthy air days now
- —
- Unhealthy air days in 30 yrs
- —
Risk factors via First Street. Map © Google.
Why this score? — see what drove the B- grade
The composite is a weighted blend of 9 inputs, each scored 0–100. Each bar is that input's sub-score; the figure is the points it added to the 100-point composite (weight × sub-score).
- Cash flow +30.0/30.0
- 1% rule +10.0/10.0
- DSCR +10.0/10.0
- ARV discount +7.5/15.0
- Schools +3.2/10.0
- Rent growth +2.5/5.0
- Livability +2.5/5.0
- Condition / age +2.5/5.0
- Appreciation +0.0/10.0
$69,999
🖨 Deal sheet 📄 Offer letter ✓ Due diligence
Listing remarks
SPACIOUS OPEN FLOOR PLAN ON CORNER LOT in age-restricted land/lease retirement community! Lap/Shingle. Cement Patio & amp; Patio Cover. 3 BRs. 2 Baths. Spacious L/R. Galley Kitchen/Dining Area with appliances. Master BR/Bath Suite. Laundry Room with W/ D hook-ups. C/A. LP Gas Heat. Off-St. macadam parking. Will not find nicer home, Community, or location for $69,999. Move-in condition. Mtgs. available. Sorry, NO dogs.
Key facts
- Open floor plan
- Galley kitchen
- Laundry room
Tags
Neighborhood map
What this means for you Summary
Snapshot
- This is a 3-bed/2.0-bath single-family listed at $70k.
Deal economics
- At list price, monthly cash flow is $890 ($11k/yr) — positive.
- The deal already cash-flows at list — no discount required.
- Meets the 1% rule at list price ($2k rent vs $70k).
- Recommended offer: $68k (3.0% below list) — sets the bar for market timing.
Location & tenants
- Location reads: area grade B — affects rentability + tenant quality, not the cash-flow math above.
- Conrad Weiser Area SD (suburban): math 27% / reading 43% proficiency, ranked #391 of 539 in PA (top 72%) — families likely to look elsewhere, expect single-tenant / working-renter base with shorter leases.
- Market conditions: 39 active listings in the ZIP; 1 comparable units currently listed for rent nearby; 258 units permitted in Berks County in 2024 (27 in 5+ unit buildings).
Forward outlook
- Local home prices are declining (-3.0%/yr); year-one equity from $484 of loan paydown is wiped out by about $2k of value loss. Plan a longer hold.
- Berks County population projected at +3% by 2050 — modest demand growth; plan on rents tracking national, not racing it.
- At projected returns (-3.0% appreciation + 3.0% rent growth), your $20k cash investment doubles in ~3 years — after that, you're playing with house money.
Negotiation context
- It's been on market 37 days — a 3% lower offer ($68k) is reasonable based on typical stale-listing flexibility.
Risks & watch-outs
- Watch-outs: property tax is 3.0% of price.
Questions for the listing agent
- It's been on market 37 days. Have you received any prior offers? Is the seller open to a 3% concession, seller financing, or rate buy-down credit?
- Property tax is high relative to price — has the assessment been appealed recently, and will the sale trigger a re-assessment?
- Is there a deadline driving the sale (1031 exchange, divorce, estate, relocation)? That informs how much negotiation room exists.
- What's the average days-on-market for RENTAL listings here right now (not sales)? A rising rental-DOM trend means longer vacancies and softer asking-rent achievability than the comps imply.
- What's the recent tenant-quality profile in this submarket — average credit score on applications, eviction rate, late-payment / NSF rate, and stable-employment percentage? A property-management company in the area should have these aggregated.
- How much new for-sale + rental construction is in the pipeline within 1–3 miles? Heavy new supply typically softens prices + rents 12–24 months out; constrained supply supports both.
Investment metrics
- 1% rule
- 2.64% ✓
- Cap rate
- 21.54%
- Cash-on-cash
- 54.46%
- DSCR
- 3.42
- GRM
- 3.2
CMA / ARV
- ARV (on-the-fly)
- $273,312
- Comps found
- 8
Show comp detail 8 sales within ~0.75 mi
| Address | Dist | Beds/Ba | Sqft | Sold | Price | $/sf | Match |
|---|---|---|---|---|---|---|---|
| 41 Grandview Ave | 0.14mi | 3/2.0 | 1,300 (+4%) | 8mo | $265,000 | $204 | 80 |
| 22 W Glen Tilt Ave | 0.34mi | 3/2.0 | 1,154 (-8%) | 6mo | $280,000 | $243 | 66 |
| 48 Wenrich Ave | 0.27mi | 3/1.5 | 1,425 (+14%) | 16mo | $275,000 | $193 | 48 |
| 231 Beckley St | 0.47mi | 2/1.5 (-1) | 1,421 (+14%) | 1mo | $247,000 | $174 | 47 |
| 325 Hill Rd | 0.36mi | 4/1.0 (+1) | 1,120 (-10%) | 15mo | $295,000 | $263 | 45 |
| 24 Lincoln Dr | 0.50mi | 2/1.0 (-1) | 1,098 (-12%) | 11mo | $241,000 | $219 | 38 |
| 415 Franklin St | 0.62mi | 3/1.5 | 1,391 (+12%) | 17mo | $320,000 | $230 | 36 |
| 86 S Reber St | 0.64mi | 3/1.0 | 1,356 (+9%) | 21mo | $216,000 | $159 | 34 |
Match score weights: distance 35% · size 25% · config 20% · recency 20%. Top-matched comps best support the ARV.
Projected returns pro-forma
-3.0% appreciation · 3.0% rent growth · sell at horizon
- IRR
- 52.7%
- Equity multiple
- 3.32×
- Total profit
- $45,397
- Equity at exit
- $10,437
- IRR
- 58.0%
- Equity multiple
- 6.76×
- Total profit
- $112,820
- Equity at exit
- $6,052
Cash invested: $19,600 (down + closing). Projections, not guarantees.
Landlord ↔ Tenant lean methodology
- Overall (STATE)
- 62 Landlord-Friendly
- State Pennsylvania
- 62 Landlord-Friendly · EVEN
- County
- — inherits STATE
- City
- — inherits STATE
ZIP-level market 19565
- Home prices YoY
- -21.4%
- Active inventory
- 39
- Price-to-rent
- 3.2×
Monthly cashflow live
- Estimated rent
- $1,850 medium interval (Pro) →
- Mortgage (P&I)
- −$367
- Tax from tax record
- −$176 /mo · $2,108/yr
- Insurance
- −$29
- HOA
- −$0
- Vacancy / Maint / Mgmt
- −$388
- Net cashflow
- $890
Break-even live
UW: 25.0% down · 7.5% · 30yr · 1.5% tax · 5.0% vac · 8.0% maint · 8.0% mgmt
Financing live
Cash to close
- Down payment
- $17,500
- Closing costs
- $2,100
- Reserves months
- —
- Total cash needed
- —
Loan-product check · same deal, 3 products live
Conventional
25% down · 7.5% · 30yr
- Down + closing
- —
- Monthly P&I
- —
- Monthly cashflow
- —
- DSCR
- —
- Eligible?
- —
Personal DTI + credit; lowest rate.
DSCR
20% down · 8.5% · 30yr
- Down + closing
- —
- Monthly P&I
- —
- Monthly cashflow
- —
- DSCR
- —
- Eligible?
- —
No personal income docs; deal must DSCR.
Hard money
10% down · 12.0% · 12mo
- Down + closing
- —
- Monthly P&I
- —
- Monthly cashflow
- —
- DSCR
- —
- Eligible?
- —
Short-term bridge; refi at stabilization.
Rent comps 1 comps
| Address | Beds | Baths | Sqft | Rent | $/sqft | DOM | Units | Dist |
|---|---|---|---|---|---|---|---|---|
| 44 W Penn Ave Wernersville, PA | 4.0 | 2.0 | 1500 | $1,850 | $1.23 | 13d | 1 | 0.64mi |
Listing history 16 events
-
2026-06-18days on market $69,999 Active 37 DOM
-
2026-06-17days on market $69,999 Active 36 DOM
-
2026-06-16days on market $69,999 Active 35 DOM
-
2026-06-15days on market $69,999 Active 34 DOM
-
2026-06-14days on market $69,999 Active 32 DOM
-
2026-06-13days on market $69,999 Active 31 DOM
-
2026-06-10days on market $69,999 Active 29 DOM
-
2026-06-09days on market $69,999 Active 28 DOM
-
2026-06-08days on market $69,999 Active 27 DOM
-
2026-06-07days on market $69,999 Active 26 DOM
-
2026-06-05days on market $69,999 Active 23 DOM
-
2026-06-02days on market $69,999 Active 21 DOM
-
2026-06-01days on market $69,999 Active 20 DOM
-
2026-05-31days on market $69,999 Active 19 DOM
-
2026-05-30days on market $69,999 Active 18 DOM
-
2026-05-12$69,999 Active 422-char remark
ⓘ Source: listings_history table (triggers on properties + properties_extension) + one-shot
backfill from property_details.listing_events for pre-trigger history.
Tax reassessment forecast PA · Partial reset (capped growth)
- Current annual tax
- $2,108 · $176/mo
- Projected year-2 tax
- $2,108 · $176/mo
- Expected delta
- $0/yr ($0/mo · 0.0%)
ⓘ Screening estimate from a state-policy table — verify with the county assessor before closing.
Nearby sold comps map
Loading sold comps map…
Walkable amenities ~0.75 mi
Loading nearby amenities…
Taxation est. · year 1
- Rental income
- $22,200
- − Mortgage interest
- −$3,921
- − Property taxes
- −$2,108
- − Insurance
- −$350
- − Repairs & maintenance
- −$1,776
- − Management
- −$1,776
- − Depreciation
- −$2,036
- Taxable income
- $10,233
- Est. tax owed @ 24.0%
- −$2,456
- After-tax cash flow
- $8,219/yr
For passive investors: Depreciation is non-cash, so a rental often shows a tax loss while cash-flowing — sheltering income. Rental losses are passive: they offset passive income freely, and up to $25,000/yr can offset ordinary (W-2) income if you actively participate and your MAGI is under $100k (phasing out to $0 by $150k); unused losses carry forward. On sale, claimed depreciation is recaptured at up to 25%, and gains may owe capital-gains tax (a 1031 exchange can defer both). Figures are a year-1 estimate at your 24.0% rate — not tax advice; consult a CPA.
Schools (NCES district)
- District
- Conrad Weiser Area SD
- NCES district ID
- 4206780
- Math proficiency
- 27% ▼ -14.00%
- Reading proficiency
- 43% ▼ -14.00%
- Median HH income
- $63,004
- Composite
- 31.53/100
- National rank
- #5962
- State rank
- #391 of 539 in PA
Livability — South Heidelberg
No livability data for this city. (Only ~50 U.S. cities are tracked.)
Census & demographics
- Population (ZIP)
- 8,744
Population outlook (Berks County) Hauer SSP2
- Today (2025)
- 425,767 people
- By 2030
- 428,814 · +0.7%
- By 2040
- 433,463 · +1.8%
- By 2050
- 439,426 · +3.2%
- By 2075
- 478,647 · +12.4%
- By 2100
- 518,507 · +21.8%
Race, ethnicity, and origin ACS 2023
- Neighborhood character
- Predominantly White (85%)
- Race & ethnicity
- White 85% Two or more races 6% Hispanic / Latino 6% Black 5%
- Hispanic origin (detail)
- Puerto Rican 4%
- Common ancestry
- Romanian 6% German 3% Italian 2%
- Foreign-born
- 2% · Canada
- Languages at home
- 96% English-only · Spanish 2% French/Haitian/Cajun 1% Other Indo-European 1%
Political lean MEDSL · Berks
- 2024 margin
- R (+12.2) · D 43.4% · R 55.6%
- 2008→2024 swing
- -21.4pp toward R · 2008: 9.2pp · 2024: -12.2pp
- All cycles
- 2024: R+12.2 2020: R+8.2 2016: R+10.2 2012: R+0.6 2008: D+9.2
Not yet ingested
- Civics
- —
Market trends
- HPI YoY
- ▼ -74.10%
- Current HPI
- 271.6774
- Rent YoY
- —
- Metro
- —
- State GDP YoY
- ▲ 1.68%
- F500 in state
- 34
Industry mix (Fortune 500 HQ in PA)
| Industry | F500 HQs | Revenue |
|---|---|---|
| Healthcare | 2 | $309B |
|
||
| Insurance | 2 | $27B |
|
||
| Telecommunications / Media | 1 | $124B |
|
||
| Industrial Distribution | 1 | $22B |
|
||
| Financial Services | 1 | $20B |
|
||
| Chemicals / Materials | 1 | $18B |
|
||
Price history
1 event — show timeline
- 2026-05-12 Listed $69,999 FSBO.com
Property tax history
+2.2%/yrLatest (2026): $2,108 · +0.0% YoY. Source: county tax records.
Cash-flow waterfall
monthlySold comps — $/sqft
last 12 mo · ≤1 miLoading sold comps…