 12-Plex
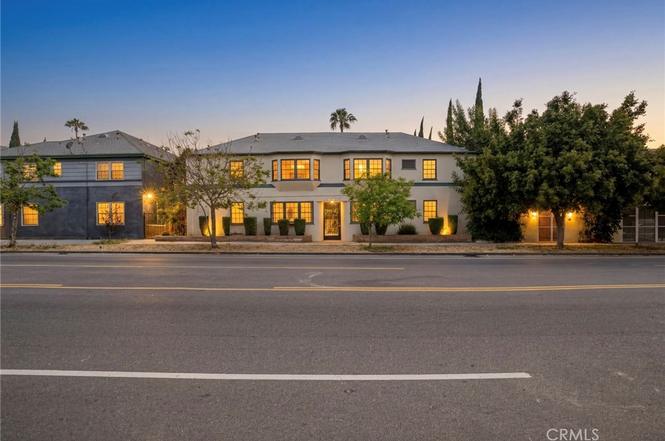
1215 S Fairfax Ave · Los Angeles, CA
Flood risk 1/10 · Minimal
- FEMA flood zone
- X (unshaded)
- Chance of flooding over 30 yrs
- 0.0%
- Est. flood insurance / yr
- $507 – $1,088
Fire risk 1/10 · Minimal
- Est. fire insurance / yr
- $659 – $1,223
Heat risk 6/10 · Moderate
- Hot days now (above 88°F)
- 7 days/yr
- Hot days in 30 yrs
- 21 days/yr
Wind risk 1/10 · Minimal
- Chance of severe wind over 30 yrs
- —
Air-quality risk 5/10 · Moderate
- Unhealthy air days now
- 7 days/yr
- Unhealthy air days in 30 yrs
- 7 days/yr
Risk factors via First Street. Map © Google.
Why this score? — see what drove the B- grade
The composite is a weighted blend of 9 inputs, each scored 0–100. Each bar is that input's sub-score; the figure is the points it added to the 100-point composite (weight × sub-score).
- Cash flow +30.0/30.0
- 1% rule +10.0/10.0
- DSCR +10.0/10.0
- ARV discount +7.5/15.0
- Schools +3.6/10.0
- Livability +3.4/5.0
- Condition / age +2.5/5.0
- Rent growth +2.4/5.0
- Appreciation +0.0/10.0
$2,600,000
🖨 Deal sheet (PDF) 📄 Offer letter ✓ Due diligence
Multi-family units
County records classify this as Multi-Family (5+ Unit). Listing-text estimate: 12 units. confirmed
5+ unit building — per-unit beds/baths from public records are typically unavailable; the breakdown below (if shown) is an estimate from the listing text.
Listing remarks MLS
SELLER FINANCING AVAILABLE!!! Yes, the seller will carry the debt at 4% interest only with $1.2M down on this asset for three years. Very rare to find an asset like this in Carthay, the most desired pocket of Los Angeles. You will not find a better price/unit or price/sf in the area. Due to location, this is a perfect asset to TIC and sell off as individual TIC homes with a total sales price of $7,200,000. You cannot find a better deal than this. To learn more please see exit TIC SALE proforma on page 14 of the OM. 1215 S Fairfax Ave is a 12 unit trophy asset located in an A+ area. The subject property is priced at only $233k/unit and has over 100% upside in rents. Once rented for market, 1215 S Fairfax will operate at a 10.44% CAP and 7.44 GRM. This is the ideal opportunity for any value-add investor looking for major upside in a top-tier location. 1215 S Fairfax is comprised of (10) 1Bed+1Bath and (2) Studio+1Bath units. Due to its location, the subject property demands high rents, beneficial to any new buyer. There are (4) 2 car garages located in the rear alley way, as well as plenty of street and permitted parking. There is also a shared laundry room on site. Located just minutes away from many shops, restaurants and other entertainment- this is a renter's dream! With a 91 walk score, this property is considered a walker's paradise,
Key facts
- Strong rental demand
- Rental repositioning
- 8,255 sq ft lot
Tags
Property features AI
Finance
- Other: Zoning: LAR3; Lot features: 0-1 unit/acre (per assessor); Location note: On Fairfax Ave, off Pico Blvd
- Financial info: Total building area: 8,578; Total of 12 units, 11 currently leased; Gross scheduled income: $205,001; Gross income: $205,001; Total actual rent collected: $17,066; Net operating income: $124,142; Gross multiplier: 14.54; Operating expenses: $80,859; Expense examples: Taxes $32,500; Water/Sewer $12,800; Insurance $10,723; Maintenance $6,831; Trash $6,200; Electric $1,387; Tenant pays gas and electricity; Rent control applies
Exterior
- Parking: Eight garage/parking spaces
- Utilities: Public sewer; District/public water; Twelve separate gas meters; Twelve separate electric meters; One separate water meter
- Home design: Two-story building; Single building containing all units; No ADU
- Construction: Year built per assessor (source: Assessor)
- Exterior features: No pool; Curbs; Urban setting with nearby park and dog park; Access to biking and hiking areas; Near golf course
Interior
- Kitchen: Kitchens in each unit (appliance specifics not provided)
- Bedrooms: Twelve 1-bedroom units (each unit listed as 1 bed)
- Bathrooms: Each unit has 1 full bathroom
- Interior features: Front entry; Entry on main level; Attached property with 2+ common walls; Community apartment
- Laundry & utility: On-site laundry area
Neighborhood map
What this means for you Summary
Snapshot
- This is a 12 × 10-bed/12.0-bath units multifamily listed at $2.60M.
Deal economics
- At list price, monthly cash flow is $17k ($209k/yr) — positive. Per door: $1k/mo.
- The deal already cash-flows at list — no discount required.
- Meets the 1% rule at list price ($44k rent vs $2.60M).
- Cap rate 14.3% vs local median 2.1% in Los Angeles — top-decile yield for the area; either an underpriced asset or a hidden risk that comps aren't pricing in. Stress-test before assuming the spread holds.
Location & tenants
- Location reads 68/100 on livability (#273 in CA) — a middle-class / working-renter tenant base. Strengths: amenities A+, commute A+, employment B; Watch: health & safety C-, crime F, cost of living F.
- Los Angeles Unified (urban): math 29% / reading 54% proficiency, ranked #223 of 517 in CA (top 43%) — families likely to look elsewhere, expect single-tenant / working-renter base with shorter leases; 67% free/reduced lunch — lower-income household profile, screen leases tightly.
- Zoned schools: Carthay Elementary of Environmental Studies Magnet (323 students, 66% FRL); Emerson Community Charter (492 students, 51% FRL, charter); Fairfax Senior High (math 40% / reading 61%, grade D+, #324 of 1,170 statewide, top 28%, 1,632 students, 81% FRL) — zoned schools at 66% FRL track the district average.
- Market conditions: Rents soft (-0.5%/yr); 206 active listings in the ZIP; 19,697 units permitted in Los Angeles County in 2024 (9,426 in 5+ unit buildings).
- At $44,267/mo this rent would consume 718% of the median local household income ($74k/yr) (locally 5272% of renters already pay >50% of income on rent) — very limited rent-growth headroom before tenants either downsize or default.
Forward outlook
- Local home prices are declining (-3.0%/yr); year-one equity from $18k of loan paydown is wiped out by about $78k of value loss. Plan a longer hold.
- Los Angeles County population projected at +9% by 2050 — modest demand growth; plan on rents tracking national, not racing it.
- At projected returns (-3.0% appreciation + 0.0% rent growth), your $728k cash investment doubles in ~5 years — after that, you're playing with house money.
Negotiation context
- Only 11 days on market — expect competitive offers; lowballing is unlikely to land.
- 8 sale attempts since 23y ago with the ask held roughly flat each time — persistent listings suggest the price (not the market) is what's stuck; bring a comps-based counter.
Risks & watch-outs
- Watch-outs: built in 1950 — expect roof / HVAC / electrical / plumbing capex.
- Climate carrying-cost: extreme-heat days projected 7→21/yr by 2055 (HVAC capex compounding) — expect insurance premiums to compound above CPI over the hold.
Questions for the listing agent
- Can we see the unit-by-unit rent roll, current vacancy, and any below-market leases? What's the average tenancy length?
- What capital expenditures (roof, boiler, parking lot, exteriors) have been made in the last 5 years, and what's planned in the next 2?
- Built in 1950 — when were the roof, HVAC, electrical panel, plumbing, and water heater last replaced?
- Is there a deadline driving the sale (1031 exchange, divorce, estate, relocation)? That informs how much negotiation room exists.
- Schools are D-rated, which usually means shorter tenancies and higher turnover. Who's the typical renter profile here, and what's been the actual vacancy rate?
- Crime grade is F in this area — have there been break-ins, vandalism, or insurance claims at this property in the last 3 years? What carrier currently insures it and at what premium?
- What's the average days-on-market for RENTAL listings here right now (not sales)? A rising rental-DOM trend means longer vacancies and softer asking-rent achievability than the comps imply.
- What's the recent tenant-quality profile in this submarket — average credit score on applications, eviction rate, late-payment / NSF rate, and stable-employment percentage? A property-management company in the area should have these aggregated.
- How much new apartment / multifamily construction is in the pipeline within 1–3 miles? Heavy new supply (>2% of stock underway) typically softens rents 12–24 months out; light construction supports rent growth.
Investment metrics
- 1% rule
- 1.70% ✓
- Cap rate
- 14.32%
- Cash-on-cash
- 28.66%
- DSCR
- 2.28
- GRM
- 4.9
CMA / ARV
No comps found within radius.
Projected returns pro-forma
-3.0% appreciation · 0.0% rent growth · sell at horizon
- IRR
- 19.6%
- Equity multiple
- 1.76×
- Total profit
- $556,884
- Equity at exit
- $387,668
- IRR
- 25.7%
- Equity multiple
- 2.94×
- Total profit
- $1,411,398
- Equity at exit
- $224,800
Cash invested: $728,000 (down + closing). Projections, not guarantees.
Landlord ↔ Tenant lean methodology
- Overall (CITY)
- 0 Strongly Tenant-Friendly
- State California
- 18 Strongly Tenant-Friendly · D+13
- County
- — inherits STATE
- City Los Angeles
- 0 Strongly Tenant-Friendly · D+22
ZIP-level market 90019
- Rents YoY
- -0.5%
- Active inventory
- 206
- Price-to-rent
- 58.7×
Monthly cashflow live
- Estimated rent
- $44,267 medium interval (Pro) →
- Mortgage (P&I)
- −$13,635
- Tax from tax record
- −$2,864 /mo · $34,371/yr
- Insurance
- −$1,083
- HOA
- −$0
- Vacancy / Maint / Mgmt
- −$9,296
- Net cashflow
- $17,389
Break-even live
Sensitivity live
| Price | -10% $18,860 | -5% $18,125 | +0% $17,389 | +5% $16,653 | +10% $15,917 |
|---|---|---|---|---|---|
| Rent | -10% $13,892 | -5% $15,640 | +0% $17,389 | +5% $19,137 | +10% $20,886 |
| Rate | -1.0pp $18,698 | -0.5pp $18,050 | base $17,389 | +0.5pp $16,715 | +1.0pp $16,030 |
12-unit breakdown (identical units grouped — click to expand)
| Units | Beds | Baths | Est. rent |
|---|---|---|---|
| 12× units | 10 | 12 | $44,268 |
| #1 | 10 | 12 | $3,689 |
| #2 | 10 | 12 | $3,689 |
| #3 | 10 | 12 | $3,689 |
| #4 | 10 | 12 | $3,689 |
| #5 | 10 | 12 | $3,689 |
| #6 | 10 | 12 | $3,689 |
| #7 | 10 | 12 | $3,689 |
| #8 | 10 | 12 | $3,689 |
| #9 | 10 | 12 | $3,689 |
| #10 | 10 | 12 | $3,689 |
| #11 | 10 | 12 | $3,689 |
| #12 | 10 | 12 | $3,689 |
| Total (12 units) | $44,267 | ||
UW: 25.0% down · 7.5% · 30yr · 1.5% tax · 5.0% vac · 8.0% maint · 8.0% mgmt
Financing live
Cash to close
- Down payment
- $650,000
- Closing costs
- $78,000
- Reserves months
- —
- Total cash needed
- —
Loan-product check · same deal, 3 products live
Conventional
25% down · 7.5% · 30yr
- Down + closing
- —
- Monthly P&I
- —
- Monthly cashflow
- —
- DSCR
- —
- Eligible?
- —
Personal DTI + credit; lowest rate.
DSCR
20% down · 8.5% · 30yr
- Down + closing
- —
- Monthly P&I
- —
- Monthly cashflow
- —
- DSCR
- —
- Eligible?
- —
No personal income docs; deal must DSCR.
Hard money
10% down · 12.0% · 12mo
- Down + closing
- —
- Monthly P&I
- —
- Monthly cashflow
- —
- DSCR
- —
- Eligible?
- —
Short-term bridge; refi at stabilization.
Listing history 7 events
-
2026-06-21days on market $2,600,000 Active 11 DOM
-
2026-06-18days on market $2,600,000 Active 8 DOM
-
2026-06-17days on market $2,600,000 Active 7 DOM
-
2026-06-16days on market $2,600,000 Active 6 DOM
-
2026-06-15days on market $2,600,000 Active 5 DOM
-
2026-06-13remarks 681-char remark
-
2026-06-13$2,600,000 Active 3 DOM
ⓘ Source: listings_history table (triggers on properties + properties_extension) + one-shot
backfill from property_details.listing_events for pre-trigger history.
Tax reassessment forecast CA · Resets to sale price
- Current annual tax
- $34,371 · $2,864/mo
- Projected year-2 tax
- $34,371 · $2,864/mo
- Expected delta
- $0/yr ($0/mo · 0.0%)
ⓘ Screening estimate from a state-policy table — verify with the county assessor before closing.
Climate risk First Street
- Flood 1/10 Low FEMA zone X (unshaded) · 0% chance over 30 yrs
- Wildfire 1/10 Low
- Heat 6/10 Major 7 d/yr ≥88°F today · 21 d/yr by 30 yrs out
- Wind 1/10 Low
- Air quality 5/10 Major 7 unhealthy d/yr today · 7 by 30 yrs out
Nearby sold comps map
Loading sold comps map…
Walkable amenities ~0.75 mi
Loading nearby amenities…
Taxation est. · year 1
- Rental income
- $531,204
- − Mortgage interest
- −$145,640
- − Property taxes
- −$34,371
- − Insurance
- −$13,000
- − Repairs & maintenance
- −$42,496
- − Management
- −$42,496
- − Depreciation
- −$75,636
- Taxable income
- $177,564
- Est. tax owed @ 24.0%
- −$42,615
- After-tax cash flow
- $166,049/yr
For passive investors: Depreciation is non-cash, so a rental often shows a tax loss while cash-flowing — sheltering income. Rental losses are passive: they offset passive income freely, and up to $25,000/yr can offset ordinary (W-2) income if you actively participate and your MAGI is under $100k (phasing out to $0 by $150k); unused losses carry forward. On sale, claimed depreciation is recaptured at up to 25%, and gains may owe capital-gains tax (a 1031 exchange can defer both). Figures are a year-1 estimate at your 24.0% rate — not tax advice; consult a CPA.
Schools (NCES district)
- District
- Los Angeles Unified
- NCES district ID
- 0622710
- Math proficiency
- 29% ▼ -4.00%
- Reading proficiency
- 54% ▲ 10.00%
- Median HH income
- $50,403
- Composite
- 35.67/100
- National rank
- #4875
- State rank
- #223 of 517 in CA
Livability — Los Angeles
- Score
- 68/100
- State rank
- #273
- US rank
- #9237
Category grades
Schools grade is shown separately in the Schools card above.
Census & demographics
- Census place
- Los Angeles, CA
- County
- Los Angeles County · 9,444,647 people
- City population
- 3,838,149
- Metro
- Los Angeles-Long Beach-Anaheim, CA
- Population (ZIP)
- 59,548
- Household income
- $73,934
- Rent vs Own
- Severe rent burden
- 5272.0
Population outlook (Los Angeles County) Hauer SSP2
- Today (2025)
- 10,940,515 people
- By 2030
- 11,256,481 · +2.9%
- By 2040
- 11,729,929 · +7.2%
- By 2050
- 11,948,407 · +9.2%
- By 2075
- 11,818,114 · +8.0%
- By 2100
- 10,842,928 · -0.9%
Race, ethnicity, and origin ACS 2023
- Neighborhood character
- Highly diverse neighborhood (Simpson 0.73)
- Race & ethnicity
- Hispanic / Latino 43% White 18% Black 17% Asian 17% Two or more races 13%
- Hispanic origin (detail)
- Mexican 26%
- Common ancestry
- Lithuanian 1% Romanian 1% Italian 1%
- Foreign-born
- 37% · Canada, South Korea, China
- Languages at home
- 45% English-only · Spanish 38% Korean 10% Tagalog/Filipino 1%
Political lean MEDSL · Los Angeles
- 2024 margin
- Solid D (+32.9) · D 64.8% · R 31.9% · Other 3.3%
- 2008→2024 swing
- -7.4pp toward R · 2008: 40.4pp · 2024: 32.9pp
- All cycles
- 2024: D+32.9 2020: D+44.2 2016: D+48.0 2012: D+40.0 2008: D+40.4
Not yet ingested
- Civics
- —
Market trends
- HPI YoY
- ▼ -1477.82%
- Current HPI
- 425.5427
- Rent YoY
- ▼ -0.50%
- Metro
- Los Angeles-Long Beach-Anaheim, CA
- State GDP YoY
- ▲ 3.21%
- F500 in state
- 116
Industry mix (Fortune 500 HQ in CA)
| Industry | F500 HQs | Revenue |
|---|---|---|
| Technology | 27 | $1,492B |
|
||
| Financial Services | 3 | $174B |
|
||
| Retail | 3 | $44B |
|
||
| Insurance | 3 | $26B |
|
||
| Media / Entertainment | 2 | $115B |
|
||
| Pharmaceuticals / Biotech | 2 | $62B |
|
||
Price history
+1305.4% since first listed20 events — show timeline
- 2026-06-10 Listed $2,600,000 CRMLS
- 2024-04-18 Rental Removed $2,195 APPFOLIO
- 2024-04-10 Listed for Rent $2,195 APPFOLIO
- 2024-04-10 Rental Removed $2,195 APPFOLIO
- 2024-03-13 Price Changed $2,195 APPFOLIO
- 2024-02-05 Price Changed $2,200 APPFOLIO
- 2024-02-04 Listed for Rent $1,900 APPFOLIO
- 2023-10-02 Sold (MLS) $2,700,000 CRMLS
- 2023-09-27 Sold (Public Records) $2,700,000 Public Records
- 2023-08-08 Price Changed $2,800,000 CRMLS
- 2023-06-27 Price Changed $3,025,000 CRMLS
- 2023-06-09 Relisted — CRMLS
- 2023-05-30 Price Changed $2,975,000 CRMLS
- 2023-05-16 Relisted — CRMLS
- 2023-05-13 Relisted — CRMLS
- 2023-04-25 Listed $3,300,000 CRMLS
- 2023-04-18 Coming Soon $3,300,000 CRMLS
- 2004-02-04 Sold (Public Records) $950,000 Public Records
- 2003-08-15 Listed $1,100,000 CRMLS
- 1978-02-21 Sold (Public Records) $185,000 Public Records
Property tax history
+5.6%/yrLatest (2025): $34,371 · +1.2% YoY. Source: county tax records.
Cash-flow waterfall
monthlySold comps — $/sqft
last 12 mo · ≤1 miLoading sold comps…