 Duplex
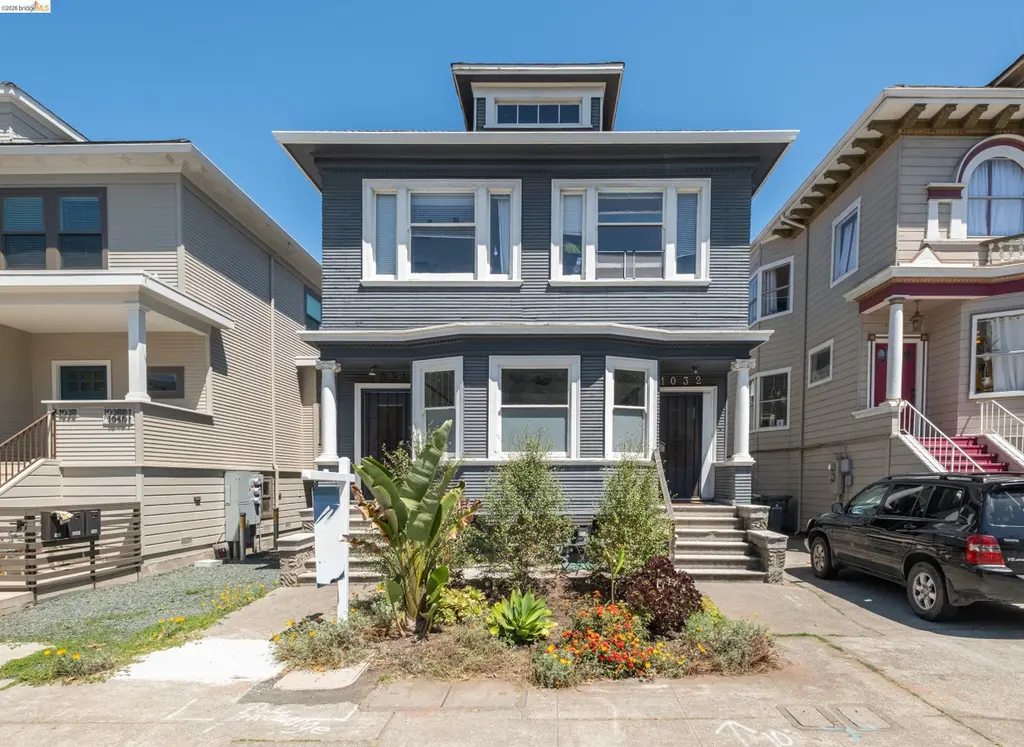
1032 Magnolia St · Oakland, CA
Flood risk 1/10 · Minimal
- FEMA flood zone
- X (unshaded)
- Chance of flooding over 30 yrs
- 0.0%
- Est. flood insurance / yr
- $507 – $1,088
Fire risk 1/10 · Minimal
- Est. fire insurance / yr
- $659 – $1,223
Heat risk 3/10 · Minor
- Hot days now (above 82°F)
- 7 days/yr
- Hot days in 30 yrs
- 15 days/yr
Wind risk 1/10 · Minimal
- Chance of severe wind over 30 yrs
- —
Air-quality risk 9/10 · Severe
- Unhealthy air days now
- 16 days/yr
- Unhealthy air days in 30 yrs
- 16 days/yr
Risk factors via First Street. Map © Google.
Why this score? — see what drove the D+ grade
The composite is a weighted blend of 9 inputs, each scored 0–100. Each bar is that input's sub-score; the figure is the points it added to the 100-point composite (weight × sub-score).
- Cash flow +15.4/30.0
- ARV discount +13.8/15.0
- DSCR +4.7/10.0
- Livability +3.6/5.0
- 1% rule +3.5/10.0
- Rent growth +3.3/5.0
- Schools +3.0/10.0
- Condition / age +2.5/5.0
- Appreciation +0.0/10.0
$749,000
🖨 Deal sheet (PDF) 📄 Offer letter ✓ Due diligence
Multi-family units
County records classify this as Multi-Family (2-4 Unit). Listing-text estimate: 2 units. confirmed
Listing remarks
A true house-hack opportunity in a desirable part of West Oakland. Located on a tree-lined street near Downtown and BART, 1032–1034 Magnolia offers get flexibility, income, and upside all in one property. The duplex features two spacious units, with one unit delivered available as a blank canvas ready for renovation and the other rented at $2,795/month, giving an owner-occupant immediate mortgage or tax relief or both from day one. A huge rear yard offers room to expand, garden, or create additional outdoor living space and if you need inspiration, just look at the property next door. With inspections available in the disclosures and a layout that supports privacy between units, this
Key facts
- Two spacious units
- Huge rear yard
- 4,220 sq ft lot
Tags
Property features AI
Finance
- Financial info: Two-unit income property
Exterior
- Parking: Off-street parking (total 1 space)
- Utilities: Public water; Public sewer; Sewer connected; Separate meters for electric, gas, and water
- Home design: Duplex (residential income); Built in 1907
- Construction: Lap and wood siding construction
- Exterior features: Back yard; Front yard; Garden; Deck; Balcony/Patio; Premium, rectangular lot
Interior
- Kitchen: No kitchen appliance details provided
- Bedrooms: 2-unit property (individual bedroom counts not provided)
- Flooring: Hardwood
- Bathrooms: Each unit includes 1 bathroom
- Heating & cooling: Natural gas heating; No air conditioning
- Interior features: Hardwood flooring; In-unit laundry
- Laundry & utility: Washer and dryer included; Separate meters for electric, gas, and water
Neighborhood map
What this means for you Summary
Snapshot
- This is a 2 × 3-bed/1.0-bath units multifamily listed at $749k.
Deal economics
- At list price, monthly cash flow is $289 ($3k/yr) — positive. Per door: $145/mo.
- The deal already cash-flows at list — no discount required.
- To meet the 1% rule (rent ≥ 1% of price), the offer needs to be $639k (14.7% below list).
- Recommended offer: $639k (14.7% below list) — sets the bar for 1% rule.
- Cap rate 6.8% vs local median 2.5% in Oakland — top-decile yield for the area; either an underpriced asset or a hidden risk that comps aren't pricing in. Stress-test before assuming the spread holds.
Location & tenants
- Location reads 71/100 on livability (#224 in CA) — a middle-class / working-renter tenant base. Strengths: amenities A+, commute A+, employment A+; Watch: crime F, cost of living F.
- Oakland Unified (urban): math 27% / reading 33% proficiency, ranked #1,007 of 1,400 in CA (top 72%) — families likely to look elsewhere, expect single-tenant / working-renter base with shorter leases; 68% free/reduced lunch — lower-income household profile, screen leases tightly.
- Zoned schools: Martin Luther King Jr. Elementary (347 students, 95% FRL); West Oakland Middle (178 students, 99% FRL); Mcclymonds High (281 students, 90% FRL) — zoned schools average 95% FRL vs 68% district-wide (26 pts higher); higher-poverty schools than district average — tighter screening recommended.
- Market conditions: Rents rising (+3.2%/yr); 135 active listings in the ZIP; 9 comparable units currently listed for rent nearby; rentals lingering (median 46d on market — plan ~5-8 weeks vacancy on turnover, expect pricing pressure); 56% of comp listings sitting > 30 days — soft ceiling on asking rent; solid renter incomes; 1,742 units permitted in Alameda County in 2024 (856 in 5+ unit buildings).
- At $6,387/mo this rent would consume 81% of the median local household income ($95k/yr) (locally 2002% of renters already pay >50% of income on rent) — very limited rent-growth headroom before tenants either downsize or default.
Forward outlook
- Local home prices are declining (-3.0%/yr); year-one equity from $5k of loan paydown is wiped out by about $22k of value loss. Plan a longer hold.
- Alameda County population projected at +34% by 2050 — long-run rental-demand tailwind backs the buy-and-hold thesis.
Negotiation context
- Only 12 days on market — expect competitive offers; lowballing is unlikely to land.
- Current owner paid $185k; list at $749k implies a 305% gain — meaningful room to come down on a strong offer.
Risks & watch-outs
- Watch-outs: built in 1907 — expect roof / HVAC / electrical / plumbing capex.
Questions for the listing agent
- Can we see the unit-by-unit rent roll, current vacancy, and any below-market leases? What's the average tenancy length?
- What capital expenditures (roof, boiler, parking lot, exteriors) have been made in the last 5 years, and what's planned in the next 2?
- Built in 1907 — when were the roof, HVAC, electrical panel, plumbing, and water heater last replaced?
- Is there a deadline driving the sale (1031 exchange, divorce, estate, relocation)? That informs how much negotiation room exists.
- Crime grade is F in this area — have there been break-ins, vandalism, or insurance claims at this property in the last 3 years? What carrier currently insures it and at what premium?
- The area grade is low — what's the realistic commute time and amenity access for the typical tenant pool here? Any planned neighborhood developments (good or bad) we should know about?
- What's the average days-on-market for RENTAL listings here right now (not sales)? A rising rental-DOM trend means longer vacancies and softer asking-rent achievability than the comps imply.
- What's the recent tenant-quality profile in this submarket — average credit score on applications, eviction rate, late-payment / NSF rate, and stable-employment percentage? A property-management company in the area should have these aggregated.
- How much new apartment / multifamily construction is in the pipeline within 1–3 miles? Heavy new supply (>2% of stock underway) typically softens rents 12–24 months out; light construction supports rent growth.
Investment metrics
- 1% rule
- 0.85% ✗
- Cap rate
- 6.76%
- Cash-on-cash
- 1.66%
- DSCR
- 1.07
- GRM
- 9.8
CMA / ARV
- ARV (on-the-fly)
- $872,040
- Comps found
- 1
Show comp detail 1 sale within ~0.75 mi
| Address | Dist | Beds/Ba | Sqft | Sold | Price | $/sf | Match |
|---|---|---|---|---|---|---|---|
| 819 15th St | 0.44mi | 5/4.0 (+1) | 2,620 (+3%) | 21mo | $900,000 | $344 | 44 |
Match score weights: distance 35% · size 25% · config 20% · recency 20%. Top-matched comps best support the ARV.
Projected returns pro-forma
-3.0% appreciation · 3.24% rent growth · sell at horizon
- IRR
- -13.4%
- Equity multiple
- 0.52×
- Total profit
- $-101,559
- Equity at exit
- $111,678
- IRR
- -4.2%
- Equity multiple
- 0.72×
- Total profit
- $-58,989
- Equity at exit
- $64,760
Cash invested: $209,720 (down + closing). Projections, not guarantees.
Landlord ↔ Tenant lean methodology
- Overall (CITY)
- 0 Strongly Tenant-Friendly
- State California
- 18 Strongly Tenant-Friendly · D+13
- County
- — inherits STATE
- City Oakland
- 0 Strongly Tenant-Friendly · D+62
ZIP-level market 94607
- Rents YoY
- 3.2%
- Active inventory
- 135
- Price-to-rent
- 19.5×
Monthly cashflow live
- Estimated rent
- $6,387 high interval (Pro) →
- Mortgage (P&I)
- −$3,928
- Tax from tax record
- −$516 /mo · $6,198/yr
- Insurance
- −$312
- HOA
- −$0
- Vacancy / Maint / Mgmt
- −$1,341
- Net cashflow
- $289
Break-even live
Sensitivity live
| Price | -10% $713 | -5% $501 | +0% $289 | +5% $77 | +10% $-135 |
|---|---|---|---|---|---|
| Rent | -10% $-215 | -5% $37 | +0% $289 | +5% $542 | +10% $794 |
| Rate | -1.0pp $667 | -0.5pp $480 | base $289 | +0.5pp $95 | +1.0pp $-102 |
2-unit breakdown (identical units grouped — click to expand)
| Units | Beds | Baths | Est. rent |
|---|---|---|---|
| 2× units | 3 | 1 | $6,388 |
| #1 | 3 | 1 | $3,194 |
| #2 | 3 | 1 | $3,194 |
| Total (2 units) | $6,387 | ||
UW: 25.0% down · 7.5% · 30yr · 1.5% tax · 5.0% vac · 8.0% maint · 8.0% mgmt
Financing live
Cash to close
- Down payment
- $187,250
- Closing costs
- $22,470
- Reserves months
- —
- Total cash needed
- —
Loan-product check · same deal, 3 products live
Conventional
25% down · 7.5% · 30yr
- Down + closing
- —
- Monthly P&I
- —
- Monthly cashflow
- —
- DSCR
- —
- Eligible?
- —
Personal DTI + credit; lowest rate.
DSCR
20% down · 8.5% · 30yr
- Down + closing
- —
- Monthly P&I
- —
- Monthly cashflow
- —
- DSCR
- —
- Eligible?
- —
No personal income docs; deal must DSCR.
Hard money
10% down · 12.0% · 12mo
- Down + closing
- —
- Monthly P&I
- —
- Monthly cashflow
- —
- DSCR
- —
- Eligible?
- —
Short-term bridge; refi at stabilization.
Rent comps 9 comps
| Address | Beds | Baths | Sqft | Rent | $/sqft | DOM | Units | Dist |
|---|---|---|---|---|---|---|---|---|
| 1216 10th St Oakland, CA | 3.0 | 2.0 | 1750 | $3,399 | $1.94 | 45d | 1 | 0.04mi |
| 1202 Adeline St Oakland, CA | 4.0 | 3.0 | 1800 | $3,795 | $2.11 | 22d | 1 | 0.12mi |
| 1015 Martin Luther King Junior Way Oakland, CA | 4.0 | 2.0 | 1800 | $1,300 | $0.72 | 45d | 1 | 0.60mi |
| 1015 Martin Luther King Junior Way Unit B2 Oakland, CA | 4.0 | 2.0 | 1800 | $1,000 | $0.56 | 45d | 1 | 0.61mi |
| 1123 30th St Emeryville, CA | 3.0 | 2.0 | 2083 | $4,895 | $2.35 | 45d | 1 | 1.08mi |
| 1123 30th St Unit 1 Oakland, CA | 3.0 | 2.5 | 2083 | $4,895 | $2.35 | 45d | 1 | 1.08mi |
| 814 30th St Emeryville, CA | 4.0 | 2.0 | 2015 | $7,000 | $3.47 | 4d | 1 | 1.20mi |
| 3415 Haven St Emeryville, CA | 3.0 | 2.5 | 1900 | $4,200 | $2.21 | 12d | 1 | 1.36mi |
| 2730 Bette St Alameda, CA | 4.0 | 4.0 | 3226 | $6,450 | $2.00 | 6d | 1 | 1.48mi |
Listing history 9 events
-
2026-06-21days on market $749,000 Active 12 DOM
-
2026-06-18days on market $749,000 Active 9 DOM
-
2026-06-17days on market $749,000 Active 8 DOM
-
2026-06-16days on market $749,000 Active 7 DOM
-
2026-06-15days on market $749,000 Active 6 DOM
-
2026-06-13days on market $749,000 Active 4 DOM
-
2026-06-13days on market $749,000 Active 3 DOM
-
2026-06-10remarks 693-char remark
-
2026-06-10$749,000 Active 1 DOM
ⓘ Source: listings_history table (triggers on properties + properties_extension) + one-shot
backfill from property_details.listing_events for pre-trigger history.
Tax reassessment forecast CA · Resets to sale price
- Current annual tax
- $6,198 · $516/mo
- Projected year-2 tax
- $6,198 · $516/mo
- Expected delta
- $0/yr ($0/mo · 0.0%)
ⓘ Screening estimate from a state-policy table — verify with the county assessor before closing.
Climate risk First Street
- Flood 1/10 Low FEMA zone X (unshaded) · 0% chance over 30 yrs
- Wildfire 1/10 Low
- Heat 3/10 Moderate 7 d/yr ≥82°F today · 15 d/yr by 30 yrs out
- Wind 1/10 Low
- Air quality 9/10 Extreme 16 unhealthy d/yr today · 16 by 30 yrs out
Nearby sold comps map
Loading sold comps map…
Walkable amenities ~0.75 mi
Loading nearby amenities…
Taxation est. · year 1
- Rental income
- $76,644
- − Mortgage interest
- −$41,956
- − Property taxes
- −$6,198
- − Insurance
- −$3,745
- − Repairs & maintenance
- −$6,132
- − Management
- −$6,132
- − Depreciation
- −$21,789
- Taxable loss
- −$9,307
- Est. tax savings @ 24.0%
- +$2,234
- After-tax cash flow
- $5,705/yr
For passive investors: Depreciation is non-cash, so a rental often shows a tax loss while cash-flowing — sheltering income. Rental losses are passive: they offset passive income freely, and up to $25,000/yr can offset ordinary (W-2) income if you actively participate and your MAGI is under $100k (phasing out to $0 by $150k); unused losses carry forward. On sale, claimed depreciation is recaptured at up to 25%, and gains may owe capital-gains tax (a 1031 exchange can defer both). Figures are a year-1 estimate at your 24.0% rate — not tax advice; consult a CPA.
Schools (NCES district)
- District
- Oakland Unified
- NCES district ID
- 0628050
- Math proficiency
- 27% ▬ 0.00%
- Reading proficiency
- 33% ▬ 0.00%
- Median HH income
- $55,194
- Composite
- 29.52/100
- National rank
- #11769
- State rank
- #1007 of 1400 in CA
Livability — Oakland
- Score
- 71/100
- State rank
- #224
- US rank
- #7245
Category grades
Schools grade is shown separately in the Schools card above.
Census & demographics
- Census place
- Oakland, CA
- County
- Alameda County · 1,614,355 people
- City population
- 385,993
- Metro
- San Francisco-Oakland-Berkeley, CA
- Population (ZIP)
- 28,804
- Household income
- $94,863
- Rent vs Own
- Severe rent burden
- 2002.0
Population outlook (Alameda County) Hauer SSP2
- Today (2025)
- 1,928,884 people
- By 2030
- 2,069,146 · +7.3%
- By 2040
- 2,338,405 · +21.2%
- By 2050
- 2,586,608 · +34.1%
- By 2075
- 3,061,911 · +58.7%
- By 2100
- 3,234,133 · +67.7%
Race, ethnicity, and origin ACS 2023
- Neighborhood character
- Highly diverse neighborhood (Simpson 0.78)
- Race & ethnicity
- Black 29% White 25% Asian 25% Hispanic / Latino 13% Two or more races 10%
- Hispanic origin (detail)
- Mexican 8%
- Common ancestry
- Lithuanian 1% Romanian 1% Portuguese 1%
- Foreign-born
- 28% · China, Canada, Vietnam
- Languages at home
- 65% English-only · Chinese 16% Spanish 8% Arabic 2%
Political lean MEDSL · Alameda
- 2024 margin
- Solid D (+53.6) · D 74.6% · R 21.0% · Other 4.4%
- 2008→2024 swing
- -5.9pp toward R · 2008: 59.5pp · 2024: 53.6pp
- All cycles
- 2024: D+53.6 2020: D+62.5 2016: D+64.4 2012: D+59.8 2008: D+59.5
Not yet ingested
- Civics
- —
Market trends
- HPI YoY
- ▼ -170.49%
- Current HPI
- 263.5885
- Rent YoY
- ▲ 3.24%
- Metro
- San Francisco-Oakland-Berkeley, CA
- State GDP YoY
- ▲ 3.21%
- F500 in state
- 116
Industry mix (Fortune 500 HQ in CA)
| Industry | F500 HQs | Revenue |
|---|---|---|
| Technology | 27 | $1,492B |
|
||
| Financial Services | 3 | $174B |
|
||
| Retail | 3 | $44B |
|
||
| Insurance | 3 | $26B |
|
||
| Media / Entertainment | 2 | $115B |
|
||
| Pharmaceuticals / Biotech | 2 | $62B |
|
||
Price history
+353.9% since first listed3 events — show timeline
- 2026-06-09 Listed $749,000 bridgeMLS, Bay East AOR, or Contra Costa AOR
- 1999-06-10 Sold (Public Records) $185,000 Public Records
- 1989-12-26 Sold (Public Records) $165,000 Public Records
Property tax history
+3.0%/yrLatest (2025): $6,198 · +4.4% YoY. Source: county tax records.
Cash-flow waterfall
monthlySold comps — $/sqft
last 12 mo · ≤1 miLoading sold comps…