927 Byron Ln Unit 13-B · Whitfield, FL
Flood risk 7/10 · Major
- FEMA flood zone
- AE
- Chance of flooding over 30 yrs
- 0.76%
- Est. flood insurance / yr
- $1,737 – $8,500
Fire risk 1/10 · Minimal
- Est. fire insurance / yr
- $947 – $1,759
Heat risk 10/10 · Severe
- Hot days now (above 107°F)
- 7 days/yr
- Hot days in 30 yrs
- 30 days/yr
Wind risk 10/10 · Severe
- Chance of severe wind over 30 yrs
- 99.0%
Air-quality risk 2/10 · Minimal
- Unhealthy air days now
- 1 days/yr
- Unhealthy air days in 30 yrs
- 2 days/yr
Risk factors via First Street. Map © Google.
Why this score? — see what drove the C+ grade
The composite is a weighted blend of 9 inputs, each scored 0–100. Each bar is that input's sub-score; the figure is the points it added to the 100-point composite (weight × sub-score).
- Cash flow +26.1/30.0
- 1% rule +10.0/10.0
- DSCR +8.8/10.0
- ARV discount +7.5/15.0
- Schools +4.4/10.0
- Livability +3.9/5.0
- Condition / age +2.5/5.0
- Rent growth +1.5/5.0
- Appreciation +0.0/10.0
$125,000
🖨 Deal sheet (PDF) 📄 Offer letter ✓ Due diligence
Listing remarks
Short Sale. Don't miss this fantastic short sale opportunity in the highly sought-after Shadybrook Village community! This 3-bedroom, 2.5-bathroom condo offers spacious two-story living – a perfect canvas for your personal touches or investment vision. Located just minutes from Sarasota’s best dining, shopping, and beaches, this property combines convenience with community living. Shadybrook Village features amenities including a swimming pool, tennis courts, and a playground – ideal for families or renters. The condo needs some TLC, making it a great opportunity for investors or handy buyers to build equity quickly. Whether you're looking for a primary residence, vacation
Key facts
- Partially furnished
- Minutes from beaches
- Swimming pool
Tags
Property features AI
Finance
- Other: Homestead status indicated
- Financial info: Total annual association fees $5,712
- HOA & community: Monthly HOA fee of $476 (includes pool, electricity, insurance, structure and grounds maintenance, management, pest control, private road, recreational facilities, sewer); Association name: John Lindsay; Association fee required; Community features: clubhouse, community mailbox, playground, pool, tennis courts; buyer approval required; Pets allowed (cats and dogs) with limits; max pet weight 80 lbs
Exterior
- Parking: No parking details provided
- Security: No security details provided
- Utilities: Public water; Public sewer; Broadband/high-speed internet available; Cable available; Electricity connected; Water connected
- Home design: Residential condominium; Two levels (2 stories); Faces south; Floor 1 unit (listed floor number 1)
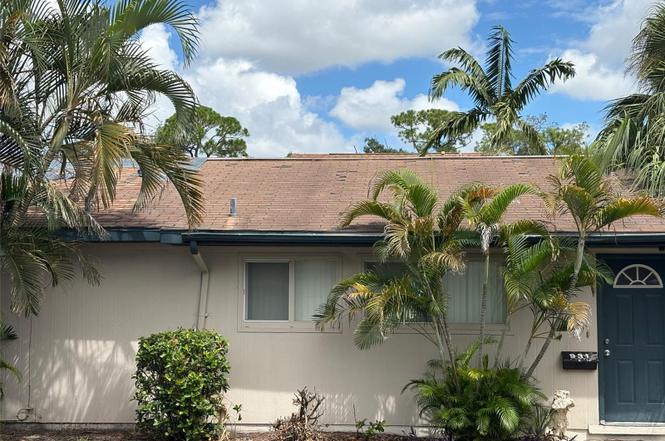
- Construction: Block and brick construction; Shingle roof; Slab foundation; Building name: SHADYBROOK; Built as part of a development on a 16.27-acre parcel
- Exterior features: Other exterior features; Paved road access
Interior
- Kitchen: Cooktop; Dishwasher; Microwave; Refrigerator
- Bedrooms: 3 bedrooms (one or more on first floor: floor number listed as 1)
- Flooring: Tile flooring
- Bathrooms: 2 full bathrooms; 1 half bathroom
- Heating & cooling: Central heating; Central air conditioning
- Interior features: Built-in features
- Laundry & utility: Laundry inside
Neighborhood map
What this means for you Summary
Snapshot
- This is a 3-bed/2.5-bath condo listed at $125k.
Deal economics
- At list price, monthly cash flow is $-110 ($-1k/yr) — negative.
- To cash-flow at today's rent, offer at most $109k (12.7% below list).
- Meets the 1% rule at list price ($2k rent vs $125k).
- Recommended offer: $109k (12.7% below list) — sets the bar for cash-flow.
- Cap rate 9.3% vs local median 2.6% in Whitfield — top-decile yield for the area; either an underpriced asset or a hidden risk that comps aren't pricing in. Stress-test before assuming the spread holds.
Location & tenants
- Location reads 78/100 on livability (#160 in FL, #2,416 nationally) — a middle-class / working-renter tenant base. Strengths: crime A+, employment A+, housing A+; Watch: schools D, amenities F, commute F.
- Manatee (suburban): math 54% / reading 50% proficiency, ranked #26 of 73 in FL (top 36%) — acceptable for families but not a draw, mixed tenant base, ~2y average lease.
- Market conditions: Rents falling (-4.1%/yr); 386 active listings in the ZIP; 32 comparable units currently listed for rent nearby; rentals at typical pace (median 17d on market — plan ~3-4 weeks tenant-placement turnaround); solid renter incomes; 7,472 units permitted in Manatee County in 2024 (1,782 in 5+ unit buildings).
- This rent runs 31% of the median local income ($81k/yr) — at the standard rent-burdened threshold; future hikes will face affordability resistance.
Forward outlook
- Local home prices are declining (-3.0%/yr); year-one equity from $864 of loan paydown is wiped out by about $4k of value loss. Plan a longer hold.
- Manatee County population projected at +43% by 2050 — long-run rental-demand tailwind backs the buy-and-hold thesis.
Negotiation context
- It's been on market 253 days — a 12% lower offer ($110k) is reasonable based on typical stale-listing flexibility.
Risks & watch-outs
- Watch-outs: flood insurance adds $427/mo; HOA is 23% of rent.
- Climate carrying-cost: in FEMA flood zone AE (mandatory federal flood insurance); severe wind risk, 99% chance of damaging wind over 30y; extreme-heat days projected 7→30/yr by 2055 (HVAC capex compounding) — expect insurance premiums to compound above CPI over the hold.
Questions for the listing agent
- What do current leases actually rent for vs. the listed asking? Can we see a recent rent roll and the last 12 months of T-12 income?
- It's been on market 253 days. Have you received any prior offers? Is the seller open to a 13% concession, seller financing, or rate buy-down credit?
- Built in 1973 — when were the roof, HVAC, electrical panel, plumbing, and water heater last replaced?
- What's the actual annual flood-insurance premium (NFIP or private), and is the property in a SFHA with mandatory coverage?
- What does the HOA fee cover, when was the last increase, and are there any pending special assessments or reserve-fund shortfalls?
- Any open or pending special assessments — roof, HVAC, plumbing, elevator, façade? What's the per-unit balance and payoff schedule, and is the seller paying it off at close or rolling it to the buyer?
- Why hasn't it sold? Are there any deal-killer items the seller is aware of (foundation, flood, title, zoning, code violations)?
- Is there a deadline driving the sale (1031 exchange, divorce, estate, relocation)? That informs how much negotiation room exists.
- Schools are D-rated, which usually means shorter tenancies and higher turnover. Who's the typical renter profile here, and what's been the actual vacancy rate?
- What's the average days-on-market for RENTAL listings here right now (not sales)? A rising rental-DOM trend means longer vacancies and softer asking-rent achievability than the comps imply.
- What's the recent tenant-quality profile in this submarket — average credit score on applications, eviction rate, late-payment / NSF rate, and stable-employment percentage? A property-management company in the area should have these aggregated.
- How much new apartment / multifamily construction is in the pipeline within 1–3 miles? Heavy new supply (>2% of stock underway) typically softens rents 12–24 months out; light construction supports rent growth.
Investment metrics
- 1% rule
- 1.68% ✓
- Cap rate
- 9.33%
- Cash-on-cash
- 10.86%
- DSCR
- 1.48
- GRM
- 5.0
CMA / ARV
No comps found within radius.
Projected returns pro-forma
-3.0% appreciation · 0.0% rent growth · sell at horizon
- IRR
- -29.8%
- Equity multiple
- 0.06×
- Total profit
- $-32,812
- Equity at exit
- $18,638
- IRR
- -86.7%
- Equity multiple
- -0.68×
- Total profit
- $-58,950
- Equity at exit
- $10,808
Cash invested: $35,000 (down + closing). Projections, not guarantees.
Landlord ↔ Tenant lean methodology
- Overall (STATE)
- 87 Strongly Landlord-Friendly
- State Florida
- 87 Strongly Landlord-Friendly · R+3
- County
- — inherits STATE
- City
- — inherits STATE
ZIP-level market 34243
- Home prices YoY
- -23.0%
- Rents YoY
- -4.1%
- Active inventory
- 386
- Price-to-rent
- 5.0×
Monthly cashflow live
- Estimated rent
- $2,097 high interval (Pro) →
- Mortgage (P&I)
- −$656
- Tax est. 1.5%
- −$156 /mo · $1,875/yr
- Insurance
- −$52
- Flood insurance flood zone
- −$427 /mo · $5,118/yr
- HOA
- −$476
- Vacancy / Maint / Mgmt
- −$440
- Net cashflow
- $-110
Break-even live
Sensitivity live
| Price | -10% $-23 | -5% $-67 | +0% $-110 | +5% $-153 | +10% $-196 |
|---|---|---|---|---|---|
| Rent | -10% $-276 | -5% $-193 | +0% $-110 | +5% $-27 | +10% $56 |
| Rate | -1.0pp $-47 | -0.5pp $-78 | base $-110 | +0.5pp $-142 | +1.0pp $-175 |
UW: 25.0% down · 7.5% · 30yr · 1.5% tax · 5.0% vac · 8.0% maint · 8.0% mgmt
Financing live
Cash to close
- Down payment
- $31,250
- Closing costs
- $3,750
- Reserves months
- —
- Total cash needed
- —
Loan-product check · same deal, 3 products live
Conventional
25% down · 7.5% · 30yr
- Down + closing
- —
- Monthly P&I
- —
- Monthly cashflow
- —
- DSCR
- —
- Eligible?
- —
Personal DTI + credit; lowest rate.
DSCR
20% down · 8.5% · 30yr
- Down + closing
- —
- Monthly P&I
- —
- Monthly cashflow
- —
- DSCR
- —
- Eligible?
- —
No personal income docs; deal must DSCR.
Hard money
10% down · 12.0% · 12mo
- Down + closing
- —
- Monthly P&I
- —
- Monthly cashflow
- —
- DSCR
- —
- Eligible?
- —
Short-term bridge; refi at stabilization.
Rent comps 32 comps
| Address | Beds | Baths | Sqft | Rent | $/sqft | DOM | Units | Dist |
|---|---|---|---|---|---|---|---|---|
| 973 Whitman Dr Sarasota, FL | 3.0 | 2.5 | 1408 | $1,990 | $1.41 | 24d | 1 | 0.01mi |
| 6720 15th St E Sarasota, FL | 1.0–3.0 | 1.0–2.0 | 979 | $2,149 | $2.19 | 3d | 10 | 0.17mi |
| 7036 13th St E Sarasota, FL | 3.0 | 2.0 | 1410 | $7,000 | $4.96 | 24d | 1 | 0.40mi |
| 6509 Magellan Ct Sarasota, FL | 2.0 | 2.0 | 1050 | $1,450 | $1.38 | 15d | 1 | 0.41mi |
| 708 65th Ave E Bradenton, FL | 3.0 | 3.0 | 1800 | $2,195 | $1.22 | 17d | 1 | 0.47mi |
| 833 Wee Burn St Sarasota, FL | 3.0 | 2.0 | 1817 | $2,941 | $1.62 | 4d | 1 | 0.49mi |
| 6205 12th Street Ct E Bradenton, FL | 3.0 | 2.0 | 1018 | $1,895 | $1.86 | 24d | 1 | 0.74mi |
| 1207 62nd Ave E Bradenton, FL | 3.0 | 2.0 | 1018 | $1,995 | $1.96 | 24d | 1 | 0.76mi |
| 1022 61st Avenue Dr E Bradenton, FL | 3.0 | 1.0 | 970 | $1,450 | $1.49 | 17d | 1 | 0.83mi |
| 613 61st Avenue Ter E Unit 613 Bradenton, FL | 3.0 | 2.0 | 1194 | $2,195 | $1.84 | 17d | 1 | 0.88mi |
| 511 65th Avenue Dr W Bradenton, FL | 4.0 | 2.0 | 1434 | $2,695 | $1.88 | 4d | 1 | 1.03mi |
| 1109 59th Avenue Cir E Unit 1109 Bradenton, FL | 3.0 | 2.0 | 945 | $1,795 | $1.90 | 24d | 1 | 1.07mi |
| 3 Date Ave Bradenton, FL | 2.0 | 2.0 | 1000 | $1,495 | $1.50 | 24d | 1 | 1.08mi |
| 804 67th Avenue Ter W Bradenton, FL | 3.0 | 2.0 | 1176 | $1,950 | $1.66 | 11d | 1 | 1.14mi |
| 906 66th Ave W Unit 906 Bradenton, FL | 3.0 | 1.0 | 1200 | $1,900 | $1.58 | 17d | 1 | 1.22mi |
| 308 Lantana Ave Sarasota, FL | 2.0 | 2.0 | 1156 | $2,000 | $1.73 | 21d | 1 | 1.26mi |
| 304 Lantana Ave Sarasota, FL | 2.0 | 2.0 | 1156 | $2,000 | $1.73 | 21d | 1 | 1.27mi |
| 7409 Manatee St Sarasota, FL | 2.0 | 1.0 | 1590 | $1,900 | $1.19 | 17d | 1 | 1.28mi |
| 7310 Manatee St Sarasota, FL | 2.0 | 1.5 | 1100 | $2,150 | $1.95 | 24d | 1 | 1.30mi |
| 512 60th Avenue Ter W Unit 512 Bradenton, FL | 3.0 | 1.5 | 972 | $1,900 | $1.95 | 11d | 1 | 1.31mi |
| 1011 57th Avenue Ter E Bradenton, FL | 3.0 | 3.0 | 1872 | $2,195 | $1.17 | 12d | 1 | 1.33mi |
| 5828 3rd St E Bradenton, FL | 3.0 | 2.0 | 1036 | $1,995 | $1.93 | 24d | 1 | 1.34mi |
| 408 57th Avenue Dr E Apt E Bradenton, FL | 2.0 | 1.5 | 1209 | $1,375 | $1.14 | 12d | 1 | 1.42mi |
| 408 57th Avenue Dr E Unit A Bradenton, FL | 2.0 | 1.5 | 1209 | $1,350 | $1.12 | 11d | 1 | 1.42mi |
| 716 56th Avenue Dr E Bradenton, FL | 3.0 | 2.0 | 1000 | $1,700 | $1.70 | 4d | 1 | 1.43mi |
| 312 57th Avenue Dr E Unit B Bradenton, FL | 2.0 | 1.5 | 1209 | $1,350 | $1.12 | 4d | 1 | 1.44mi |
| 308 57th Avenue Dr E Unit B Bradenton, FL | 2.0 | 1.5 | 1209 | $1,350 | $1.12 | 4d | 1 | 1.45mi |
| 409 57th Avenue Dr E Bradenton, FL | 2.0 | 1.5 | 1209 | $1,375 | $1.14 | 11d | 1 | 1.46mi |
| 5613 8th St Ct E Bradenton, FL | 3.0 | 2.0 | 1000 | $1,700 | $1.70 | 24d | 1 | 1.48mi |
| 2751 72nd Avenue Dr E Sarasota, FL | 3.0 | 1.0 | 962 | $2,800 | $2.91 | 24d | 1 | 1.48mi |
| 304 57th Avenue Dr E Bradenton, FL | 2.0 | 1.5 | 1209 | $1,362 | $1.13 | 4d | 5 | 1.48mi |
| 304 57th Avenue Dr E Bradenton, FL | 2.0 | 1.5 | 1209 | $1,445 | $1.20 | 24d | 3 | 1.48mi |
HOA detail condo
- Monthly dues
- $476 · $5,712/yr
- Likely covers
- pool
- Assessments
- None detected in remarks — confirm with the listing agent.
Listing history 15 events
-
2026-06-18days on market $125,000 Active 253 DOM
-
2026-06-17days on market $125,000 Active 252 DOM
-
2026-06-16days on market $125,000 Active 251 DOM
-
2026-06-15days on market $125,000 Active 250 DOM
-
2026-06-13days on market $125,000 Active 248 DOM
-
2026-06-13days on market $125,000 Active 247 DOM
-
2026-06-10days on market $125,000 Active 245 DOM
-
2026-06-09days on market $125,000 Active 244 DOM
-
2026-06-08days on market $125,000 Active 243 DOM
-
2026-06-08days on market $125,000 Active 242 DOM
-
2026-06-03days on market $125,000 Active 238 DOM
-
2026-06-02days on market $125,000 Active 237 DOM
-
2026-06-01days on market $125,000 Active 236 DOM
-
2026-05-31days on market $125,000 Active 235 DOM
-
2025-10-08$125,000 Active
ⓘ Source: listings_history table (triggers on properties + properties_extension) + one-shot
backfill from property_details.listing_events for pre-trigger history.
Climate risk First Street
- Flood 7/10 Severe FEMA zone AE · 76% chance over 30 yrs
- Wildfire 1/10 Low
- Heat 10/10 Extreme 7 d/yr ≥107°F today · 30 d/yr by 30 yrs out
- Wind 10/10 Extreme 99% chance of damaging wind over 30 yrs
- Air quality 2/10 Low 1 unhealthy d/yr today · 2 by 30 yrs out
Nearby sold comps map
Loading sold comps map…
Walkable amenities ~0.75 mi
Loading nearby amenities…
Taxation est. · year 1
- Rental income
- $25,162
- − Mortgage interest
- −$7,002
- − Property taxes
- −$1,875
- − Insurance
- −$5,744
- − Repairs & maintenance
- −$2,013
- − Management
- −$2,013
- − HOA
- −$5,712
- − Depreciation
- −$3,636
- Taxable loss
- −$2,833
- Est. tax savings @ 24.0%
- +$680
- After-tax cash flow
- $-639/yr
For passive investors: Depreciation is non-cash, so a rental often shows a tax loss while cash-flowing — sheltering income. Rental losses are passive: they offset passive income freely, and up to $25,000/yr can offset ordinary (W-2) income if you actively participate and your MAGI is under $100k (phasing out to $0 by $150k); unused losses carry forward. On sale, claimed depreciation is recaptured at up to 25%, and gains may owe capital-gains tax (a 1031 exchange can defer both). Figures are a year-1 estimate at your 24.0% rate — not tax advice; consult a CPA.
Schools (NCES district)
- District
- Manatee
- NCES district ID
- 1201230
- Math proficiency
- 54% ▼ -6.00%
- Reading proficiency
- 50% ▼ -2.00%
- Median HH income
- $49,607
- Composite
- 44.43/100
- National rank
- #2806
- State rank
- #26 of 73 in FL
Livability — Whitfield
- Score
- 78/100
- State rank
- #160
- US rank
- #2416
Category grades
Schools grade is shown separately in the Schools card above.
Census & demographics
- County
- Manatee County · 416,364 people
- Metro
- North Port-Sarasota-Bradenton, FL
- Population (ZIP)
- 32,773
- Household income
- $81,219
- Rent vs Own
- Severe rent burden
- 1138.0
Population outlook (Manatee County) Hauer SSP2
- Today (2025)
- 447,342 people
- By 2030
- 488,911 · +9.3%
- By 2040
- 567,934 · +27.0%
- By 2050
- 637,995 · +42.6%
- By 2075
- 781,970 · +74.8%
- By 2100
- 848,272 · +89.6%
Race, ethnicity, and origin ACS 2023
- Neighborhood character
- Predominantly White (76%)
- Race & ethnicity
- White 76% Hispanic / Latino 14% Two or more races 11% Asian 3% Black 3%
- Hispanic origin (detail)
- Mexican 5% Puerto Rican 3% Cuban 1%
- Common ancestry
- Romanian 5% Lithuanian 3% Slovak 2%
- Foreign-born
- 16% · Canada, Vietnam, Jamaica
- Languages at home
- 81% English-only · Spanish 8% Russian/Polish/Slavic 3% Other Indo-European 3%
Political lean MEDSL · Manatee
- 2024 margin
- Strong R (+23.5) · D 37.9% · R 61.4%
- 2008→2024 swing
- -16.5pp toward R · 2008: -7.0pp · 2024: -23.5pp
- All cycles
- 2024: R+23.5 2020: R+16.1 2016: R+17.1 2012: R+12.5 2008: R+7.0
Not yet ingested
- Civics
- —
Market trends
- HPI YoY
- ▼ -83.67%
- Current HPI
- 280.5372
- Rent YoY
- ▼ -4.14%
- Metro
- North Port-Sarasota-Bradenton, FL
- State GDP YoY
- ▲ 3.28%
- F500 in state
- 36
Industry mix (Fortune 500 HQ in FL)
| Industry | F500 HQs | Revenue |
|---|---|---|
| Industrial Technology | 2 | $29B |
|
||
| Insurance | 2 | $17B |
|
||
| Retail | 1 | $60B |
|
||
| Technology Distribution | 1 | $58B |
|
||
| Homebuilding | 1 | $35B |
|
||
| Technology Manufacturing | 1 | $35B |
|
||
Price history
1 event — show timeline
- 2025-10-08 Listed $125,000 Stellar MLS as Distributed by MLS Grid
Cash-flow waterfall
monthlySold comps — $/sqft
last 12 mo · ≤1 miLoading sold comps…