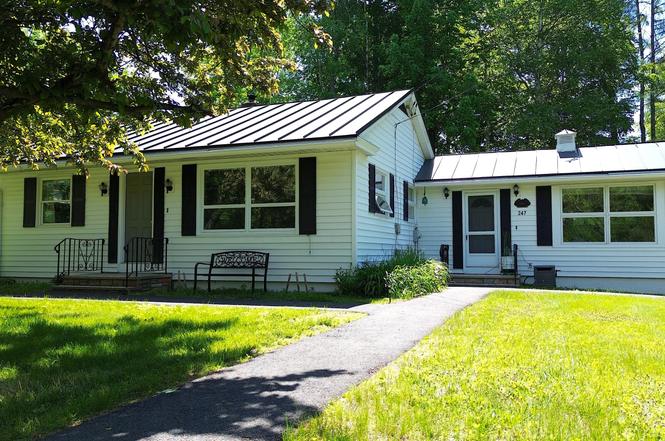
247 Perham St · Farmington, ME
Flood risk 1/10 · Minimal
- FEMA flood zone
- X
- Chance of flooding over 30 yrs
- 0.0%
- Est. flood insurance / yr
- $473 – $860
Fire risk 1/10 · Minimal
- Est. fire insurance / yr
- $669 – $1,243
Heat risk 2/10 · Minimal
- Hot days now (above 90°F)
- 7 days/yr
- Hot days in 30 yrs
- 15 days/yr
Wind risk 4/10 · Minor
- Chance of severe wind over 30 yrs
- 9.0%
Air-quality risk 2/10 · Minimal
- Unhealthy air days now
- 1 days/yr
- Unhealthy air days in 30 yrs
- 1 days/yr
Risk factors via First Street. Map © Google.
Why this score? — see what drove the D+ grade
The composite is a weighted blend of 9 inputs, each scored 0–100. Each bar is that input's sub-score; the figure is the points it added to the 100-point composite (weight × sub-score).
- Cash flow +13.7/30.0
- Appreciation +10.0/10.0
- Schools +6.7/10.0
- DSCR +4.2/10.0
- Livability +4.0/5.0
- 1% rule +3.1/10.0
- Rent growth +2.5/5.0
- Condition / age +2.5/5.0
- ARV discount +0.0/15.0
$309,000
🖨 Deal sheet 📄 Offer letter ✓ Due diligence
Listing remarks MLS
Don't lift a finger, this is already the perfect retirement home! Carpeted garage (yes really) to the basement den & fantastic living room. All the updates are complete. Beautiful private back lawn can be enjoyed from the screened porch, open concept kitchen, dining, living room for a nice flow. Walk to downtown and UMF.
Key facts
- Attached garage
- Finished bonus room
- Private backyard
Tags
Property features AI
Exterior
- Parking: Attached 2-car garage with auto door opener and direct entry to the home; Additional detached vehicle storage; Paved parking with room for 5–10 spaces
- Utilities: Public water; Public sewer; Circuit breaker electrical service; Utilities currently on
- Home design: Single family residence; Built in 1958
- Construction: Wood frame with vinyl siding; Block foundation; Metal roof
- Exterior features: Front porch; Level lot, intown location near shopping with sidewalks; Paved road
Interior
- Kitchen: Electric range; Refrigerator
- Bedrooms: Primary bedroom on the first floor; Additional bedroom on the first floor
- Flooring: Carpet; Vinyl
- Bathrooms: One full bathroom; One half bathroom
- Heating & cooling: Baseboard hot water heating; Electric water heater
- Interior features: First-floor bedroom; Bathtub; Finished full basement with walk-out access and interior entry; 7 total rooms
- Laundry & utility: Washer; Dryer; Laundry room in basement
Neighborhood map
What this means for you Summary
Snapshot
- This is a 2-bed/1.0-bath single-family listed at $309k.
Deal economics
- At list price, monthly cash flow is $24 ($293/yr) — positive.
- The deal already cash-flows at list — no discount required.
- To meet the 1% rule (rent ≥ 1% of price), the offer needs to be $250k (19.1% below list).
- Recommended offer: $250k (19.1% below list) — sets the bar for 1% rule.
- Cap rate 6.4% vs local median 4.8% in Farmington — top-decile yield for the area; either an underpriced asset or a hidden risk that comps aren't pricing in. Stress-test before assuming the spread holds.
Location & tenants
- Location reads 80/100 on livability (#18 in ME, #1,653 nationally) — a professional / high-income tenant draw. Strengths: cost of living A+, health & safety A+, crime A-; Watch: schools D, employment D-.
- RSU 09 (rural): math 78% / reading 82% proficiency, ranked #88 of 112 in ME (top 79%) — strong family-tenant draw, lease renewals of 3-5y typical.
- Market conditions: 90 active listings in the ZIP; 1 comparable units currently listed for rent nearby; 164 units permitted in Franklin County in 2024 (0 in 5+ unit buildings).
Forward outlook
- In year one you build about $33k of equity ($2k loan paydown + $31k appreciation (10.0% local appreciation)).
- Franklin County population projected at -21% by 2050 — secular population decline; favor cash flow + early exit over multi-decade hold.
- At projected returns (10.0% appreciation + 3.0% rent growth), your $87k cash investment doubles in ~3 years — after that, you're playing with house money.
- By year 2, paydown + projected appreciation supports a ~$53k cash-out refi (75% LTV) — recoverable capital for the next deal without selling this one.
Negotiation context
- Only 4 days on market — expect competitive offers; lowballing is unlikely to land.
- 2 sale attempts since 11y ago with the ask held roughly flat each time — persistent listings suggest the price (not the market) is what's stuck; bring a comps-based counter.
- Current owner paid $120k; list at $309k implies a 158% gain — meaningful room to come down on a strong offer.
Risks & watch-outs
- Watch-outs: built in 1958 — expect roof / HVAC / electrical / plumbing capex.
Questions for the listing agent
- Built in 1958 — when were the roof, HVAC, electrical panel, plumbing, and water heater last replaced?
- Is there a deadline driving the sale (1031 exchange, divorce, estate, relocation)? That informs how much negotiation room exists.
- Schools are D-rated, which usually means shorter tenancies and higher turnover. Who's the typical renter profile here, and what's been the actual vacancy rate?
- The area grade is low — what's the realistic commute time and amenity access for the typical tenant pool here? Any planned neighborhood developments (good or bad) we should know about?
- What's the average days-on-market for RENTAL listings here right now (not sales)? A rising rental-DOM trend means longer vacancies and softer asking-rent achievability than the comps imply.
- What's the recent tenant-quality profile in this submarket — average credit score on applications, eviction rate, late-payment / NSF rate, and stable-employment percentage? A property-management company in the area should have these aggregated.
- How much new for-sale + rental construction is in the pipeline within 1–3 miles? Heavy new supply typically softens prices + rents 12–24 months out; constrained supply supports both.
Investment metrics
- 1% rule
- 0.81% ✗
- Cap rate
- 6.39%
- Cash-on-cash
- 0.34%
- DSCR
- 1.02
- GRM
- 10.3
CMA / ARV
- ARV (on-the-fly)
- $259,760
- Comps found
- 9
Show comp detail 9 sales within ~0.75 mi
| Address | Dist | Beds/Ba | Sqft | Sold | Price | $/sf | Match |
|---|---|---|---|---|---|---|---|
| 238 Middle St | 0.06mi | 3/1.0 (+1) | 1,310 (-4%) | 2mo | $304,000 | $232 | 85 |
| 116 Birchwood Ln | 0.24mi | 2/2.0 | 1,422 (+5%) | 6mo | $338,500 | $238 | 72 |
| 120 Eastmont Sq | 0.32mi | 3/2.0 (+1) | 1,344 (-1%) | 23mo | $308,000 | $229 | 55 |
| 158 Court St | 0.44mi | 2/2.0 | 1,255 (-8%) | 21mo | $226,000 | $180 | 45 |
| 132 Lake Ave | 0.60mi | 3/1.0 (+1) | 1,473 (+8%) | 11mo | $275,000 | $187 | 44 |
| 121 Spruce Ln | 0.72mi | 3/1.0 (+1) | 1,260 (-7%) | 7mo | $230,000 | $183 | 44 |
| 128 Lake Ave | 0.62mi | 3/1.5 (+1) | 1,482 (+9%) | 12mo | $360,000 | $243 | 39 |
| 160 Perham St | 0.42mi | 3/1.0 (+1) | 1,530 (+12%) | 23mo | $280,000 | $183 | 36 |
| 105 Highland Ave | 0.61mi | 2/1.0 | 1,190 (-12%) | 19mo | $227,000 | $191 | 35 |
Match score weights: distance 35% · size 25% · config 20% · recency 20%. Top-matched comps best support the ARV.
Projected returns pro-forma
10.0% appreciation · 3.0% rent growth · sell at horizon
- IRR
- 24.5%
- Equity multiple
- 2.96×
- Total profit
- $169,768
- Equity at exit
- $278,372
- IRR
- 21.7%
- Equity multiple
- 6.76×
- Total profit
- $498,566
- Equity at exit
- $600,319
Cash invested: $86,520 (down + closing). Projections, not guarantees.
Landlord ↔ Tenant lean methodology
- Overall (STATE)
- 41 Moderately Tenant-Leaning
- State Maine
- 41 Moderately Tenant-Leaning · D+2
- County
- — inherits STATE
- City
- — inherits STATE
ZIP-level market 04938
- Home prices YoY
- 6.4%
- Active inventory
- 90
- Price-to-rent
- 10.3×
Monthly cashflow live
- Estimated rent
- $2,500 medium interval (Pro) →
- Mortgage (P&I)
- −$1,620
- Tax from tax record
- −$201 /mo · $2,417/yr
- Insurance
- −$129
- HOA
- −$0
- Vacancy / Maint / Mgmt
- −$525
- Net cashflow
- $24
Break-even live
UW: 25.0% down · 7.5% · 30yr · 1.5% tax · 5.0% vac · 8.0% maint · 8.0% mgmt
Financing live
Cash to close
- Down payment
- $77,250
- Closing costs
- $9,270
- Reserves months
- —
- Total cash needed
- —
Loan-product check · same deal, 3 products live
Conventional
25% down · 7.5% · 30yr
- Down + closing
- —
- Monthly P&I
- —
- Monthly cashflow
- —
- DSCR
- —
- Eligible?
- —
Personal DTI + credit; lowest rate.
DSCR
20% down · 8.5% · 30yr
- Down + closing
- —
- Monthly P&I
- —
- Monthly cashflow
- —
- DSCR
- —
- Eligible?
- —
No personal income docs; deal must DSCR.
Hard money
10% down · 12.0% · 12mo
- Down + closing
- —
- Monthly P&I
- —
- Monthly cashflow
- —
- DSCR
- —
- Eligible?
- —
Short-term bridge; refi at stabilization.
Rent comps 1 comps
| Address | Beds | Baths | Sqft | Rent | $/sqft | DOM | Units | Dist |
|---|---|---|---|---|---|---|---|---|
| 114 Perham St Unit 114 Perham St, 2nd Fl Farmington, ME | 2.0 | 1.0 | 1500 | $2,500 | $1.67 | 43d | 1 | 0.65mi |
Listing history 5 events
-
2026-06-18days on market $309,000 Active 4 DOM
-
2026-06-17days on market $309,000 Active 3 DOM
-
2026-06-16days on market $309,000 Active 2 DOM
-
2026-06-15remarks 699-char remark
-
2026-06-15$309,000 Active 1 DOM
ⓘ Source: listings_history table (triggers on properties + properties_extension) + one-shot
backfill from property_details.listing_events for pre-trigger history.
Tax reassessment forecast ME · Partial reset (capped growth)
- Current annual tax
- $2,417 · $201/mo
- Projected year-2 tax
- $3,310 · $276/mo
- Expected delta
- +$893/yr (+$74/mo · 36.9%)
ⓘ Screening estimate from a state-policy table — verify with the county assessor before closing.
Climate risk First Street
- Flood 1/10 Low FEMA zone X · 0% chance over 30 yrs
- Wildfire 1/10 Low
- Heat 2/10 Low 7 d/yr ≥90°F today · 15 d/yr by 30 yrs out
- Wind 4/10 Moderate 9% chance of damaging wind over 30 yrs
- Air quality 2/10 Low 1 unhealthy d/yr today · 1 by 30 yrs out
Nearby sold comps map
Loading sold comps map…
Walkable amenities ~0.75 mi
Loading nearby amenities…
Taxation est. · year 1
- Rental income
- $30,000
- − Mortgage interest
- −$17,309
- − Property taxes
- −$2,417
- − Insurance
- −$1,545
- − Repairs & maintenance
- −$2,400
- − Management
- −$2,400
- − Depreciation
- −$8,989
- Taxable loss
- −$5,060
- Est. tax savings @ 24.0%
- +$1,214
- After-tax cash flow
- $1,507/yr
For passive investors: Depreciation is non-cash, so a rental often shows a tax loss while cash-flowing — sheltering income. Rental losses are passive: they offset passive income freely, and up to $25,000/yr can offset ordinary (W-2) income if you actively participate and your MAGI is under $100k (phasing out to $0 by $150k); unused losses carry forward. On sale, claimed depreciation is recaptured at up to 25%, and gains may owe capital-gains tax (a 1031 exchange can defer both). Figures are a year-1 estimate at your 24.0% rate — not tax advice; consult a CPA.
Schools (NCES district)
- District
- RSU 09
- NCES district ID
- 2314809
- Math proficiency
- 78% ▲ 48.00%
- Reading proficiency
- 82% ▲ 31.00%
- Median HH income
- $40,202
- Composite
- 66.71/100
- National rank
- #409
- State rank
- #88 of 112 in ME
Livability — Farmington
- Score
- 80/100
- State rank
- #18
- US rank
- #1653
Category grades
Schools grade is shown separately in the Schools card above.
Census & demographics
- Census place
- Farmington, ME
- Population (ZIP)
- 10,368
Population outlook (Franklin County) Hauer SSP2
- Today (2025)
- 28,948 people
- By 2030
- 27,889 · -3.7%
- By 2040
- 25,275 · -12.7%
- By 2050
- 22,770 · -21.3%
- By 2075
- 18,980 · -34.4%
- By 2100
- 16,816 · -41.9%
Race, ethnicity, and origin ACS 2023
- Neighborhood character
- Predominantly White (93%)
- Race & ethnicity
- White 93% Two or more races 4% Hispanic / Latino 2%
- Common ancestry
- Lithuanian 11% Italian 3% Slovak 2%
- Foreign-born
- 4% · Canada
- Languages at home
- 98% English-only · French/Haitian/Cajun 1%
Political lean MEDSL · Franklin
- 2024 margin
- Lean R (+8.2) · D 44.8% · R 53.0% · Other 2.2%
- 2008→2024 swing
- -28.5pp toward R · 2008: 20.3pp · 2024: -8.2pp
- All cycles
- 2024: R+8.2 2020: R+3.9 2016: R+5.5 2012: D+18.5 2008: D+20.3
Not yet ingested
- Civics
- —
Market trends
- HPI YoY
- ▲ 19.53%
- Current HPI
- 325.7666
- Rent YoY
- —
- Metro
- —
- State GDP YoY
- —
- F500 in state
- 0
Price history
+168.7% since first listed7 events — show timeline
- 2026-06-14 Listed $309,000 MREIS
- 2015-09-17 Sold (MLS) $120,000 MREIS
- 2015-08-25 Delisted — MREIS
- 2015-08-17 Price Changed $125,000 MREIS
- 2015-08-12 Price Changed $144,900 MREIS
- 2015-06-18 Listed $149,900 MREIS
- 2013-09-12 Sold (MLS) $115,000 MREIS
Property tax history
+1.4%/yrLatest (2025): $2,417 · -6.2% YoY. Source: county tax records.
Cash-flow waterfall
monthlySold comps — $/sqft
last 12 mo · ≤1 miLoading sold comps…