 🏷️ Likely Rental
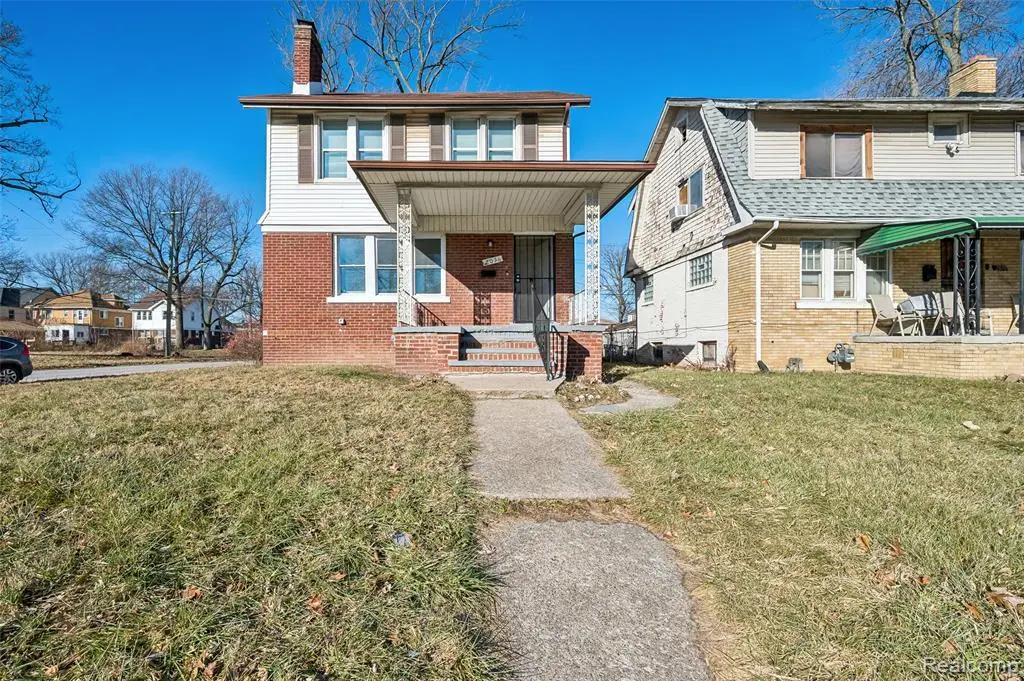
2076 Collingwood St · Detroit, MI
Flood risk 1/10 · Minimal
- FEMA flood zone
- X (unshaded)
- Chance of flooding over 30 yrs
- 0.0%
- Est. flood insurance / yr
- $473 – $860
Fire risk 1/10 · Minimal
- Est. fire insurance / yr
- $784 – $1,456
Heat risk 3/10 · Minor
- Hot days now (above 97°F)
- 7 days/yr
- Hot days in 30 yrs
- 15 days/yr
Wind risk 2/10 · Minimal
- Chance of severe wind over 30 yrs
- —
Air-quality risk 4/10 · Minor
- Unhealthy air days now
- 4 days/yr
- Unhealthy air days in 30 yrs
- 6 days/yr
Risk factors via First Street. Map © Google.
Why this score? — see what drove the C grade
The composite is a weighted blend of 9 inputs, each scored 0–100. Each bar is that input's sub-score; the figure is the points it added to the 100-point composite (weight × sub-score).
- Cash flow +23.2/30.0
- DSCR +7.5/10.0
- ARV discount +7.5/15.0
- 1% rule +7.4/10.0
- Rent growth +3.8/5.0
- Livability +3.7/5.0
- Condition / age +2.5/5.0
- Schools +1.3/10.0
- Appreciation +0.0/10.0
$124,999
🖨 Deal sheet 📄 Offer letter ✓ Due diligence
Listing remarks MLS
?? TURNKEY CASH-FLOWING INVESTMENT OPPORTUNITY – TENANT OCCUPIED & PRODUCING INCOME! Welcome to 2076 Collingwood, Detroit, MI - a well-maintained, tenant-occupied colonial offering immediate cash flow and strong investment potential from day one. Whether you're a seasoned investor looking to expand your portfolio or a first-time investor seeking a performing rental property, this opportunity delivers both income and long-term upside. Currently generating $1,400 per month ($16,800 annually) with a tenant already in place, this property offers an attractive return while minimizing vacancy concerns. Step inside to find a spacious layout featuring 4 generously sized bedrooms, a large living room, formal dining room, and a versatile bonus room that can be utilized as a home office, playroom, study, or additional sleeping area. A bright four-seasons room provides extra living space and added appeal for tenants. The home also features fresh paint, brand-new carpet, a functional kitchen with dedicated pantry storage, and a full unfinished basement offering additional storage and future value-add potential. Located in a high-demand rental area with strong tenant demand and convenient access to schools, shopping, dining, major roadways, and public transportation, this property is positioned for continued performance and appreciation. Investor Highlights: Tenant Occupied – Immediate Income $1,400 Monthly Rent / $16,800 Annual Income Strong Cash Flow Opportunity 4 Bedrooms + Bonus Flex Room Four-Seasons Room Fresh Paint & New Carpet Full Basement Ideal for Buy-and-Hold Investors, DSCR Financing, and Portfolio Expansion Opportunities like this are becoming increasingly difficult to find. Add a performing, income-producing asset to your portfolio and start collecting rent from day one. Schedule your showing today!
Key facts
- Functional kitchen
- Four seasons room
- Spacious layout
Tags
Property features AI
Finance
- Financial info: Annual tax amount listed
Exterior
- Parking: Detached 2-car garage
- Utilities: Public water; Public sewer
- Home design: Single-family residence; Two levels; Ground-level entry with steps; Brick construction
- Construction: Brick exterior; Block foundation; Asphalt roof; Built with two levels
- Exterior features: Paved road frontage; Asphalt roof; Lot approximately 0.11 acres (37.5 x 122); No pool
Interior
- Bathrooms: One full bathroom
- Heating & cooling: Forced air heating (natural gas); No central cooling
- Interior features: Full, unfinished basement
Neighborhood map
What this means for you Summary
Snapshot
- This is a 4-bed/1.5-bath single-family listed at $125k.
Deal economics
- At list price, monthly cash flow is $227 ($3k/yr) — positive.
- The deal already cash-flows at list — no discount required.
- Meets the 1% rule at list price ($2k rent vs $125k).
Location & tenants
- Location reads 73/100 on livability (#218 in MI) — a middle-class / working-renter tenant base. Strengths: amenities A+, commute A+, cost of living A+; Watch: schools F, crime F, employment F.
- Detroit Public Schools Community District (urban): math 10% / reading 24% proficiency, ranked #499 of 540 in MI (top 92%) — low school quality limits family demand, transient renter base, plan for 1-2y turnover; 90% free/reduced lunch — lower-income household profile, screen leases tightly.
- Market conditions: Rents rising fast (+5.2%/yr); 271 active listings in the ZIP; 40 comparable units currently listed for rent nearby; rentals at typical pace (median 20d on market — plan ~3-4 weeks tenant-placement turnaround); 2,639 units permitted in Wayne County in 2024 (1,216 in 5+ unit buildings).
- This rent runs 41% of the median local income ($45k/yr) — at the standard rent-burdened threshold; future hikes will face affordability resistance.
Forward outlook
- Local home prices are declining (-3.0%/yr); year-one equity from $864 of loan paydown is wiped out by about $4k of value loss. Plan a longer hold.
- Wayne County population projected at -17% by 2050 — secular population decline; favor cash flow + early exit over multi-decade hold.
- At projected returns (-3.0% appreciation + 5.2% rent growth), your $35k cash investment doubles in ~10 years — after that, you're playing with house money.
Negotiation context
- Only 8 days on market — expect competitive offers; lowballing is unlikely to land.
- 10 sale attempts since 14y ago with the ask held roughly flat each time — persistent listings suggest the price (not the market) is what's stuck; bring a comps-based counter.
- Current owner paid $90k; 39% above their basis — modest negotiation headroom, anchor on the comps not their cost.
Risks & watch-outs
- Watch-outs: property tax is 2.8% of price; built in 1921 — expect roof / HVAC / electrical / plumbing capex.
Questions for the listing agent
- Built in 1921 — when were the roof, HVAC, electrical panel, plumbing, and water heater last replaced?
- Property tax is high relative to price — has the assessment been appealed recently, and will the sale trigger a re-assessment?
- Is there a deadline driving the sale (1031 exchange, divorce, estate, relocation)? That informs how much negotiation room exists.
- Schools are F-rated, which usually means shorter tenancies and higher turnover. Who's the typical renter profile here, and what's been the actual vacancy rate?
- Crime grade is F in this area — have there been break-ins, vandalism, or insurance claims at this property in the last 3 years? What carrier currently insures it and at what premium?
- What's the average days-on-market for RENTAL listings here right now (not sales)? A rising rental-DOM trend means longer vacancies and softer asking-rent achievability than the comps imply.
- What's the recent tenant-quality profile in this submarket — average credit score on applications, eviction rate, late-payment / NSF rate, and stable-employment percentage? A property-management company in the area should have these aggregated.
- How much new for-sale + rental construction is in the pipeline within 1–3 miles? Heavy new supply typically softens prices + rents 12–24 months out; constrained supply supports both.
Investment metrics
- 1% rule
- 1.24% ✓
- Cap rate
- 8.48%
- Cash-on-cash
- 7.80%
- DSCR
- 1.35
- GRM
- 6.7
CMA / ARV
- ARV (median comp)
- $270,427
- List price
- $124,999
- Delta
- -53.78%
- Verdict
- UNDERPRICED
- Comps
- 20 within 1.0 mi
Show comp detail 12 sales within ~0.75 mi
| Address | Dist | Beds/Ba | Sqft | Sold | Price | $/sf | Match |
|---|---|---|---|---|---|---|---|
| 2064 Glynn Ct | 0.12mi | 4/1.5 | 1,624 (-2%) | 4mo | $118,556 | $73 | 88 |
| 2050 Atkinson St | 0.50mi | 4/1.5 | 1,624 (-2%) | 8mo | $75,000 | $46 | 68 |
| 2704 Burlingame St | 0.46mi | 3/1.5 (-1) | 1,618 (-2%) | 6mo | $119,000 | $74 | 66 |
| 2405 Sturtevant St | 0.57mi | 3/1.5 (-1) | 1,636 (-1%) | 3mo | $45,000 | $28 | 64 |
| 3275 Collingwood St | 0.73mi | 4/1.5 | 1,600 (-3%) | 2mo | $64,000 | $40 | 60 |
| 2437 Longfellow St | 0.45mi | 4/1.5 | 1,841 (+12%) | 2mo | $135,000 | $73 | 58 |
| 2220 Webb St | 0.19mi | 4/2.5 | 1,848 (+12%) | 12mo | $130,000 | $70 | 57 |
| 929 Lawrence St | 0.72mi | 3/1.5 (-1) | 1,692 (+2%) | 9mo | $205,000 | $121 | 50 |
| 940 Burlingame St | 0.72mi | 3/1.0 (-1) | 1,644 (-0%) | 14mo | $71,000 | $43 | 48 |
| 1981 Leslie St | 0.68mi | 3/1.5 (-1) | 1,518 (-8%) | 13mo | $50,000 | $33 | 39 |
| 3040 Burlingame St | 0.65mi | 3/2.5 (-1) | 1,778 (+8%) | 12mo | $275,000 | $155 | 38 |
| 936 Glynn Ct | 0.72mi | 4/3.0 | 1,874 (+14%) | 10mo | $285,000 | $152 | 29 |
Match score weights: distance 35% · size 25% · config 20% · recency 20%. Top-matched comps best support the ARV.
Projected returns pro-forma
-3.0% appreciation · 5.2% rent growth · sell at horizon
- IRR
- -1.6%
- Equity multiple
- 0.94×
- Total profit
- $-2,154
- Equity at exit
- $18,638
- IRR
- 10.6%
- Equity multiple
- 1.92×
- Total profit
- $32,277
- Equity at exit
- $10,808
Cash invested: $35,000 (down + closing). Projections, not guarantees.
Landlord ↔ Tenant lean methodology
- Overall (STATE)
- 62 Landlord-Friendly
- State Michigan
- 62 Landlord-Friendly · EVEN
- County
- — inherits STATE
- City
- — inherits STATE
ZIP-level market 48206
- Rents YoY
- 5.2%
- Active inventory
- 271
- Price-to-rent
- 6.7×
Monthly cashflow live
- Estimated rent
- $1,552 high interval (Pro) →
- Mortgage (P&I)
- −$656
- Tax from tax record
- −$291 /mo · $3,493/yr
- Insurance
- −$52
- HOA
- −$0
- Vacancy / Maint / Mgmt
- −$326
- Net cashflow
- $227
Break-even live
UW: 25.0% down · 7.5% · 30yr · 1.5% tax · 5.0% vac · 8.0% maint · 8.0% mgmt
Financing live
Cash to close
- Down payment
- $31,250
- Closing costs
- $3,750
- Reserves months
- —
- Total cash needed
- —
Loan-product check · same deal, 3 products live
Conventional
25% down · 7.5% · 30yr
- Down + closing
- —
- Monthly P&I
- —
- Monthly cashflow
- —
- DSCR
- —
- Eligible?
- —
Personal DTI + credit; lowest rate.
DSCR
20% down · 8.5% · 30yr
- Down + closing
- —
- Monthly P&I
- —
- Monthly cashflow
- —
- DSCR
- —
- Eligible?
- —
No personal income docs; deal must DSCR.
Hard money
10% down · 12.0% · 12mo
- Down + closing
- —
- Monthly P&I
- —
- Monthly cashflow
- —
- DSCR
- —
- Eligible?
- —
Short-term bridge; refi at stabilization.
Rent comps 40 comps
| Address | Beds | Baths | Sqft | Rent | $/sqft | DOM | Units | Dist |
|---|---|---|---|---|---|---|---|---|
| 1929 Calvert Ave Unit 2 Detroit, MI | 3.0 | 1.0 | 1414 | $1,199 | $0.85 | 15d | 1 | 0.19mi |
| 2634 Lawrence St Detroit, MI | 3.0 | 1.5 | 1388 | $1,600 | $1.15 | 1d | 1 | 0.37mi |
| 2655 Collingwood St Detroit, MI | 4.0 | 1.5 | 1881 | $2,700 | $1.44 | 1d | 1 | 0.39mi |
| 2653 Calvert Ave Unit 1 Detroit, MI | 3.0 | 1.0 | 1305 | $1,200 | $0.92 | 43d | 1 | 0.39mi |
| 9844 Woodrow Wilson St Detroit, MI | 3.0 | 1.0 | 1187 | $1,300 | $1.10 | 12d | 1 | 0.40mi |
| 2727 Calvert Ave Unit 1 Detroit, MI | 3.0 | 1.5 | 1350 | $1,200 | $0.89 | 43d | 1 | 0.46mi |
| 1427 Calvert Ave Detroit, MI | 3.0 | 1.0 | 1100 | $1,850 | $1.68 | 24d | 1 | 0.50mi |
| 1427 Calvert Ave Detroit, MI | 3.0 | 1.0 | 1100 | $1,750 | $1.59 | 43d | 1 | 0.50mi |
| 2925 Calvert St Detroit, MI | 3.0 | 1.0 | 1400 | $1,300 | $0.93 | 16d | 1 | 0.52mi |
| 3031 Lawrence St Detroit, MI | 4.0 | 1.0 | 1700 | $1,600 | $0.94 | 16d | 1 | 0.61mi |
| 2474 Fullerton St Detroit, MI | 3.0 | 1.0 | 1400 | $1,300 | $0.93 | 15d | 1 | 0.65mi |
| 2254 Taylor St Unit Taylor St unit Detroit, MI | 3.0 | 1.0 | 1307 | $1,550 | $1.19 | 3d | 1 | 0.65mi |
| 3224 Calvert St Detroit, MI | 3.0 | 1.0 | 1150 | $1,150 | $1.00 | 43d | 1 | 0.67mi |
| 3226 Calvert Ave Detroit, MI | 3.0 | 1.0 | 1100 | $1,200 | $1.09 | 12d | 1 | 0.68mi |
| 3266 Calvert Ave Fl 2 Detroit, MI | 3.0 | 1.0 | 1279 | $1,300 | $1.02 | 24d | 1 | 0.72mi |
| 2463 Taylor St Detroit, MI | 3.0 | 1.0 | 1350 | $1,100 | $0.81 | 43d | 1 | 0.72mi |
| 2302 Hazelwood St Unit 1 Detroit, MI | 3.0 | 1.0 | 1550 | $1,273 | $0.82 | 24d | 1 | 0.72mi |
| 3322 Webb St Unit 1 Detroit, MI | 3.0 | 1.0 | 1656 | $1,350 | $0.82 | 43d | 1 | 0.78mi |
| 3322 Webb St Unit 2 Detroit, MI | 3.0 | 1.0 | 1656 | $1,350 | $0.82 | 43d | 1 | 0.78mi |
| 3322 Webb St Detroit, MI | 3.0 | 1.0 | 1600 | $1,250 | $0.78 | 16d | 1 | 0.78mi |
| 3422 Edison St Detroit, MI | 3.0 | 1.0 | 1300 | $1,295 | $1.00 | 16d | 1 | 0.86mi |
| 3220 Gladstone St Detroit, MI | 3.0 | 1.0 | 1248 | $1,200 | $0.96 | 43d | 1 | 1.02mi |
| 1926 Clements St Detroit, MI | 3.0 | 1.0 | 1150 | $1,150 | $1.00 | 5d | 1 | 1.03mi |
| 1926 Clements St Unit 1926 Detroit, MI | 3.0 | 1.0 | 1150 | $1,250 | $1.09 | 20d | 1 | 1.03mi |
| 2504 W Euclid St Unit 2506 Detroit, MI | 3.0 | 1.0 | 1475 | $1,675 | $1.14 | 43d | 1 | 1.06mi |
| 2506 W Euclid St Detroit, MI | 3.0 | 1.0 | 1475 | $1,675 | $1.14 | 43d | 1 | 1.06mi |
| 2504 W Euclid St Unit 2504 Detroit, MI | 3.0 | 1.0 | 1475 | $1,650 | $1.12 | 43d | 1 | 1.07mi |
| 41 Richton St Highland Park, MI | 5.0 | 2.0 | 1871 | $1,800 | $0.96 | 1d | 1 | 1.18mi |
| 41 Richton St Highland Park, MI | 5.0 | 2.0 | 1871 | $1,800 | $0.96 | 14d | 1 | 1.18mi |
| 2047 Seward St Detroit, MI | 3.0 | 1.0 | 1421 | $1,523 | $1.07 | 5d | 1 | 1.19mi |
| 3740 Tyler St Unit 1 Detroit, MI | 3.0 | 1.0 | 1300 | $1,300 | $1.00 | 5d | 1 | 1.23mi |
| 1226 Virginia Park St Unit 1226 Virginia Park, Upper V 1/10/26 (T) Detroit, MI | 3.0 | 1.0 | 1100 | $1,200 | $1.09 | 43d | 1 | 1.23mi |
| 3209 W Grand St Detroit, MI | 3.0 | 1.0 | 1550 | $1,103 | $0.71 | 43d | 1 | 1.24mi |
| 3786 Carter St Unit 2 Detroit, MI | 3.0 | 1.0 | 1400 | $1,100 | $0.79 | 24d | 1 | 1.24mi |
| 3259 W Philadelphia St Detroit, MI | 3.0 | 1.0 | 1293 | $1,400 | $1.08 | 16d | 1 | 1.24mi |
| 64 Glendale St Highland Park, MI | 4.0 | 1.0 | 1464 | $1,500 | $1.02 | 10d | 1 | 1.27mi |
| 3757 Blaine St Detroit, MI | 3.0 | 1.0 | 1169 | $1,480 | $1.27 | 16d | 1 | 1.28mi |
| 11704 Broadstreet Ave Detroit, MI | 3.0 | 1.0 | 1200 | $1,050 | $0.88 | 43d | 1 | 1.31mi |
| 3799 W Philadelphia St Detroit, MI | 5.0 | 2.0 | 2200 | $1,650 | $0.75 | 16d | 1 | 1.38mi |
| 7640 Woodrow Wilson St Unit 1 Detroit, MI | 3.0 | 1.5 | 1095 | $1,400 | $1.28 | 43d | 1 | 1.39mi |
Listing history 35 events
-
2026-06-18days on market $124,999 Active 8 DOM
-
2026-06-17days on market $124,999 Active 7 DOM
-
2026-06-16days on market $124,999 Active 6 DOM
-
2026-06-15days on market $124,999 Active 5 DOM
-
2026-06-13days on market $124,999 Active 3 DOM
-
2026-06-13remarks 683-char remark
-
2026-06-13days on market $124,999 Active 2 DOM
-
2026-06-04days on market $124,999 Active 30 DOM
-
2026-06-03days on market $124,999 Active 29 DOM
-
2026-06-02days on market $124,999 Active 28 DOM
-
2026-06-01days on market $124,999 Active 27 DOM
-
2026-05-31days on market $124,999 Active 26 DOM
-
2026-05-05$124,999 Active 1093-char remark
-
2026-05-05$124,999 Active 1123-char remark
-
2026-04-04historical
-
2026-04-04historical
-
2026-02-16price $124,999
-
2026-02-15price $124,999
-
2026-01-05price $129,999
-
2026-01-05price $129,999
-
2025-12-16$134,999 Active
-
2025-12-16$134,999 Active
-
2025-12-12historical
-
2023-06-29historical
-
2023-06-29historical
-
2023-06-06$150,000 Active
-
2023-06-06$150,000 Active
-
2021-09-22soldstatus $90,000
-
2021-09-22soldstatus $130,000
-
2020-07-27soldstatus $90,000
-
2012-03-12soldstatus $14,900
-
2012-03-12soldstatus $14,900
-
2012-02-25historical
-
2012-01-13$14,900
-
2012-01-13$14,900
ⓘ Source: listings_history table (triggers on properties + properties_extension) + one-shot
backfill from property_details.listing_events for pre-trigger history.
Tax reassessment forecast MI · Partial reset (capped growth)
- Current annual tax
- $3,493 · $291/mo
- Projected year-2 tax
- $3,493 · $291/mo
- Expected delta
- $0/yr ($0/mo · 0.0%)
ⓘ Screening estimate from a state-policy table — verify with the county assessor before closing.
Climate risk First Street
- Flood 1/10 Low FEMA zone X (unshaded) · 0% chance over 30 yrs
- Wildfire 1/10 Low
- Heat 3/10 Moderate 7 d/yr ≥97°F today · 15 d/yr by 30 yrs out
- Wind 2/10 Low
- Air quality 4/10 Moderate 4 unhealthy d/yr today · 6 by 30 yrs out
Nearby sold comps map
Loading sold comps map…
Walkable amenities ~0.75 mi
Loading nearby amenities…
Taxation est. · year 1
- Rental income
- $18,625
- − Mortgage interest
- −$7,002
- − Property taxes
- −$3,493
- − Insurance
- −$625
- − Repairs & maintenance
- −$1,490
- − Management
- −$1,490
- − Depreciation
- −$3,636
- Taxable income
- $888
- Est. tax owed @ 24.0%
- −$213
- After-tax cash flow
- $2,516/yr
For passive investors: Depreciation is non-cash, so a rental often shows a tax loss while cash-flowing — sheltering income. Rental losses are passive: they offset passive income freely, and up to $25,000/yr can offset ordinary (W-2) income if you actively participate and your MAGI is under $100k (phasing out to $0 by $150k); unused losses carry forward. On sale, claimed depreciation is recaptured at up to 25%, and gains may owe capital-gains tax (a 1031 exchange can defer both). Figures are a year-1 estimate at your 24.0% rate — not tax advice; consult a CPA.
Schools (NCES district)
- District
- Detroit Public Schools Community District
- NCES district ID
- 2601103
- Math proficiency
- 10% ▼ -2.00%
- Reading proficiency
- 24% ▲ 6.00%
- Median HH income
- $25,815
- Composite
- 13.06/100
- National rank
- #9564
- State rank
- #499 of 540 in MI
Livability — Detroit
- Score
- 73/100
- State rank
- #218
- US rank
- #5427
Category grades
Schools grade is shown separately in the Schools card above.
Census & demographics
- Census place
- Detroit, MI
- County
- Wayne County · 1,562,939 people
- City population
- 572,865
- Metro
- Detroit-Warren-Dearborn, MI
- Population (ZIP)
- 15,227
- Household income
- $45,046
- Rent vs Own
- Severe rent burden
- 646.0
Population outlook (Wayne County) Hauer SSP2
- Today (2025)
- 1,675,273 people
- By 2030
- 1,620,300 · -3.3%
- By 2040
- 1,502,341 · -10.3%
- By 2050
- 1,384,039 · -17.4%
- By 2075
- 1,124,592 · -32.9%
- By 2100
- 881,193 · -47.4%
Race, ethnicity, and origin ACS 2023
- Neighborhood character
- Predominantly Black (81%)
- Race & ethnicity
- Black 81% White 12% Two or more races 5% Hispanic / Latino 3%
- Common ancestry
- Iranian 3% Romanian 1% Slovak 1%
- Foreign-born
- 4% · Canada
- Languages at home
- 94% English-only · Spanish 4% Other Indo-European 1%
Political lean MEDSL · Wayne
- 2024 margin
- Strong D (+29.0) · D 62.7% · R 33.7% · Other 3.6%
- 2008→2024 swing
- -20.5pp toward R · 2008: 49.5pp · 2024: 29.0pp
- All cycles
- 2024: D+29.0 2020: D+38.1 2016: D+37.3 2012: D+46.9 2008: D+49.5
Not yet ingested
- Civics
- —
Market trends
- HPI YoY
- ▼ -139.60%
- Current HPI
- 130.9545
- Rent YoY
- ▲ 5.20%
- Metro
- Detroit-Warren-Dearborn, MI
- State GDP YoY
- ▲ 1.37%
- F500 in state
- 28
Industry mix (Fortune 500 HQ in MI)
| Industry | F500 HQs | Revenue |
|---|---|---|
| Automotive Parts | 3 | $48B |
|
||
| Automotive | 2 | $372B |
|
||
| Chemicals | 1 | $45B |
|
||
| Automotive Retail | 1 | $29B |
|
||
| Healthcare / Medical Devices | 1 | $23B |
|
||
| Automotive Technology | 1 | $20B |
|
||
Price history
+738.9% since first listed27 events — show timeline
- 2026-06-11 Listed $124,999 REALCOMP
- 2026-06-10 Listed $124,999 MiRealSource-MiMLS
- 2026-06-05 Listing Removed — REALCOMP
- 2026-06-05 Listing Removed — MiRealSource-MiMLS
- 2026-05-05 Listed $124,999 REALCOMP
- 2026-05-05 Listed $124,999 MiRealSource-MiMLS
- 2026-04-04 Listing Removed — MiRealSource-MiMLS
- 2026-04-04 Listing Removed — REALCOMP
- 2026-02-16 Price Changed $124,999 MiRealSource-MiMLS
- 2026-02-15 Price Changed $124,999 REALCOMP
- 2026-01-05 Price Changed $129,999 MiRealSource-MiMLS
- 2026-01-05 Price Changed $129,999 REALCOMP
- 2025-12-16 Listed $134,999 MiRealSource-MiMLS
- 2025-12-16 Listed $134,999 REALCOMP
- 2025-12-12 Coming Soon — MiRealSource-MiMLS
- 2023-06-29 Listing Removed — MiRealSource-MiMLS
- 2023-06-29 Listing Removed — REALCOMP
- 2023-06-06 Listed $150,000 MiRealSource-MiMLS
- 2023-06-06 Listed $150,000 REALCOMP
- 2021-09-22 Sold (Public Records) $130,000 Public Records
- 2021-09-22 Sold (Public Records) $90,000 Public Records
- 2020-07-27 Sold (Public Records) $90,000 Public Records
- 2012-03-12 Sold (MLS) $14,900 REALCOMP
- 2012-03-12 Sold (MLS) $14,900 MiRealSource-MiMLS
- 2012-02-25 Listing Removed — REALCOMP
- 2012-01-13 Listed $14,900 REALCOMP
- 2012-01-13 Listed $14,900 MiRealSource-MiMLS
Property tax history
+6.0%/yrLatest (2025): $3,493 · +98.5% YoY. Source: county tax records.
Cash-flow waterfall
monthlySold comps — $/sqft
last 12 mo · ≤1 miLoading sold comps…