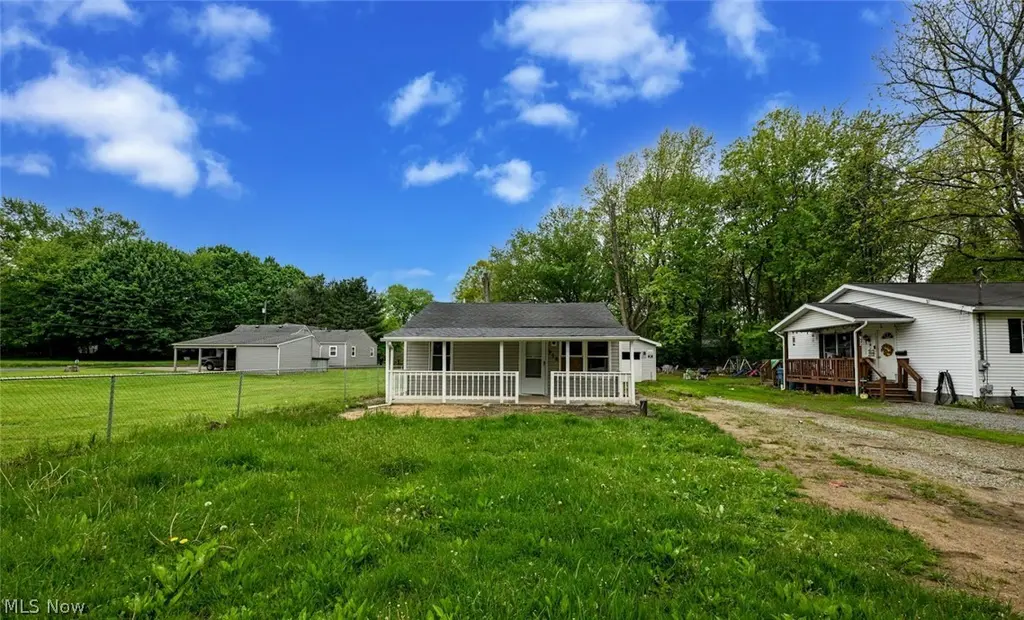
916 Abington Rd · Sawyerwood, OH
Flood risk 1/10 · Minimal
- FEMA flood zone
- X (unshaded)
- Chance of flooding over 30 yrs
- 0.0%
- Est. flood insurance / yr
- $507 – $1,088
Fire risk 1/10 · Minimal
- Est. fire insurance / yr
- $713 – $1,323
Heat risk 3/10 · Minor
- Hot days now (above 97°F)
- 7 days/yr
- Hot days in 30 yrs
- 16 days/yr
Wind risk 1/10 · Minimal
- Chance of severe wind over 30 yrs
- —
Air-quality risk 2/10 · Minimal
- Unhealthy air days now
- 1 days/yr
- Unhealthy air days in 30 yrs
- 2 days/yr
Risk factors via First Street. Map © Google.
Why this score? — see what drove the B- grade
The composite is a weighted blend of 9 inputs, each scored 0–100. Each bar is that input's sub-score; the figure is the points it added to the 100-point composite (weight × sub-score).
- Cash flow +25.4/30.0
- ARV discount +15.0/15.0
- DSCR +8.4/10.0
- 1% rule +6.8/10.0
- Schools +3.7/10.0
- Livability +3.7/5.0
- Rent growth +2.5/5.0
- Condition / age +2.5/5.0
- Appreciation +0.0/10.0
$119,000
🖨 Deal sheet 📄 Offer letter ✓ Due diligence
Listing remarks
Charming 3-Bedroom Ranch in the Heart of Springfield Township. Welcome home to this remodeled 3 bedroom, 1 bath ranch offering 1,204 sq ft of comfortable, single-floor living. Nestled on a peaceful street in Springfield Township, this property blends convenience, simplicity, and value. Step inside to a bright, welcoming layout with plenty of natural light and room to make the space your own. The home features brand-new central air and a new furnace, giving you peace of mind and year-round comfort from day one. Outside, you’ll find a spacious yard perfect for gardening, pets, or outdoor gatherings, along with a classic front porch that adds charm and curb appeal. Whether you're a first
Key facts
- Spacious yard
- New furnace
- Remodeled ranch
Tags
Property features AI
Exterior
- Parking: Driveway; Attached or detached 1-car garage
- Utilities: Well water; Septic tank
- Home design: Single-story home; Above-grade living area approximately 1,205 finished square feet; Year built per public records
- Construction: Vinyl siding; Asphalt/fiberglass roof; Block foundation
- Exterior features: Front porch
Interior
- Kitchen: Range; Refrigerator
- Bedrooms: Three main-level bedrooms (all on the first floor)
- Bathrooms: One full bathroom (main level)
- Heating & cooling: Forced-air heating; Central air conditioning
- Interior features: Five total rooms
- Laundry & utility: In-unit laundry
Neighborhood map
What this means for you Summary
Snapshot
- This is a 2-bed/1.0-bath single-family listed at $119k.
Deal economics
- At list price, monthly cash flow is $276 ($3k/yr) — positive.
- The deal already cash-flows at list — no discount required.
- Meets the 1% rule at list price ($1k rent vs $119k).
- Recommended offer: $115k (3.0% below list) — sets the bar for market timing.
Location & tenants
- Location reads 74/100 on livability (#277 in OH, #4,562 nationally) — a middle-class / working-renter tenant base. Strengths: cost of living A+, health & safety A+, crime A; Watch: amenities D+, schools F, commute F.
- Springfield Local (suburban): math 40% / reading 46% proficiency, ranked #512 of 656 in OH (top 78%) — families likely to look elsewhere, expect single-tenant / working-renter base with shorter leases.
- Market conditions: 137 active listings in the ZIP; 5 comparable units currently listed for rent nearby; rentals at typical pace (median 14d on market — plan ~3-4 weeks tenant-placement turnaround); 1,114 units permitted in Summit County in 2024 (397 in 5+ unit buildings).
Forward outlook
- Local home prices are declining (-3.0%/yr); year-one equity from $823 of loan paydown is wiped out by about $4k of value loss. Plan a longer hold.
- Summit County population projected to shrink 6% by 2050 — rents likely to lag national; underwrite the cash flow, not the appreciation.
Negotiation context
- It's been on market 38 days — a 3% lower offer ($115k) is reasonable based on typical stale-listing flexibility.
- Current owner paid $50k; list at $119k implies a 138% gain — meaningful room to come down on a strong offer.
Risks & watch-outs
- Watch-outs: built in 1954 — expect roof / HVAC / electrical / plumbing capex.
Questions for the listing agent
- It's been on market 38 days. Have you received any prior offers? Is the seller open to a 3% concession, seller financing, or rate buy-down credit?
- Built in 1954 — when were the roof, HVAC, electrical panel, plumbing, and water heater last replaced?
- Is there a deadline driving the sale (1031 exchange, divorce, estate, relocation)? That informs how much negotiation room exists.
- Schools are F-rated, which usually means shorter tenancies and higher turnover. Who's the typical renter profile here, and what's been the actual vacancy rate?
- What's the average days-on-market for RENTAL listings here right now (not sales)? A rising rental-DOM trend means longer vacancies and softer asking-rent achievability than the comps imply.
- What's the recent tenant-quality profile in this submarket — average credit score on applications, eviction rate, late-payment / NSF rate, and stable-employment percentage? A property-management company in the area should have these aggregated.
- How much new for-sale + rental construction is in the pipeline within 1–3 miles? Heavy new supply typically softens prices + rents 12–24 months out; constrained supply supports both.
Investment metrics
- 1% rule
- 1.18% ✓
- Cap rate
- 9.07%
- Cash-on-cash
- 9.93%
- DSCR
- 1.44
- GRM
- 7.1
CMA / ARV
- ARV (on-the-fly)
- $155,664
- Comps found
- 12
Show comp detail 12 sales within ~0.75 mi
| Address | Dist | Beds/Ba | Sqft | Sold | Price | $/sf | Match |
|---|---|---|---|---|---|---|---|
| 2465 Ogden Ave | 0.46mi | 3/1.0 (+1) | 1,176 (+6%) | 6mo | $162,000 | $138 | 58 |
| 2557 Ogden Ave | 0.45mi | 3/1.0 (+1) | 1,156 (+5%) | 11mo | $130,000 | $112 | 57 |
| 601 Cora Ave | 0.40mi | 3/1.0 (+1) | 1,227 (+11%) | 2mo | $165,000 | $134 | 56 |
| 515 Stetler Ave | 0.51mi | 3/1.0 (+1) | 1,056 (-4%) | 14mo | $130,000 | $123 | 52 |
| 674 Stevenson Ave | 0.38mi | 3/1.0 (+1) | 960 (-13%) | 4mo | $163,000 | $170 | 52 |
| 2461 Ogden Ave | 0.47mi | 3/2.0 (+1) | 1,176 (+6%) | 8mo | $158,500 | $135 | 51 |
| 615 Ingalls Rd | 0.72mi | 3/1.0 (+1) | 1,132 (+2%) | 14mo | $220,000 | $194 | 45 |
| 636 Woodstock Rd | 0.70mi | 2/1.0 | 960 (-13%) | 7mo | $134,900 | $141 | 40 |
| 2637 Leland Ave | 0.60mi | 3/1.5 (+1) | 1,190 (+8%) | 16mo | $90,000 | $76 | 39 |
| 618 Woodstock Rd | 0.71mi | 3/2.0 (+1) | 1,144 (+4%) | 17mo | $200,000 | $175 | 38 |
| 368 High Grove Blvd | 0.70mi | 3/2.0 (+1) | 1,144 (+4%) | 18mo | $173,000 | $151 | 37 |
| 591 Ingalls Rd | 0.75mi | 3/1.5 (+1) | 1,232 (+12%) | 7mo | $214,500 | $174 | 33 |
Match score weights: distance 35% · size 25% · config 20% · recency 20%. Top-matched comps best support the ARV.
Projected returns pro-forma
-3.0% appreciation · 3.0% rent growth · sell at horizon
- IRR
- -1.3%
- Equity multiple
- 0.95×
- Total profit
- $-1,701
- Equity at exit
- $17,743
- IRR
- 8.4%
- Equity multiple
- 1.64×
- Total profit
- $21,233
- Equity at exit
- $10,289
Cash invested: $33,320 (down + closing). Projections, not guarantees.
Landlord ↔ Tenant lean methodology
- Overall (STATE)
- 73 Landlord-Friendly
- State Ohio
- 73 Landlord-Friendly · R+6
- County
- — inherits STATE
- City
- — inherits STATE
ZIP-level market 44312
- Active inventory
- 137
- Price-to-rent
- 7.1×
Monthly cashflow live
- Estimated rent
- $1,401 high interval (Pro) →
- Mortgage (P&I)
- −$624
- Tax from tax record
- −$158 /mo · $1,894/yr
- Insurance
- −$50
- HOA
- −$0
- Vacancy / Maint / Mgmt
- −$294
- Net cashflow
- $276
Break-even live
UW: 25.0% down · 7.5% · 30yr · 1.5% tax · 5.0% vac · 8.0% maint · 8.0% mgmt
Financing live
Cash to close
- Down payment
- $29,750
- Closing costs
- $3,570
- Reserves months
- —
- Total cash needed
- —
Loan-product check · same deal, 3 products live
Conventional
25% down · 7.5% · 30yr
- Down + closing
- —
- Monthly P&I
- —
- Monthly cashflow
- —
- DSCR
- —
- Eligible?
- —
Personal DTI + credit; lowest rate.
DSCR
20% down · 8.5% · 30yr
- Down + closing
- —
- Monthly P&I
- —
- Monthly cashflow
- —
- DSCR
- —
- Eligible?
- —
No personal income docs; deal must DSCR.
Hard money
10% down · 12.0% · 12mo
- Down + closing
- —
- Monthly P&I
- —
- Monthly cashflow
- —
- DSCR
- —
- Eligible?
- —
Short-term bridge; refi at stabilization.
Rent comps 5 comps
| Address | Beds | Baths | Sqft | Rent | $/sqft | DOM | Units | Dist |
|---|---|---|---|---|---|---|---|---|
| 931 Crestline Dr Akron, OH | 3.0 | 1.0 | 976 | $1,550 | $1.59 | 14d | 1 | 0.09mi |
| 2948 Mogadore Rd Unit 5 Akron, OH | 2.0 | 1.0 | 700 | $975 | $1.39 | 14d | 1 | 1.29mi |
| 2994 Mogadore Rd Akron, OH | 2.0 | 1.0 | 715 | $931 | $1.30 | 23d | 1 | 1.31mi |
| 1920 Garden Ct S Akron, OH | 2.0 | 1.0 | 800 | $1,019 | $1.27 | 14d | 1 | 1.46mi |
| 2620 Mogadore Rd Akron, OH | 2.0 | 1.0 | 936 | $1,250 | $1.34 | 13d | 1 | 1.48mi |
Listing history 6 events
-
2026-06-18days on market $119,000 Active 38 DOM
-
2026-06-17days on market $119,000 Active 37 DOM
-
2026-06-16days on market $119,000 Active 36 DOM
-
2026-06-15days on market $119,000 Active 35 DOM
-
2026-06-15remarks 693-char remark
-
2026-06-15$119,000 Active 34 DOM
ⓘ Source: listings_history table (triggers on properties + properties_extension) + one-shot
backfill from property_details.listing_events for pre-trigger history.
Tax reassessment forecast OH · Partial reset (capped growth)
- Current annual tax
- $1,894 · $158/mo
- Projected year-2 tax
- $1,894 · $158/mo
- Expected delta
- $0/yr ($0/mo · 0.0%)
ⓘ Screening estimate from a state-policy table — verify with the county assessor before closing.
Climate risk First Street
- Flood 1/10 Low FEMA zone X (unshaded) · 0% chance over 30 yrs
- Wildfire 1/10 Low
- Heat 3/10 Moderate 7 d/yr ≥97°F today · 16 d/yr by 30 yrs out
- Wind 1/10 Low
- Air quality 2/10 Low 1 unhealthy d/yr today · 2 by 30 yrs out
Nearby sold comps map
Loading sold comps map…
Walkable amenities ~0.75 mi
Loading nearby amenities…
Taxation est. · year 1
- Rental income
- $16,817
- − Mortgage interest
- −$6,666
- − Property taxes
- −$1,894
- − Insurance
- −$595
- − Repairs & maintenance
- −$1,345
- − Management
- −$1,345
- − Depreciation
- −$3,462
- Taxable income
- $1,509
- Est. tax owed @ 24.0%
- −$362
- After-tax cash flow
- $2,945/yr
For passive investors: Depreciation is non-cash, so a rental often shows a tax loss while cash-flowing — sheltering income. Rental losses are passive: they offset passive income freely, and up to $25,000/yr can offset ordinary (W-2) income if you actively participate and your MAGI is under $100k (phasing out to $0 by $150k); unused losses carry forward. On sale, claimed depreciation is recaptured at up to 25%, and gains may owe capital-gains tax (a 1031 exchange can defer both). Figures are a year-1 estimate at your 24.0% rate — not tax advice; consult a CPA.
Schools (NCES district)
- District
- Springfield Local
- NCES district ID
- 3905006
- Math proficiency
- 40% ▼ -16.00%
- Reading proficiency
- 46% ▼ -12.00%
- Median HH income
- $47,669
- Composite
- 36.74/100
- National rank
- #4588
- State rank
- #512 of 656 in OH
Livability — Sawyerwood
- Score
- 74/100
- State rank
- #277
- US rank
- #4562
Category grades
Schools grade is shown separately in the Schools card above.
Census & demographics
- Census place
- Sawyerwood, OH
- County
- Summit County · 440,783 people
- Metro
- Akron, OH
- Population (ZIP)
- 30,280
- Household income
- $65,480
- Rent vs Own
- Severe rent burden
- 483.0
Population outlook (Summit County) Hauer SSP2
- Today (2025)
- 546,583 people
- By 2030
- 544,028 · -0.5%
- By 2040
- 531,363 · -2.8%
- By 2050
- 514,923 · -5.8%
- By 2075
- 481,765 · -11.9%
- By 2100
- 432,265 · -20.9%
Race, ethnicity, and origin ACS 2023
- Neighborhood character
- Predominantly White (90%)
- Race & ethnicity
- White 90% Two or more races 5% Black 3% Hispanic / Latino 2%
- Common ancestry
- Romanian 3% Slovak 2% Serbian 2%
- Foreign-born
- 2% · Canada
- Languages at home
- 97% English-only · Spanish 2% Russian/Polish/Slavic 1%
Political lean MEDSL · Summit
- 2024 margin
- Lean D (+7.0) · D 53.0% · R 46.0%
- 2008→2024 swing
- -9.6pp toward R · 2008: 16.6pp · 2024: 7.0pp
- All cycles
- 2024: D+7.0 2020: D+9.6 2016: D+8.2 2012: D+14.8 2008: D+16.6
Not yet ingested
- Civics
- —
Market trends
- HPI YoY
- ▼ -203.00%
- Current HPI
- 197.5988
- Rent YoY
- —
- Metro
- Akron, OH
- State GDP YoY
- ▲ 1.98%
- F500 in state
- 48
Industry mix (Fortune 500 HQ in OH)
| Industry | F500 HQs | Revenue |
|---|---|---|
| Insurance | 3 | $145B |
|
||
| Industrial Machinery | 3 | $49B |
|
||
| Financial Services | 3 | $24B |
|
||
| Consumer Goods | 2 | $93B |
|
||
| Aerospace / Defense | 2 | $47B |
|
||
| Utilities | 2 | $33B |
|
||
Price history
+621.2% since first listed6 events — show timeline
- 2026-06-09 Price Changed $119,000 MLSNOW
- 2026-05-26 Price Changed $129,900 MLSNOW
- 2026-05-11 Listed $139,900 MLSNOW
- 2009-06-26 Sold (Public Records) $50,000 Public Records
- 1997-01-31 Sold (Public Records) $14,000 Public Records
- 1989-03-03 Sold (Public Records) $16,500 Public Records
Property tax history
+2.7%/yrLatest (2025): $1,894 · -1.9% YoY. Source: county tax records.
Cash-flow waterfall
monthlySold comps — $/sqft
last 12 mo · ≤1 miLoading sold comps…