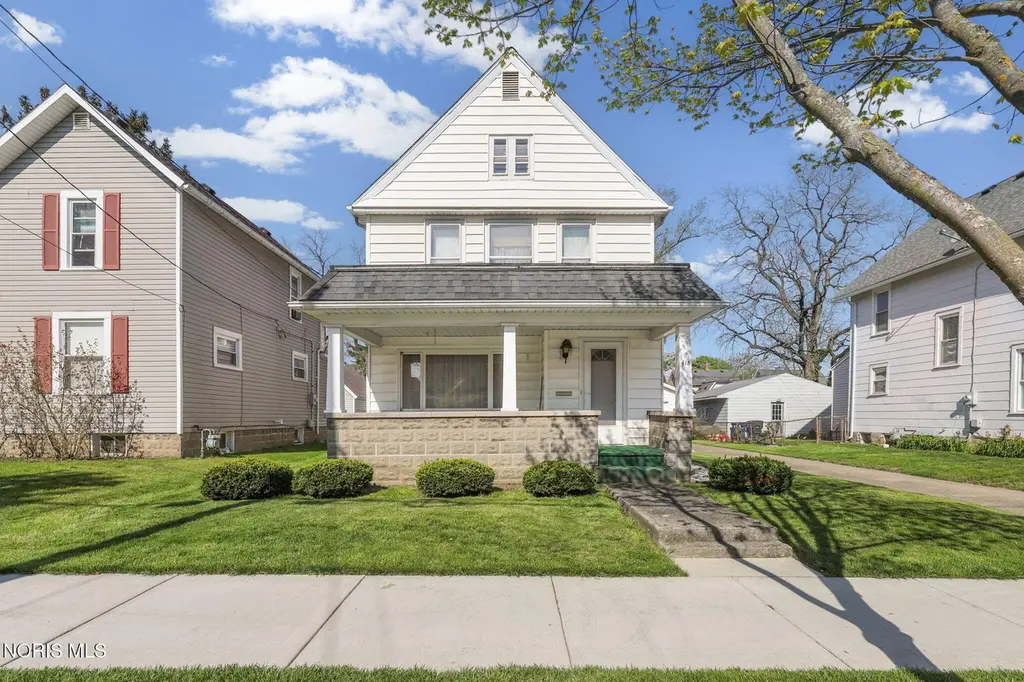
418 S Church St · Bowling Green, OH
Flood risk 3/10 · Minor
- FEMA flood zone
- X (unshaded)
- Chance of flooding over 30 yrs
- 0.2%
- Est. flood insurance / yr
- $473 – $860
Fire risk 1/10 · Minimal
- Est. fire insurance / yr
- $713 – $1,323
Heat risk 3/10 · Minor
- Hot days now (above 100°F)
- 7 days/yr
- Hot days in 30 yrs
- 17 days/yr
Wind risk 2/10 · Minimal
- Chance of severe wind over 30 yrs
- —
Air-quality risk 2/10 · Minimal
- Unhealthy air days now
- 1 days/yr
- Unhealthy air days in 30 yrs
- 2 days/yr
Risk factors via First Street. Map © Google.
Why this score? — see what drove the C- grade
The composite is a weighted blend of 9 inputs, each scored 0–100. Each bar is that input's sub-score; the figure is the points it added to the 100-point composite (weight × sub-score).
- ARV discount +15.0/15.0
- Cash flow +14.7/30.0
- DSCR +4.5/10.0
- Livability +4.5/5.0
- Schools +4.1/10.0
- 1% rule +3.9/10.0
- Rent growth +2.5/5.0
- Condition / age +2.5/5.0
- Appreciation +0.0/10.0
$160,000
🖨 Deal sheet 📄 Offer letter ✓ Due diligence
Listing remarks
Perfect opportunity for buyers seeking a renovation project. This property offers a large drive-through garage, enclosed side porch, built-in cabinetry, and a beautiful wood staircase. The second floor is in need of updates and includes space for additional bathroom. Property is being sold as-is.
Key facts
- 6,011 sq ft lot
- 2 garage spots
- Built 1900
Property features AI
Finance
- HOA & community: Street lights; Sidewalks
Exterior
- Parking: Attached garage with alley access; Concrete driveway; Total parking for 3 vehicles (2 garage spaces)
- Utilities: Cable available; Electricity connected (100 Amp service); Natural gas connected; Public sewer; Public water
- Home design: Single-family house; Two stories; Not attached to other structures; City street frontage; Asphalt road
- Construction: Vinyl siding; Shingle roof; Other foundation; Built (year from public records)
- Exterior features: Awning(s); Enclosed porch; Front porch; Shed
Interior
- Kitchen: Electric oven; Refrigerator; Pantry
- Bedrooms: Upper-level bedrooms: three bedrooms (sizes approx. 12x10, 15x11, 13x10)
- Flooring: Carpet
- Bathrooms: One full bathroom
- Heating & cooling: Forced air heating; Central air conditioning
- Interior features: Pantry; Walk-in closets; Primary bathroom; Partial basement
- Laundry & utility: Washer and dryer; Laundry on main level
Neighborhood map
What this means for you Summary
Snapshot
- This is a 3-bed/2.0-bath single-family listed at $160k.
Deal economics
- At list price, monthly cash flow is $42 ($501/yr) — positive.
- The deal already cash-flows at list — no discount required.
- To meet the 1% rule (rent ≥ 1% of price), the offer needs to be $142k (11.4% below list).
- Recommended offer: $142k (11.4% below list) — sets the bar for 1% rule.
- Cap rate 6.6% vs local median 2.6% in Bowling Green — top-decile yield for the area; either an underpriced asset or a hidden risk that comps aren't pricing in. Stress-test before assuming the spread holds.
Location & tenants
- Location reads 90/100 on livability (#8 in OH, #71 nationally) — a professional / high-income tenant draw. Strengths: crime A+, amenities A+, commute A+; Watch: employment F.
- Bowling Green City School District (town): math 40% / reading 58% proficiency, ranked #469 of 656 in OH (top 72%) — families likely to look elsewhere, expect single-tenant / working-renter base with shorter leases.
- Zoned schools: Kenwood Elementary School (math 52% / reading 67%, grade B-, #670 of 1,584 statewide, top 45%, 274 students, 43% FRL); Bowling Green Middle School (math 41% / reading 53%, grade D+, #451 of 654 statewide, top 70%, 630 students, 32% FRL); Bowling Green High School (math 29% / reading 65%, grade D-, #435 of 781 statewide, top 59%, 807 students, 23% FRL) — zoned schools at 33% FRL track the district average.
- Market conditions: 105 active listings in the ZIP; 493 units permitted in Wood County in 2024 (48 in 5+ unit buildings).
- This rent runs 32% of the median local income ($52k/yr) — at the standard rent-burdened threshold; future hikes will face affordability resistance.
Forward outlook
- Local home prices are declining (-3.0%/yr); year-one equity from $1k of loan paydown is wiped out by about $5k of value loss. Plan a longer hold.
- Wood County population projected at +14% by 2050 — modest demand growth; plan on rents tracking national, not racing it.
Negotiation context
- It's been on market 52 days — a 3% lower offer ($155k) is reasonable based on typical stale-listing flexibility.
- 2 sale attempts with the ask held roughly flat each time — persistent listings suggest the price (not the market) is what's stuck; bring a comps-based counter.
Risks & watch-outs
- Watch-outs: built in 1900 — expect roof / HVAC / electrical / plumbing capex.
Questions for the listing agent
- It's been on market 52 days. Have you received any prior offers? Is the seller open to a 11% concession, seller financing, or rate buy-down credit?
- Built in 1900 — when were the roof, HVAC, electrical panel, plumbing, and water heater last replaced?
- Is there a deadline driving the sale (1031 exchange, divorce, estate, relocation)? That informs how much negotiation room exists.
- Schools are A-rated — typically a magnet for longer-tenancy family renters. What's the average tenant stay here, and is there a school-zone premium baked into asking?
- What's the average days-on-market for RENTAL listings here right now (not sales)? A rising rental-DOM trend means longer vacancies and softer asking-rent achievability than the comps imply.
- What's the recent tenant-quality profile in this submarket — average credit score on applications, eviction rate, late-payment / NSF rate, and stable-employment percentage? A property-management company in the area should have these aggregated.
- How much new for-sale + rental construction is in the pipeline within 1–3 miles? Heavy new supply typically softens prices + rents 12–24 months out; constrained supply supports both.
Investment metrics
- 1% rule
- 0.89% ✗
- Cap rate
- 6.61%
- Cash-on-cash
- 1.12%
- DSCR
- 1.05
- GRM
- 9.4
CMA / ARV
- ARV (median comp)
- $235,687
- List price
- $160,000
- Delta
- -32.11%
- Verdict
- UNDERPRICED
- Comps
- 20 within 1.0 mi
Show comp detail 12 sales within ~0.75 mi
| Address | Dist | Beds/Ba | Sqft | Sold | Price | $/sf | Match |
|---|---|---|---|---|---|---|---|
| 416 Buttonwood Ave | 0.14mi | 3/2.0 | 1,832 (-3%) | 11mo | $261,000 | $142 | 79 |
| 418 S Grove St | 0.06mi | 4/2.0 (+1) | 2,010 (+6%) | 11mo | $229,900 | $114 | 73 |
| 150 Buttonwood Ave | 0.31mi | 3/1.5 | 1,910 (+1%) | 12mo | $238,075 | $125 | 72 |
| 519 Knollwood Dr | 0.42mi | 3/2.0 | 1,946 (+3%) | 7mo | $280,000 | $144 | 70 |
| 608 Sand Ridge Rd | 0.41mi | 4/2.0 (+1) | 1,774 (-6%) | 5mo | $218,000 | $123 | 61 |
| 627 Wallace Ave | 0.62mi | 4/1.5 (+1) | 1,877 (-1%) | 4mo | $199,900 | $106 | 59 |
| 219 Winfield Dr | 0.49mi | 3/2.5 | 2,030 (+7%) | 8mo | $340,000 | $167 | 57 |
| 714 Birch St | 0.51mi | 4/2.5 (+1) | 1,956 (+3%) | 9mo | $270,000 | $138 | 56 |
| 717 Birch St | 0.54mi | 4/2.0 (+1) | 1,997 (+5%) | 12mo | $307,000 | $154 | 51 |
| 893 W Wooster St | 0.68mi | 3/2.0 | 2,059 (+9%) | 5mo | $320,000 | $155 | 50 |
| 847 Pearl St | 0.55mi | 4/1.5 (+1) | 1,704 (-10%) | 8mo | $252,500 | $148 | 44 |
| 927 Charles St | 0.71mi | 3/1.5 | 1,704 (-10%) | 6mo | $302,500 | $178 | 43 |
Match score weights: distance 35% · size 25% · config 20% · recency 20%. Top-matched comps best support the ARV.
Projected returns pro-forma
-3.0% appreciation · 3.0% rent growth · sell at horizon
- IRR
- -14.5%
- Equity multiple
- 0.48×
- Total profit
- $-23,264
- Equity at exit
- $23,857
- IRR
- -5.8%
- Equity multiple
- 0.62×
- Total profit
- $-16,816
- Equity at exit
- $13,834
Cash invested: $44,800 (down + closing). Projections, not guarantees.
Landlord ↔ Tenant lean methodology
- Overall (STATE)
- 73 Landlord-Friendly
- State Ohio
- 73 Landlord-Friendly · R+6
- County
- — inherits STATE
- City
- — inherits STATE
ZIP-level market 43402
- Active inventory
- 105
- Price-to-rent
- 9.4×
Monthly cashflow live
- Estimated rent
- $1,418 medium interval (Pro) →
- Mortgage (P&I)
- −$839
- Tax from tax record
- −$173 /mo · $2,074/yr
- Insurance
- −$67
- HOA
- −$0
- Vacancy / Maint / Mgmt
- −$298
- Net cashflow
- $42
Break-even live
UW: 25.0% down · 7.5% · 30yr · 1.5% tax · 5.0% vac · 8.0% maint · 8.0% mgmt
Financing live
Cash to close
- Down payment
- $40,000
- Closing costs
- $4,800
- Reserves months
- —
- Total cash needed
- —
Loan-product check · same deal, 3 products live
Conventional
25% down · 7.5% · 30yr
- Down + closing
- —
- Monthly P&I
- —
- Monthly cashflow
- —
- DSCR
- —
- Eligible?
- —
Personal DTI + credit; lowest rate.
DSCR
20% down · 8.5% · 30yr
- Down + closing
- —
- Monthly P&I
- —
- Monthly cashflow
- —
- DSCR
- —
- Eligible?
- —
No personal income docs; deal must DSCR.
Hard money
10% down · 12.0% · 12mo
- Down + closing
- —
- Monthly P&I
- —
- Monthly cashflow
- —
- DSCR
- —
- Eligible?
- —
Short-term bridge; refi at stabilization.
Listing history 16 events
-
2026-06-18days on market $160,000 Active 52 DOM
-
2026-06-17days on market $160,000 Active 51 DOM
-
2026-06-16statusdays on market $160,000 Active 50 DOM
-
2026-06-15days on market $160,000 Contingent 49 DOM
-
2026-06-14statusdays on market $160,000 Contingent 47 DOM
-
2026-06-10days on market $160,000 Active 44 DOM
-
2026-06-09days on market $160,000 Active 43 DOM
-
2026-06-08days on market $160,000 Active 42 DOM
-
2026-06-07days on market $160,000 Active 41 DOM
-
2026-06-03days on market $160,000 Active 37 DOM
-
2026-06-02days on market $160,000 Active 36 DOM
-
2026-06-01days on market $160,000 Active 35 DOM
-
2026-05-31days on market $160,000 Active 34 DOM
-
2026-05-30days on market $160,000 Active 33 DOM
-
2026-04-27$160,000 Active 369-char remark
-
2026-04-23historical $160,000 369-char remark
ⓘ Source: listings_history table (triggers on properties + properties_extension) + one-shot
backfill from property_details.listing_events for pre-trigger history.
Tax reassessment forecast OH · Partial reset (capped growth)
- Current annual tax
- $2,074 · $173/mo
- Projected year-2 tax
- $2,285 · $190/mo
- Expected delta
- +$211/yr (+$18/mo · 10.2%)
ⓘ Screening estimate from a state-policy table — verify with the county assessor before closing.
Climate risk First Street
- Flood 3/10 Moderate FEMA zone X (unshaded) · 20% chance over 30 yrs
- Wildfire 1/10 Low
- Heat 3/10 Moderate 7 d/yr ≥100°F today · 17 d/yr by 30 yrs out
- Wind 2/10 Low
- Air quality 2/10 Low 1 unhealthy d/yr today · 2 by 30 yrs out
Nearby sold comps map
Loading sold comps map…
Walkable amenities ~0.75 mi
Loading nearby amenities…
Taxation est. · year 1
- Rental income
- $17,018
- − Mortgage interest
- −$8,962
- − Property taxes
- −$2,074
- − Insurance
- −$800
- − Repairs & maintenance
- −$1,361
- − Management
- −$1,361
- − Depreciation
- −$4,655
- Taxable loss
- −$2,197
- Est. tax savings @ 24.0%
- +$527
- After-tax cash flow
- $1,028/yr
For passive investors: Depreciation is non-cash, so a rental often shows a tax loss while cash-flowing — sheltering income. Rental losses are passive: they offset passive income freely, and up to $25,000/yr can offset ordinary (W-2) income if you actively participate and your MAGI is under $100k (phasing out to $0 by $150k); unused losses carry forward. On sale, claimed depreciation is recaptured at up to 25%, and gains may owe capital-gains tax (a 1031 exchange can defer both). Figures are a year-1 estimate at your 24.0% rate — not tax advice; consult a CPA.
Schools (NCES district)
- District
- Bowling Green City School District
- NCES district ID
- 3904363
- Math proficiency
- 40% ▼ -27.00%
- Reading proficiency
- 58% ▼ -10.00%
- Median HH income
- $37,785
- Composite
- 40.72/100
- National rank
- #3661
- State rank
- #469 of 656 in OH
Livability — Bowling Green
- Score
- 90/100
- State rank
- #8
- US rank
- #71
Category grades
Schools grade is shown separately in the Schools card above.
Census & demographics
- Census place
- Bowling Green, OH
- County
- Wood County · 75,163 people
- City population
- 31,393
- Metro
- Toledo, OH
- Population (ZIP)
- 31,393
- Household income
- $52,426
- Rent vs Own
- Severe rent burden
- 2629.0
Population outlook (Wood County) Hauer SSP2
- Today (2025)
- 138,744 people
- By 2030
- 143,189 · +3.2%
- By 2040
- 150,896 · +8.8%
- By 2050
- 158,589 · +14.3%
- By 2075
- 182,166 · +31.3%
- By 2100
- 196,533 · +41.7%
Race, ethnicity, and origin ACS 2023
- Neighborhood character
- Predominantly White (85%)
- Race & ethnicity
- White 85% Two or more races 7% Hispanic / Latino 7% Black 3%
- Hispanic origin (detail)
- Mexican 4%
- Common ancestry
- Romanian 8% Lithuanian 4% Slovak 2%
- Foreign-born
- 3% · Canada
- Languages at home
- 96% English-only · Spanish 2%
Political lean MEDSL · Wood
- 2024 margin
- R (+10.2) · D 44.4% · R 54.6%
- 2008→2024 swing
- -17.3pp toward R · 2008: 7.1pp · 2024: -10.2pp
- All cycles
- 2024: R+10.2 2020: R+7.6 2016: R+8.5 2012: D+4.2 2008: D+7.1
Not yet ingested
- Civics
- —
Market trends
- HPI YoY
- ▼ -132.67%
- Current HPI
- 179.1826
- Rent YoY
- —
- Metro
- Toledo, OH
- State GDP YoY
- ▲ 1.98%
- F500 in state
- 48
Industry mix (Fortune 500 HQ in OH)
| Industry | F500 HQs | Revenue |
|---|---|---|
| Insurance | 3 | $145B |
|
||
| Industrial Machinery | 3 | $49B |
|
||
| Financial Services | 3 | $24B |
|
||
| Consumer Goods | 2 | $93B |
|
||
| Aerospace / Defense | 2 | $47B |
|
||
| Utilities | 2 | $33B |
|
||
Price history
+0.0% since first listed4 events — show timeline
- 2026-06-16 Relisted — NORIS
- 2026-06-11 Contingent — NORIS
- 2026-04-27 Listed $160,000 NORIS
- 2026-04-23 Coming Soon $160,000 NORIS
Property tax history
+6.3%/yrLatest (2025): $2,074 · -0.6% YoY. Source: county tax records.
Cash-flow waterfall
monthlySold comps — $/sqft
last 12 mo · ≤1 miLoading sold comps…