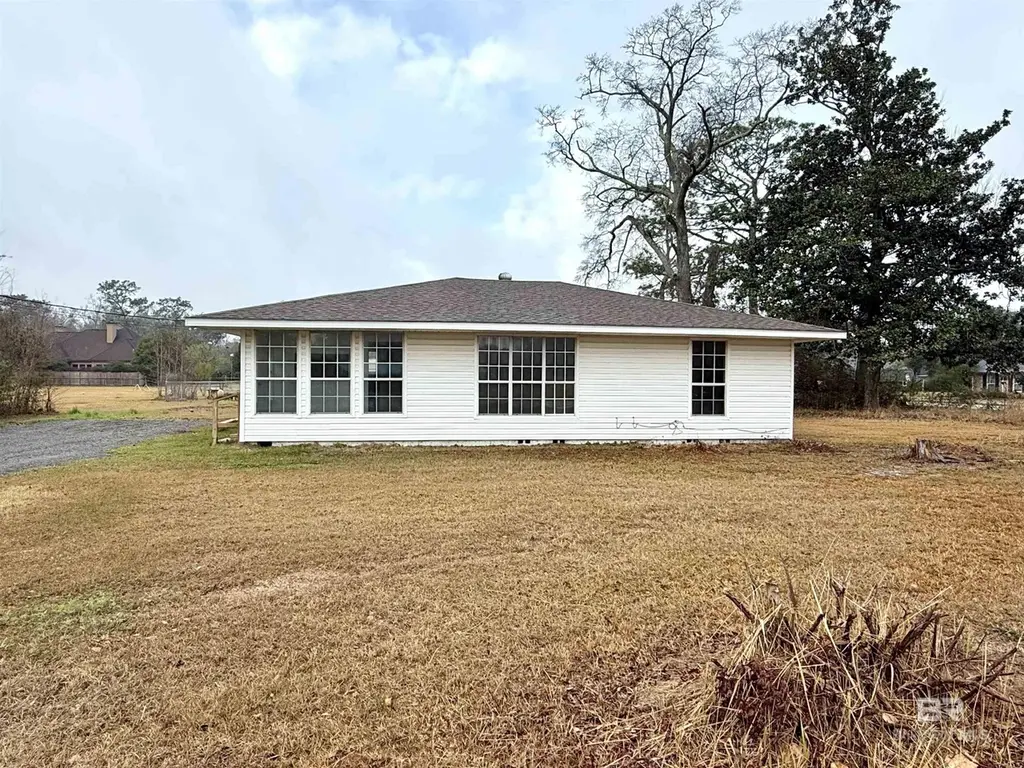
1213 N Pine St · Foley, AL
Flood risk 5/10 · Moderate
- FEMA flood zone
- X (unshaded)
- Chance of flooding over 30 yrs
- 0.47%
- Est. flood insurance / yr
- $507 – $1,088
Fire risk 1/10 · Minimal
- Est. fire insurance / yr
- $916 – $1,700
Heat risk 10/10 · Severe
- Hot days now (above 105°F)
- 7 days/yr
- Hot days in 30 yrs
- 23 days/yr
Wind risk 9/10 · Severe
- Chance of severe wind over 30 yrs
- 99.0%
Air-quality risk 3/10 · Minor
- Unhealthy air days now
- 2 days/yr
- Unhealthy air days in 30 yrs
- 4 days/yr
Risk factors via First Street. Map © Google.
Why this score? — see what drove the C- grade
The composite is a weighted blend of 9 inputs, each scored 0–100. Each bar is that input's sub-score; the figure is the points it added to the 100-point composite (weight × sub-score).
- Cash flow +16.4/30.0
- ARV discount +13.7/15.0
- DSCR +5.1/10.0
- Schools +3.9/10.0
- 1% rule +3.4/10.0
- Livability +3.1/5.0
- Rent growth +3.0/5.0
- Condition / age +2.5/5.0
- Appreciation +0.0/10.0
$209,000
🖨 Deal sheet 📄 Offer letter ✓ Due diligence
Listing remarks MLS
Clean and updated charm! Built in 1955, this charming updated 1,320 sq ft home blends classic character with modern upgrades. Recent improvements include plumbing and wiring updates for peace of mind, fresh interior paint, new flooring throughout, and stylish new countertops. The bathrooms have been thoughtfully updated, and the kitchen features new cabinets and countertops, creating a fresh and functional space ready for its new owner. Buyer to verify all information during due diligence.
Key facts
- Plumbing updates
- Wiring updates
- New flooring
Tags
Neighborhood map
What this means for you Summary
Snapshot
- This is a 3-bed/1.0-bath single-family listed at $209k.
Deal economics
- At list price, monthly cash flow is $120 ($1k/yr) — positive.
- The deal already cash-flows at list — no discount required.
- To meet the 1% rule (rent ≥ 1% of price), the offer needs to be $176k (15.7% below list).
- Recommended offer: $176k (15.7% below list) — sets the bar for 1% rule.
- Cap rate 7.0% vs local median 4.0% in Foley — top-decile yield for the area; either an underpriced asset or a hidden risk that comps aren't pricing in. Stress-test before assuming the spread holds.
Location & tenants
- Location reads 61/100 on livability (#241 in AL) — a middle-class / working-renter tenant base. Strengths: housing A+, cost of living A-, crime B; Watch: schools D+, employment D+, amenities F.
- Baldwin County (rural): math 33% / reading 57% proficiency, ranked #18 of 129 in AL (top 14%) — families likely to look elsewhere, expect single-tenant / working-renter base with shorter leases.
- Market conditions: Rents rising (+1.8%/yr); 875 active listings in the ZIP; 6 comparable units currently listed for rent nearby; rentals lingering (median 44d on market — plan ~5-8 weeks vacancy on turnover, expect pricing pressure); 83% of comp listings sitting > 30 days — soft ceiling on asking rent; 3,883 units permitted in Baldwin County in 2024 (481 in 5+ unit buildings).
- This rent runs 32% of the median local income ($67k/yr) — at the standard rent-burdened threshold; future hikes will face affordability resistance.
Forward outlook
- Local home prices are declining (-3.0%/yr); year-one equity from $1k of loan paydown is wiped out by about $6k of value loss. Plan a longer hold.
- Baldwin County population projected at +42% by 2050 — long-run rental-demand tailwind backs the buy-and-hold thesis.
Negotiation context
- It's been on market 67 days — a 6% lower offer ($196k) is reasonable based on typical stale-listing flexibility.
Risks & watch-outs
- Watch-outs: built in 1955 — expect roof / HVAC / electrical / plumbing capex.
- Climate carrying-cost: moderate flood risk; severe wind risk, 99% chance of damaging wind over 30y; extreme-heat days projected 7→23/yr by 2055 (HVAC capex compounding) — expect insurance premiums to compound above CPI over the hold.
Questions for the listing agent
- It's been on market 67 days. Have you received any prior offers? Is the seller open to a 16% concession, seller financing, or rate buy-down credit?
- Built in 1955 — when were the roof, HVAC, electrical panel, plumbing, and water heater last replaced?
- Why hasn't it sold? Are there any deal-killer items the seller is aware of (foundation, flood, title, zoning, code violations)?
- Is there a deadline driving the sale (1031 exchange, divorce, estate, relocation)? That informs how much negotiation room exists.
- Schools are D-rated, which usually means shorter tenancies and higher turnover. Who's the typical renter profile here, and what's been the actual vacancy rate?
- What's the average days-on-market for RENTAL listings here right now (not sales)? A rising rental-DOM trend means longer vacancies and softer asking-rent achievability than the comps imply.
- What's the recent tenant-quality profile in this submarket — average credit score on applications, eviction rate, late-payment / NSF rate, and stable-employment percentage? A property-management company in the area should have these aggregated.
- How much new for-sale + rental construction is in the pipeline within 1–3 miles? Heavy new supply typically softens prices + rents 12–24 months out; constrained supply supports both.
Investment metrics
- 1% rule
- 0.84% ✗
- Cap rate
- 6.98%
- Cash-on-cash
- 2.46%
- DSCR
- 1.11
- GRM
- 9.9
CMA / ARV
- ARV (median comp)
- $242,250
- List price
- $209,000
- Delta
- -13.73%
- Verdict
- UNDERPRICED
- Comps
- 20 within 1.0 mi
Show comp detail 12 sales within ~0.75 mi
| Address | Dist | Beds/Ba | Sqft | Sold | Price | $/sf | Match |
|---|---|---|---|---|---|---|---|
| 411 W Camphor Ave | 0.48mi | 3/1.0 | 1,248 (+2%) | 10mo | $250,000 | $200 | 65 |
| 421 Cedar Ct | 0.36mi | 3/2.0 | 1,337 (+10%) | 1mo | $234,000 | $175 | 62 |
| 1820 N Cedar St | 0.68mi | 3/1.0 | 1,256 (+3%) | 2mo | $122,000 | $97 | 61 |
| 316 W Fig Ave | 0.31mi | 2/2.0 (-1) | 1,104 (-9%) | 3mo | $209,900 | $190 | 59 |
| 317 W Magnolia Ave | 0.74mi | 3/1.0 | 1,214 (-0%) | 12mo | $230,000 | $189 | 55 |
| 413 W Marigold Ave | 0.63mi | 3/1.0 | 1,123 (-8%) | 4mo | $190,000 | $169 | 54 |
| 1562 Majesty Loop | 0.73mi | 3/2.0 | 1,260 (+3%) | 5mo | $202,000 | $160 | 52 |
| 302 Cluster St | 0.67mi | 3/2.0 | 1,353 (+11%) | 7mo | $250,000 | $185 | 40 |
| 1549 Majesty Loop | 0.70mi | 3/2.0 | 1,370 (+12%) | 5mo | $217,000 | $158 | 38 |
| 304 Cluster St | 0.67mi | 3/2.0 | 1,353 (+11%) | 11mo | $251,000 | $186 | 37 |
| 301 Cluster St | 0.70mi | 3/2.0 | 1,382 (+14%) | 7mo | $248,000 | $179 | 35 |
| 202 W Magnolia Ave | 0.72mi | 3/2.0 | 1,392 (+14%) | 8mo | $275,000 | $198 | 32 |
Match score weights: distance 35% · size 25% · config 20% · recency 20%. Top-matched comps best support the ARV.
Projected returns pro-forma
-3.0% appreciation · 1.81% rent growth · sell at horizon
- IRR
- -13.7%
- Equity multiple
- 0.51×
- Total profit
- $-28,397
- Equity at exit
- $31,163
- IRR
- -6.6%
- Equity multiple
- 0.60×
- Total profit
- $-23,572
- Equity at exit
- $18,071
Cash invested: $58,520 (down + closing). Projections, not guarantees.
Landlord ↔ Tenant lean methodology
- Overall (STATE)
- 90 Strongly Landlord-Friendly
- State Alabama
- 90 Strongly Landlord-Friendly · R+15
- County
- — inherits STATE
- City
- — inherits STATE
ZIP-level market 36535
- Home prices YoY
- -24.9%
- Rents YoY
- 1.8%
- Active inventory
- 875
- Price-to-rent
- 9.9×
Monthly cashflow live
- Estimated rent
- $1,762 high interval (Pro) →
- Mortgage (P&I)
- −$1,096
- Tax from tax record
- −$89 /mo · $1,067/yr
- Insurance
- −$87
- HOA
- −$0
- Vacancy / Maint / Mgmt
- −$370
- Net cashflow
- $120
Break-even live
UW: 25.0% down · 7.5% · 30yr · 1.5% tax · 5.0% vac · 8.0% maint · 8.0% mgmt
Financing live
Cash to close
- Down payment
- $52,250
- Closing costs
- $6,270
- Reserves months
- —
- Total cash needed
- —
Loan-product check · same deal, 3 products live
Conventional
25% down · 7.5% · 30yr
- Down + closing
- —
- Monthly P&I
- —
- Monthly cashflow
- —
- DSCR
- —
- Eligible?
- —
Personal DTI + credit; lowest rate.
DSCR
20% down · 8.5% · 30yr
- Down + closing
- —
- Monthly P&I
- —
- Monthly cashflow
- —
- DSCR
- —
- Eligible?
- —
No personal income docs; deal must DSCR.
Hard money
10% down · 12.0% · 12mo
- Down + closing
- —
- Monthly P&I
- —
- Monthly cashflow
- —
- DSCR
- —
- Eligible?
- —
Short-term bridge; refi at stabilization.
Rent comps 6 comps
| Address | Beds | Baths | Sqft | Rent | $/sqft | DOM | Units | Dist |
|---|---|---|---|---|---|---|---|---|
| 134 W Satsuma Ave Foley, AL | 2.0 | 2.0 | 1000 | $1,400 | $1.40 | 43d | 1 | 0.19mi |
| 1128 N Alston St Foley, AL | 2.0 | 2.0 | 1008 | $1,600 | $1.59 | 21d | 1 | 0.22mi |
| 801 N Pine St Foley, AL | 2.0 | 1.0 | 1041 | $1,695 | $1.63 | 43d | 1 | 0.46mi |
| 1802 Cashew Cir Foley, AL | 2.0–5.0 | 2.0–2.5 | 1702 | $2,084 | $1.22 | 43d | 1 | 0.89mi |
| 116 S Elm St Unit 116 Foley, AL | 3.0 | 2.0 | 1125 | $1,350 | $1.20 | 44d | 1 | 1.22mi |
| 503 S Cedar St Foley, AL | 2.0 | 2.0 | 1200 | $1,600 | $1.33 | 43d | 1 | 1.39mi |
Listing history 3 events
-
2026-05-06status Pending 495-char remark
Show marketing remark (495 chars)
Clean and updated charm! Built in 1955, this charming updated 1,320 sq ft home blends classic character with modern upgrades. Recent improvements include plumbing and wiring updates for peace of mind, fresh interior paint, new flooring throughout, and stylish new countertops. The bathrooms have been thoughtfully updated, and the kitchen features new cabinets and countertops, creating a fresh and functional space ready for its new owner. Buyer to verify all information during due diligence.
-
2026-02-27$209,000 Active 495-char remark
Show marketing remark (495 chars)
Clean and updated charm! Built in 1955, this charming updated 1,320 sq ft home blends classic character with modern upgrades. Recent improvements include plumbing and wiring updates for peace of mind, fresh interior paint, new flooring throughout, and stylish new countertops. The bathrooms have been thoughtfully updated, and the kitchen features new cabinets and countertops, creating a fresh and functional space ready for its new owner. Buyer to verify all information during due diligence.
-
2015-05-19soldstatus $1,500,000
ⓘ Source: listings_history table (triggers on properties + properties_extension) + one-shot
backfill from property_details.listing_events for pre-trigger history.
Tax reassessment forecast AL · Resets to sale price
- Current annual tax
- $1,067 · $89/mo
- Projected year-2 tax
- $1,067 · $89/mo
- Expected delta
- $0/yr ($0/mo · 0.0%)
ⓘ Screening estimate from a state-policy table — verify with the county assessor before closing.
Climate risk First Street
- Flood 5/10 Major FEMA zone X (unshaded) · 47% chance over 30 yrs
- Wildfire 1/10 Low
- Heat 10/10 Extreme 7 d/yr ≥105°F today · 23 d/yr by 30 yrs out
- Wind 9/10 Extreme 99% chance of damaging wind over 30 yrs
- Air quality 3/10 Moderate 2 unhealthy d/yr today · 4 by 30 yrs out
Nearby sold comps map
Loading sold comps map…
Walkable amenities ~0.75 mi
Loading nearby amenities…
Taxation est. · year 1
- Rental income
- $21,142
- − Mortgage interest
- −$11,707
- − Property taxes
- −$1,067
- − Insurance
- −$1,045
- − Repairs & maintenance
- −$1,691
- − Management
- −$1,691
- − Depreciation
- −$6,080
- Taxable loss
- −$2,140
- Est. tax savings @ 24.0%
- +$513
- After-tax cash flow
- $1,952/yr
For passive investors: Depreciation is non-cash, so a rental often shows a tax loss while cash-flowing — sheltering income. Rental losses are passive: they offset passive income freely, and up to $25,000/yr can offset ordinary (W-2) income if you actively participate and your MAGI is under $100k (phasing out to $0 by $150k); unused losses carry forward. On sale, claimed depreciation is recaptured at up to 25%, and gains may owe capital-gains tax (a 1031 exchange can defer both). Figures are a year-1 estimate at your 24.0% rate — not tax advice; consult a CPA.
Schools (NCES district)
- District
- Baldwin County
- NCES district ID
- 0100270
- Math proficiency
- 33% ▼ -26.00%
- Reading proficiency
- 57% ▲ 1.00%
- Median HH income
- $50,677
- Composite
- 38.61/100
- National rank
- #4157
- State rank
- #18 of 129 in AL
Livability — Foley
- Score
- 61/100
- State rank
- #241
- US rank
- #17616
Category grades
Schools grade is shown separately in the Schools card above.
Census & demographics
- Census place
- Foley, AL
- County
- Baldwin County · 181,514 people
- City population
- 40,628
- Metro
- Daphne-Fairhope-Foley, AL
- Population (ZIP)
- 40,628
- Household income
- $66,714
- Rent vs Own
- Severe rent burden
- 803.0
Population outlook (Baldwin County) Hauer SSP2
- Today (2025)
- 248,264 people
- By 2030
- 270,315 · +8.9%
- By 2040
- 312,967 · +26.1%
- By 2050
- 352,262 · +41.9%
- By 2075
- 438,841 · +76.8%
- By 2100
- 487,736 · +96.5%
Race, ethnicity, and origin ACS 2023
- Neighborhood character
- Predominantly White (78%)
- Race & ethnicity
- White 78% Hispanic / Latino 10% Two or more races 8% Black 5% Asian 2%
- Hispanic origin (detail)
- Mexican 6%
- Common ancestry
- Lithuanian 2% Romanian 2% Slovak 1%
- Foreign-born
- 6% · Canada, China
- Languages at home
- 89% English-only · Spanish 7% Other Indo-European 2% Chinese 1%
Political lean MEDSL · Baldwin
- 2024 margin
- Solid R (+58.2) · D 20.5% · R 78.7%
- 2008→2024 swing
- -6.7pp toward R · 2008: -51.5pp · 2024: -58.2pp
- All cycles
- 2024: R+58.2 2020: R+53.8 2016: R+57.8 2012: R+55.8 2008: R+51.5
Not yet ingested
- Civics
- —
Market trends
- HPI YoY
- ▼ -86.82%
- Current HPI
- 262.2796
- Rent YoY
- ▲ 1.81%
- Metro
- Daphne-Fairhope-Foley, AL
- State GDP YoY
- ▲ 2.94%
- F500 in state
- 4
Industry mix (Fortune 500 HQ in AL)
| Industry | F500 HQs | Revenue |
|---|---|---|
| Financial Services | 1 | $8B |
|
||
| Healthcare | 1 | $5B |
|
||
Price history
-86.1% since first listed3 events — show timeline
- 2026-05-06 Pending — BCAR
- 2026-02-27 Listed $209,000 BCAR
- 2015-05-19 Sold (Public Records) $1,500,000 Public Records
Property tax history
+6.9%/yrLatest (2025): $1,067 · +2.3% YoY. Source: county tax records.
Cash-flow waterfall
monthlySold comps — $/sqft
last 12 mo · ≤1 miLoading sold comps…