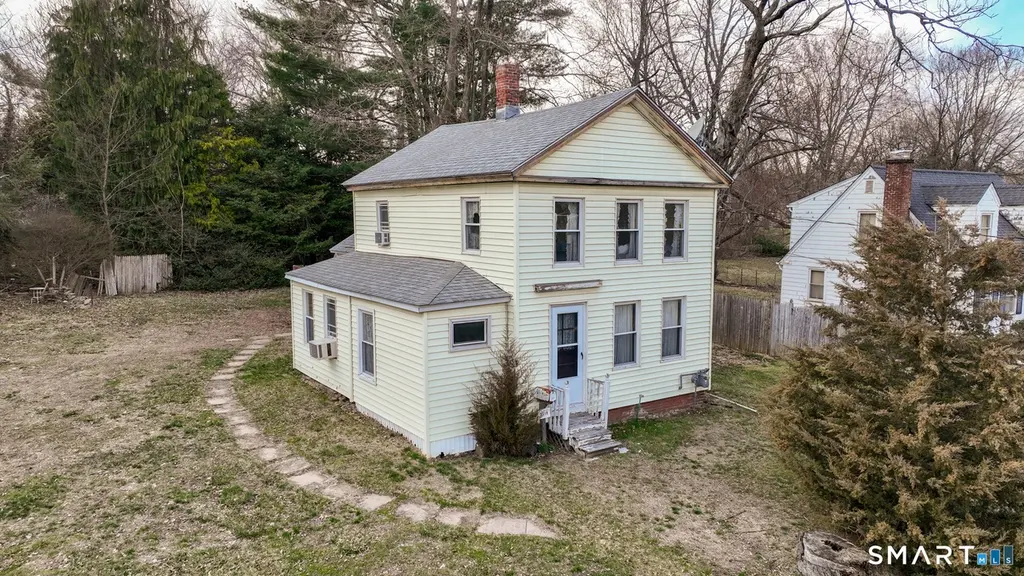
2719 Main St · Wethersfield, CT
Flood risk No data
- FEMA flood zone
- —
- Chance of flooding over 30 yrs
- —
- Est. flood insurance / yr
- —
Fire risk No data
- Est. fire insurance / yr
- —
Heat risk No data
- Hot days now (above threshold)
- —
- Hot days in 30 yrs
- —
Wind risk No data
- Chance of severe wind over 30 yrs
- —
Air-quality risk No data
- Unhealthy air days now
- —
- Unhealthy air days in 30 yrs
- —
Risk factors via First Street. Map © Google.
Why this score? — see what drove the D grade
The composite is a weighted blend of 9 inputs, each scored 0–100. Each bar is that input's sub-score; the figure is the points it added to the 100-point composite (weight × sub-score).
- ARV discount +15.0/15.0
- Cash flow +8.7/30.0
- Schools +5.6/10.0
- Livability +3.9/5.0
- Rent growth +3.4/5.0
- 1% rule +2.8/10.0
- Condition / age +2.5/5.0
- DSCR +2.4/10.0
- Appreciation +0.0/10.0
$261,900
🖨 Deal sheet (PDF) 📄 Offer letter ✓ Due diligence
Listing remarks
This wonderful home, full of its rich New England charm, is ready for its new owners to fall in LOVE! The main level boasts a great flow for entertaining, with the kitchen and dining room adjoining layout that's perfect for get togethers with loved ones and friends! The large living room, with its big windows allowing in tons of natural light, sits conveniently off the dining area. The open concept layout between the two rooms is ideal for relaxing after that big meal! The bathroom sits on the main level as well for convenience. Upstairs, you'll find the primary bedroom, a generous sized secondary bedroom for personal space needs and a third additional room that can be utilized as an extra
Key facts
- 0.4 acre lot
- Built 1830
- Listed 58 days
Property features AI
Finance
- Other: Corner lot that is lightly wooded, level and cleared
Exterior
- Utilities: Public water connected; Public sewer connected
- Home design: Single-family home; Yellow exterior
- Construction: Frame construction; Asphalt shingle roof; Vinyl siding; Stone foundation; Property built as single family (living area per public record: 1354)
- Exterior features: Breezeway; Barn; Garden area
Interior
- Kitchen: Oven/Range; Refrigerator
- Bedrooms: 2 bedrooms
- Bathrooms: 1 full bathroom
- Heating & cooling: Baseboard heating; Hot water heating; Oil-fired heat; Window unit cooling; Fuel tank located in basement
- Interior features: 6 total rooms; Full, unfinished basement; Has attic (crawl space); 1 fireplace
- Laundry & utility: Domestic hot water
Neighborhood map
What this means for you Summary
Snapshot
- This is a 2-bed/1.0-bath single-family listed at $262k.
Deal economics
- At list price, monthly cash flow is $-219 ($-3k/yr) — negative.
- To cash-flow at today's rent, offer at most $223k (14.8% below list).
- To meet the 1% rule (rent ≥ 1% of price), the offer needs to be $203k (22.4% below list).
- Recommended offer: $203k (22.4% below list) — sets the bar for 1% rule.
- Cap rate 5.3% vs local median 3.4% in Wethersfield — top-decile yield for the area; either an underpriced asset or a hidden risk that comps aren't pricing in. Stress-test before assuming the spread holds.
Location & tenants
- Location reads 78/100 on livability (#37 in CT, #2,561 nationally) — a middle-class / working-renter tenant base. Strengths: crime A+, employment A+, housing A+; Watch: amenities F, commute F.
- Rocky Hill School District (suburban): math 59% / reading 67% proficiency, ranked #34 of 153 in CT (top 22%) — acceptable for families but not a draw, mixed tenant base, ~2y average lease; only 10% free/reduced lunch — higher-income household profile.
- Zoned schools: Myrtle H. Stevens School (math 62% / reading 57%, grade B-, #159 of 553 statewide, top 31%, 410 students, 23% FRL); Albert D. Griswold Middle School (math 55% / reading 70%, grade B+, #36 of 175 statewide, top 21%, 633 students, 20% FRL); Rocky Hill High School (math 57% / reading 77%, grade B, #26 of 194 statewide, top 16%, 722 students, 21% FRL).
- Market conditions: Rents rising (+3.4%/yr); 56 active listings in the ZIP; 8 comparable units currently listed for rent nearby; rentals leasing fast (median 4d on market — plan ~1-2 weeks tenant-placement turnaround); solid renter incomes; 1,867 units permitted in Capitol Planning Region in 2024 (1,399 in 5+ unit buildings).
Forward outlook
- Local home prices are declining (-3.0%/yr); year-one equity from $2k of loan paydown is wiped out by about $8k of value loss. Plan a longer hold.
Negotiation context
- It's been on market 59 days — a 3% lower offer ($254k) is reasonable based on typical stale-listing flexibility.
Risks & watch-outs
- Watch-outs: built in 1830 — expect roof / HVAC / electrical / plumbing capex.
Questions for the listing agent
- What do current leases actually rent for vs. the listed asking? Can we see a recent rent roll and the last 12 months of T-12 income?
- It's been on market 59 days. Have you received any prior offers? Is the seller open to a 22% concession, seller financing, or rate buy-down credit?
- Built in 1830 — when were the roof, HVAC, electrical panel, plumbing, and water heater last replaced?
- Is there a deadline driving the sale (1031 exchange, divorce, estate, relocation)? That informs how much negotiation room exists.
- Schools are B-rated — typically a magnet for longer-tenancy family renters. What's the average tenant stay here, and is there a school-zone premium baked into asking?
- The area grade is low — what's the realistic commute time and amenity access for the typical tenant pool here? Any planned neighborhood developments (good or bad) we should know about?
- What's the average days-on-market for RENTAL listings here right now (not sales)? A rising rental-DOM trend means longer vacancies and softer asking-rent achievability than the comps imply.
- What's the recent tenant-quality profile in this submarket — average credit score on applications, eviction rate, late-payment / NSF rate, and stable-employment percentage? A property-management company in the area should have these aggregated.
- How much new for-sale + rental construction is in the pipeline within 1–3 miles? Heavy new supply typically softens prices + rents 12–24 months out; constrained supply supports both.
Investment metrics
- 1% rule
- 0.78% ✗
- Cap rate
- 5.29%
- Cash-on-cash
- -3.58%
- DSCR
- 0.84
- GRM
- 10.7
CMA / ARV
- ARV (median comp)
- $350,642
- List price
- $261,900
- Delta
- -25.31%
- Verdict
- UNDERPRICED
- Comps
- 20 within 1.0 mi
Show comp detail 11 sales within ~0.75 mi
| Address | Dist | Beds/Ba | Sqft | Sold | Price | $/sf | Match |
|---|---|---|---|---|---|---|---|
| 2843 Main St | 0.24mi | 2/1.5 | 1,298 (-4%) | 0mo | $350,000 | $270 | 80 |
| 1 Hillside Ave | 0.28mi | 3/1.0 (+1) | 1,315 (-3%) | 5mo | $355,000 | $270 | 73 |
| 55 Dividend Rd | 0.38mi | 3/1.5 (+1) | 1,352 (-0%) | 11mo | $340,000 | $251 | 66 |
| 2773 Main St | 0.10mi | 2/2.0 | 1,192 (-12%) | 23mo | $260,000 | $218 | 52 |
| 2991 Main St | 0.52mi | 3/1.0 (+1) | 1,298 (-4%) | 22mo | $310,000 | $239 | 46 |
| 40 Grimes Rd | 0.44mi | 3/2.0 (+1) | 1,530 (+13%) | 6mo | $380,000 | $248 | 44 |
| 15 Ledge Dr | 0.45mi | 3/2.0 (+1) | 1,536 (+13%) | 5mo | $350,000 | $228 | 44 |
| 20 Ashwell Ave | 0.57mi | 3/2.0 (+1) | 1,536 (+13%) | 2mo | $405,000 | $264 | 41 |
| 30 Elm St | 0.67mi | 3/2.0 (+1) | 1,440 (+6%) | 14mo | $365,000 | $253 | 37 |
| 14 Oak Hill Rd | 0.51mi | 3/1.5 (+1) | 1,224 (-10%) | 20mo | $325,000 | $266 | 36 |
| 3 Westbrook Rd | 0.68mi | 3/2.5 (+1) | 1,288 (-5%) | 23mo | $430,000 | $334 | 30 |
Match score weights: distance 35% · size 25% · config 20% · recency 20%. Top-matched comps best support the ARV.
Projected returns pro-forma
-3.0% appreciation · 3.43% rent growth · sell at horizon
- IRR
- -21.8%
- Equity multiple
- 0.24×
- Total profit
- $-55,446
- Equity at exit
- $39,050
- IRR
- -14.6%
- Equity multiple
- 0.15×
- Total profit
- $-62,399
- Equity at exit
- $22,644
Cash invested: $73,332 (down + closing). Projections, not guarantees.
Landlord ↔ Tenant lean methodology
- Overall (STATE)
- 27 Tenant-Leaning
- State Connecticut
- 27 Tenant-Leaning · D+7
- County
- — inherits STATE
- City
- — inherits STATE
ZIP-level market 06067
- Rents YoY
- 3.4%
- Active inventory
- 56
- Price-to-rent
- 10.7×
Monthly cashflow live
- Estimated rent
- $2,034 high interval (Pro) →
- Mortgage (P&I)
- −$1,373
- Tax from tax record
- −$343 /mo · $4,113/yr
- Insurance
- −$109
- HOA
- −$0
- Vacancy / Maint / Mgmt
- −$427
- Net cashflow
- $-219
Break-even live
Sensitivity live
| Price | -10% $-70 | -5% $-145 | +0% $-219 | +5% $-293 | +10% $-367 |
|---|---|---|---|---|---|
| Rent | -10% $-379 | -5% $-299 | +0% $-219 | +5% $-138 | +10% $-58 |
| Rate | -1.0pp $-87 | -0.5pp $-152 | base $-219 | +0.5pp $-287 | +1.0pp $-356 |
UW: 25.0% down · 7.5% · 30yr · 1.5% tax · 5.0% vac · 8.0% maint · 8.0% mgmt
Financing live
Cash to close
- Down payment
- $65,475
- Closing costs
- $7,857
- Reserves months
- —
- Total cash needed
- —
Loan-product check · same deal, 3 products live
Conventional
25% down · 7.5% · 30yr
- Down + closing
- —
- Monthly P&I
- —
- Monthly cashflow
- —
- DSCR
- —
- Eligible?
- —
Personal DTI + credit; lowest rate.
DSCR
20% down · 8.5% · 30yr
- Down + closing
- —
- Monthly P&I
- —
- Monthly cashflow
- —
- DSCR
- —
- Eligible?
- —
No personal income docs; deal must DSCR.
Hard money
10% down · 12.0% · 12mo
- Down + closing
- —
- Monthly P&I
- —
- Monthly cashflow
- —
- DSCR
- —
- Eligible?
- —
Short-term bridge; refi at stabilization.
Rent comps 8 comps
| Address | Beds | Baths | Sqft | Rent | $/sqft | DOM | Units | Dist |
|---|---|---|---|---|---|---|---|---|
| 35 Carillon Dr Unit D Rocky Hill, CT | 2.0 | 1.5 | 938 | $2,100 | $2.24 | 45d | 1 | 0.12mi |
| 108 West St Rocky Hill, CT | 1.0–3.0 | 1.0 | 1094 | $2,032 | $1.86 | 12d | 5 | 0.19mi |
| 35 Grimes Rd Rocky Hill, CT | 1.0–2.0 | 1.0–1.5 | 825 | $1,885 | $2.28 | 3d | 5 | 0.35mi |
| 101 Meyers Dr Rocky Hill, CT | 1.0–2.0 | 1.0–2.0 | 901 | $1,975 | $2.19 | 3d | 3 | 0.43mi |
| 155 Dividend Rd Unit 1 Rocky Hill, CT | 3.0 | 2.0 | 1150 | $2,050 | $1.78 | 3d | 1 | 0.50mi |
| 2418 Main St Rocky Hill, CT | 1.0–2.0 | 1.0–2.0 | 1051 | $3,030 | $2.88 | 3d | 13 | 0.59mi |
| 1401 Harbor View Dr #1401 Rocky Hill, CT | 2.0 | 1.0 | 901 | $1,900 | $2.11 | 3d | 1 | 0.96mi |
| 2139 Silas Deane Hwy Rocky Hill, CT | 1.0–2.0 | 1.0 | 885 | $2,271 | $2.57 | 3d | 6 | 1.04mi |
Listing history 17 events
-
2026-06-21days on market $261,900 Active 59 DOM
-
2026-06-18days on market $261,900 Active 56 DOM
-
2026-06-17days on market $261,900 Active 55 DOM
-
2026-06-16days on market $261,900 Active 54 DOM
-
2026-06-15days on market $261,900 Active 53 DOM
-
2026-06-13days on market $261,900 Active 51 DOM
-
2026-06-10days on market $261,900 Active 48 DOM
-
2026-06-09days on market $261,900 Active 47 DOM
-
2026-06-08days on market $261,900 Active 46 DOM
-
2026-06-07days on market $261,900 Active 45 DOM
-
2026-06-05days on market $261,900 Active 42 DOM
-
2026-06-03days on market $261,900 Active 41 DOM
-
2026-06-02days on market $261,900 Active 40 DOM
-
2026-06-01days on market $261,900 Active 39 DOM
-
2026-05-31days on market $261,900 Active 38 DOM
-
2026-04-24$270,000 Active 1224-char remark
-
2026-04-20historical $270,000 1224-char remark
ⓘ Source: listings_history table (triggers on properties + properties_extension) + one-shot
backfill from property_details.listing_events for pre-trigger history.
Tax reassessment forecast CT · Partial reset (capped growth)
- Current annual tax
- $4,113 · $343/mo
- Projected year-2 tax
- $4,859 · $405/mo
- Expected delta
- +$746/yr (+$62/mo · 18.1%)
ⓘ Screening estimate from a state-policy table — verify with the county assessor before closing.
Nearby sold comps map
Loading sold comps map…
Walkable amenities ~0.75 mi
Loading nearby amenities…
Taxation est. · year 1
- Rental income
- $24,404
- − Mortgage interest
- −$14,670
- − Property taxes
- −$4,113
- − Insurance
- −$1,310
- − Repairs & maintenance
- −$1,952
- − Management
- −$1,952
- − Depreciation
- −$7,619
- Taxable loss
- −$7,213
- Est. tax savings @ 24.0%
- +$1,731
- After-tax cash flow
- $-894/yr
For passive investors: Depreciation is non-cash, so a rental often shows a tax loss while cash-flowing — sheltering income. Rental losses are passive: they offset passive income freely, and up to $25,000/yr can offset ordinary (W-2) income if you actively participate and your MAGI is under $100k (phasing out to $0 by $150k); unused losses carry forward. On sale, claimed depreciation is recaptured at up to 25%, and gains may owe capital-gains tax (a 1031 exchange can defer both). Figures are a year-1 estimate at your 24.0% rate — not tax advice; consult a CPA.
Schools (NCES district)
- District
- Rocky Hill School District
- NCES district ID
- 0903840
- Math proficiency
- 59% ▼ -7.00%
- Reading proficiency
- 67% ▼ -8.00%
- Median HH income
- $75,825
- Composite
- 56.01/100
- National rank
- #1191
- State rank
- #34 of 153 in CT
Livability — Wethersfield
- Score
- 78/100
- State rank
- #37
- US rank
- #2561
Category grades
Schools grade is shown separately in the Schools card above.
Census & demographics
- County
- Hartford County · 754,208 people
- City population
- 27,250
- Metro
- Hartford-East Hartford-Middletown, CT
- Population (ZIP)
- 20,872
- Household income
- $100,027
- Rent vs Own
- Severe rent burden
- 560.0
Population outlook (Capitol County) Hauer SSP2
- By 2040
- 1,063,519
Race, ethnicity, and origin ACS 2023
- Neighborhood character
- Predominantly White (69%)
- Race & ethnicity
- White 69% Asian 14% Hispanic / Latino 8% Two or more races 7% Black 5%
- Hispanic origin (detail)
- Puerto Rican 5%
- Common ancestry
- Romanian 9% Lithuanian 4% Russian 3%
- Foreign-born
- 23% · Canada, China, Jamaica
- Languages at home
- 69% English-only · Other Indo-European 11% Spanish 7% Russian/Polish/Slavic 6%
Political lean MEDSL · Capitol
- 2024 margin
- Strong D (+21.9) · D 60.1% · R 38.2% · Other 1.7%
- All cycles
- 2024: D+21.9
Not yet ingested
- Civics
- —
Market trends
- HPI YoY
- ▼ -188.36%
- Current HPI
- 184.2022
- Rent YoY
- ▲ 3.43%
- Metro
- Hartford-East Hartford-Middletown, CT
- State GDP YoY
- ▲ 1.06%
- F500 in state
- 38
Industry mix (Fortune 500 HQ in CT)
| Industry | F500 HQs | Revenue |
|---|---|---|
| Industrial Machinery | 4 | $38B |
|
||
| Insurance | 3 | $71B |
|
||
| Financial Services | 2 | $25B |
|
||
| Transportation / Logistics | 2 | $18B |
|
||
| Healthcare | 1 | $247B |
|
||
| Telecommunications | 1 | $55B |
|
||
Price history
-3.0% since first listed3 events — show timeline
- 2026-05-26 Price Changed $261,900 Smart MLS
- 2026-04-24 Listed $270,000 Smart MLS
- 2026-04-20 Coming Soon $270,000 Smart MLS
Property tax history
+1.0%/yrLatest (2025): $4,113 · +3.7% YoY. Source: county tax records.
Cash-flow waterfall
monthlySold comps — $/sqft
last 12 mo · ≤1 miLoading sold comps…