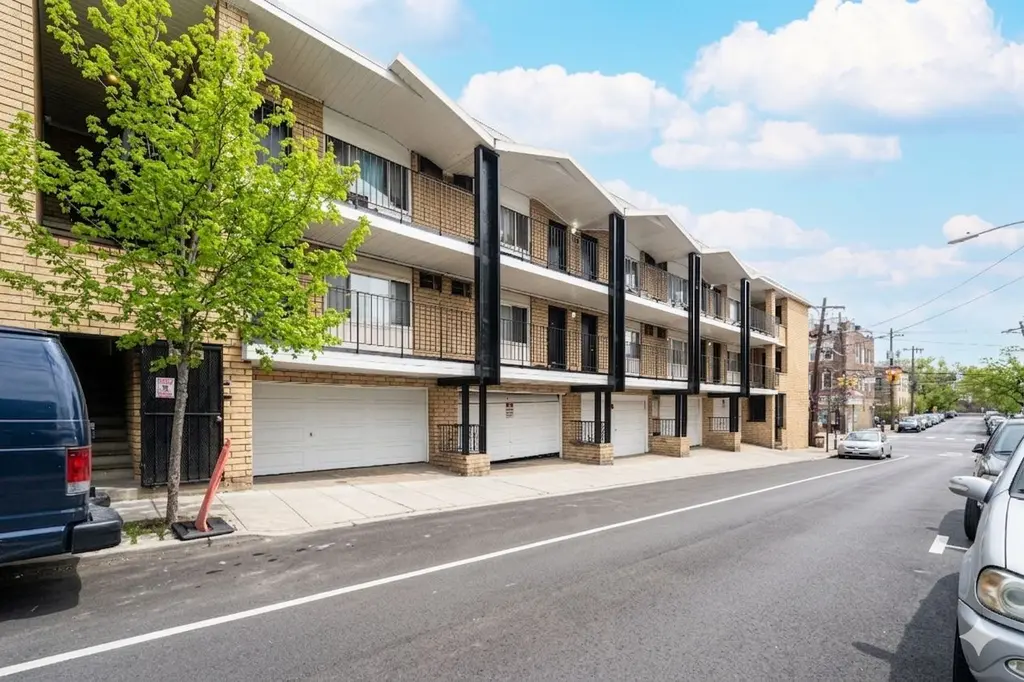
100 35th St #1 · Union City, NJ
Flood risk No data
- FEMA flood zone
- —
- Chance of flooding over 30 yrs
- —
- Est. flood insurance / yr
- —
Fire risk No data
- Est. fire insurance / yr
- —
Heat risk No data
- Hot days now (above threshold)
- —
- Hot days in 30 yrs
- —
Wind risk No data
- Chance of severe wind over 30 yrs
- —
Air-quality risk No data
- Unhealthy air days now
- —
- Unhealthy air days in 30 yrs
- —
Risk factors via First Street. Map © Google.
Why this score? — see what drove the B+ grade
The composite is a weighted blend of 9 inputs, each scored 0–100. Each bar is that input's sub-score; the figure is the points it added to the 100-point composite (weight × sub-score).
- Cash flow +23.8/30.0
- ARV discount +15.0/15.0
- Appreciation +10.0/10.0
- DSCR +7.7/10.0
- 1% rule +6.2/10.0
- Livability +3.9/5.0
- Condition / age +3.8/5.0
- Rent growth +2.7/5.0
- Schools +2.2/10.0
$289,900
🖨 Deal sheet (PDF) 📄 Offer letter ✓ Due diligence
Listing remarks
* * Charming Condo in Union City – 100 35th St * * Welcome to this fantastic investment opportunity, ready for your personal touch! Featuring 3 bedrooms with ample closet space. As you enter the unit there is a welcoming living room and kitchen. Located in a prominent area of Union City. Surrounded by a variety of amazing restaurants, cafes, bakeries and so much more! This exceptional find is great for commuters offering public transportation around the corner. Easy drive to Lincoln Tunnel. This is an ideal starter unit or an addition to your rental portfolio. Street parking only. Buyer is responsible for all certificates required by the town. This is a unique opportunity, schedule
Neighborhood map
What this means for you Summary
Snapshot
- This is a 3-bed/1.0-bath condo listed at $290k. Condition is rated good.
Deal economics
- At list price, monthly cash flow is $556 ($7k/yr) — positive.
- The deal already cash-flows at list — no discount required.
- Meets the 1% rule at list price ($3k rent vs $290k).
- Recommended offer: $273k (6.0% below list) — sets the bar for market timing.
- Cap rate 8.6% vs local median 2.3% in Union City — top-decile yield for the area; either an underpriced asset or a hidden risk that comps aren't pricing in. Stress-test before assuming the spread holds.
Location & tenants
- Location reads 77/100 on livability (#117 in NJ, #2,998 nationally) — a middle-class / working-renter tenant base. Strengths: amenities A+, commute A+, health & safety A; Watch: cost of living F.
- Union City School District (suburban): math 15% / reading 36% proficiency, ranked #399 of 472 in NJ (top 84%) — low school quality limits family demand, transient renter base, plan for 1-2y turnover; 85% free/reduced lunch — lower-income household profile, screen leases tightly.
- Zoned schools: George Washington Elementary School (math 10% / reading 29%, grade F, #1,012 of 1,303 statewide, top 79%, 779 students, 90% FRL); Union Hill Middle School (math 18% / reading 40%, grade F, #321 of 431 statewide, top 77%, 849 students, 91% FRL); Union City High School (math 12% / reading 35%, grade F, #331 of 399 statewide, top 83%, 3,025 students, 83% FRL) — zoned schools at 88% FRL track the district average.
- Market conditions: Rents flat; 228 active listings in the ZIP; 40 comparable units currently listed for rent nearby; rentals at typical pace (median 15d on market — plan ~3-4 weeks tenant-placement turnaround); 5,310 units permitted in Hudson County in 2024 (4,154 in 5+ unit buildings).
- At $3,239/mo this rent would consume 60% of the median local household income ($64k/yr) (locally 6042% of renters already pay >50% of income on rent) — very limited rent-growth headroom before tenants either downsize or default.
Forward outlook
- In year one you build about $31k of equity ($2k loan paydown + $29k appreciation (10.0% local appreciation)).
- Hudson County population projected at +29% by 2050 — long-run rental-demand tailwind backs the buy-and-hold thesis.
- At projected returns (10.0% appreciation + 0.9% rent growth), your $81k cash investment doubles in ~3 years — after that, you're playing with house money.
- By year 2, paydown + projected appreciation supports a ~$50k cash-out refi (75% LTV) — recoverable capital for the next deal without selling this one.
Negotiation context
- It's been on market 66 days — a 6% lower offer ($273k) is reasonable based on typical stale-listing flexibility.
Questions for the listing agent
- It's been on market 66 days. Have you received any prior offers? Is the seller open to a 6% concession, seller financing, or rate buy-down credit?
- Any open or pending special assessments — roof, HVAC, plumbing, elevator, façade? What's the per-unit balance and payoff schedule, and is the seller paying it off at close or rolling it to the buyer?
- Why hasn't it sold? Are there any deal-killer items the seller is aware of (foundation, flood, title, zoning, code violations)?
- Is there a deadline driving the sale (1031 exchange, divorce, estate, relocation)? That informs how much negotiation room exists.
- What's the average days-on-market for RENTAL listings here right now (not sales)? A rising rental-DOM trend means longer vacancies and softer asking-rent achievability than the comps imply.
- What's the recent tenant-quality profile in this submarket — average credit score on applications, eviction rate, late-payment / NSF rate, and stable-employment percentage? A property-management company in the area should have these aggregated.
- How much new apartment / multifamily construction is in the pipeline within 1–3 miles? Heavy new supply (>2% of stock underway) typically softens rents 12–24 months out; light construction supports rent growth.
Investment metrics
- 1% rule
- 1.12% ✓
- Cap rate
- 8.59%
- Cash-on-cash
- 8.22%
- DSCR
- 1.37
- GRM
- 7.5
CMA / ARV
- ARV (median comp)
- $368,812
- List price
- $289,900
- Delta
- -21.40%
- Verdict
- UNDERPRICED
- Comps
- 20 within 1.0 mi
Projected returns pro-forma
10.0% appreciation · 0.89% rent growth · sell at horizon
- IRR
- 29.4%
- Equity multiple
- 3.30×
- Total profit
- $186,595
- Equity at exit
- $261,165
- IRR
- 24.9%
- Equity multiple
- 7.27×
- Total profit
- $509,232
- Equity at exit
- $563,212
Cash invested: $81,172 (down + closing). Projections, not guarantees.
Landlord ↔ Tenant lean methodology
- Overall (STATE)
- 21 Tenant-Leaning
- State New Jersey
- 21 Tenant-Leaning · D+6
- County
- — inherits STATE
- City
- — inherits STATE
ZIP-level market 07087
- Home prices YoY
- 9.6%
- Rents YoY
- 0.9%
- Active inventory
- 228
- Price-to-rent
- 7.5×
Monthly cashflow live
- Estimated rent
- $3,239 high interval (Pro) →
- Mortgage (P&I)
- −$1,520
- Tax est. 1.5%
- −$362 /mo · $4,348/yr
- Insurance
- −$121
- HOA
- −$0
- Vacancy / Maint / Mgmt
- −$680
- Net cashflow
- $556
Break-even live
Sensitivity live
| Price | -10% $756 | -5% $656 | +0% $556 | +5% $456 | +10% $355 |
|---|---|---|---|---|---|
| Rent | -10% $300 | -5% $428 | +0% $556 | +5% $684 | +10% $812 |
| Rate | -1.0pp $702 | -0.5pp $629 | base $556 | +0.5pp $481 | +1.0pp $404 |
UW: 25.0% down · 7.5% · 30yr · 1.5% tax · 5.0% vac · 8.0% maint · 8.0% mgmt
Financing live
Cash to close
- Down payment
- $72,475
- Closing costs
- $8,697
- Reserves months
- —
- Total cash needed
- —
Loan-product check · same deal, 3 products live
Conventional
25% down · 7.5% · 30yr
- Down + closing
- —
- Monthly P&I
- —
- Monthly cashflow
- —
- DSCR
- —
- Eligible?
- —
Personal DTI + credit; lowest rate.
DSCR
20% down · 8.5% · 30yr
- Down + closing
- —
- Monthly P&I
- —
- Monthly cashflow
- —
- DSCR
- —
- Eligible?
- —
No personal income docs; deal must DSCR.
Hard money
10% down · 12.0% · 12mo
- Down + closing
- —
- Monthly P&I
- —
- Monthly cashflow
- —
- DSCR
- —
- Eligible?
- —
Short-term bridge; refi at stabilization.
Rent comps 40 comps
| Address | Beds | Baths | Sqft | Rent | $/sqft | DOM | Units | Dist |
|---|---|---|---|---|---|---|---|---|
| 3611 Park Ave #303 Union City, NJ | 2.0 | 2.0 | 1092 | $3,200 | $2.93 | 1d | 1 | 0.08mi |
| 115 37th St Unit 207 Union City, NJ | 2.0 | 2.0 | 867 | $3,100 | $3.58 | 45d | 1 | 0.09mi |
| 119 Peter St Union City, NJ | 2.0 | 2.0 | 1099 | $3,500 | $3.18 | 15d | 1 | 0.11mi |
| 118 Parkview Ave #2 Weehawken, NJ | 2.0 | 1.0 | 1100 | $3,095 | $2.81 | 15d | 1 | 0.18mi |
| 407 Park Ave Weehawken, NJ | 3.0 | 2.0 | 904 | $3,450 | $3.82 | 1d | 1 | 0.21mi |
| 42 Duer Pl Unit 3 Weehawken Township, NJ | 2.0 | 1.0 | 1000 | $2,600 | $2.60 | 26d | 1 | 0.25mi |
| 318 38th St #301 Union City, NJ | 2.0 | 1.0 | 874 | $2,850 | $3.26 | 45d | 1 | 0.26mi |
| 318 38th St Union City, NJ | 1.0–2.0 | 1.0 | 887 | $2,750 | $3.10 | 13d | 2 | 0.26mi |
| 121 41st St #1 Union City, NJ | 2.0 | 1.0 | 553 | $2,300 | $4.16 | 19d | 1 | 0.28mi |
| 19 Hamilton Ave Weehawken, NJ | 2.0 | 2.0 | 1000 | $4,600 | $4.60 | 22d | 1 | 0.29mi |
| 221 Angelique St Unit 2 Weehawken Township, NJ | 2.0 | 1.0 | 1000 | $2,700 | $2.70 | 12d | 1 | 0.33mi |
| 791 JFK Blvd E Unit 1 Weehawken Township, NJ | 2.0 | 2.0 | 900 | $3,300 | $3.67 | 26d | 1 | 0.34mi |
| 100 Eton Row #603 Weehawken, NJ | 2.0 | 2.0 | 1100 | $5,325 | $4.84 | 8d | 1 | 0.36mi |
| 515 32nd St Union City, NJ | 2.0 | 2.0 | 1125 | $3,200 | $2.84 | 24d | 2 | 0.37mi |
| 125 43rd St Union City, NJ | 2.0 | 2.0 | 1102 | $3,000 | $2.72 | 1d | 6 | 0.37mi |
| 4301 Park Ave Union City, NJ | 1.0–2.0 | 1.0–2.0 | 1007 | $3,500 | $3.47 | 26d | 2 | 0.39mi |
| 4301 Park Ave Union City, NJ | 1.0–2.0 | 1.0–2.0 | 1051 | $3,500 | $3.33 | 45d | 2 | 0.39mi |
| 515 Gregory Ave #3 Weehawken, NJ | 2.0 | 2.0 | 1090 | $2,880 | $2.64 | 9d | 1 | 0.40mi |
| 515 30th St Unit 1C Union City, NJ | 2.0 | 2.0 | 1000 | $3,500 | $3.50 | 9d | 1 | 0.40mi |
| 515 30th St Unit 1B Union City, NJ | 2.0 | 2.0 | 991 | $3,000 | $3.03 | 1d | 1 | 0.40mi |
| 2610 New York Ave Unit 4 Union City, NJ | 2.0 | 1.0 | 900 | $2,300 | $2.56 | 45d | 1 | 0.40mi |
| 5 Port Imperial Blvd Weehawken Township, NJ | 1.0–2.0 | 1.0–2.0 | 809 | $7,418 | $9.16 | 1d | 30 | 0.41mi |
| 123 44th St Union City, NJ | 1.0–3.0 | 1.0–2.0 | 1121 | $3,820 | $3.41 | 5d | 11 | 0.42mi |
| 530 40th St Unit 2nd Fl Union City, NJ | 2.0 | 1.0 | 850 | $2,200 | $2.59 | 45d | 1 | 0.47mi |
| 224 Oak St Unit 2 Weehawken Township, NJ | 2.0 | 1.0 | 900 | $2,650 | $2.94 | 1d | 1 | 0.49mi |
| 125 Oak St Unit 1 Weehawken Township, NJ | 2.0 | 2.0 | 1100 | $3,708 | $3.37 | 15d | 1 | 0.49mi |
| 29 Cooper Pl Unit 3 Weehawken Township, NJ | 2.0 | 1.0 | 1100 | $2,300 | $2.09 | 9d | 1 | 0.51mi |
| 1500 Avenue At Port Imperial Weehawken, NJ | 2.0 | 1.0–2.0 | 914 | $5,249 | $5.74 | 0d | 20 | 0.52mi |
| 1300 Avenue At Port Imperial Weehawken, NJ | 3.0 | 1.0–2.0 | 968 | $6,134 | $6.33 | 0d | 18 | 0.55mi |
| 77 46th St Unit 21 Weehawken, NJ | 2.0 | 2.0 | 924 | $2,950 | $3.19 | 26d | 1 | 0.56mi |
| 1600 Harbor Blvd Weehawken, NJ | 3.0 | 1.0–2.0 | 998 | $7,738 | $7.75 | 5d | 12 | 0.59mi |
| 801 Harbor Blvd Unit 1010c Weehawken, NJ | 2.0 | 2.0 | 1100 | $4,110 | $3.74 | 26d | 1 | 0.59mi |
| 801 Harbor Blvd Unit 903C Weehawken, NJ | 2.0 | 2.0 | 1100 | $4,590 | $4.17 | 26d | 1 | 0.59mi |
| 1100 Avenue At Port Imperial Weehawken, NJ | 3.0 | 1.0–2.0 | 924 | $7,515 | $8.13 | 0d | 19 | 0.59mi |
| 47 47th St #6 Weehawken, NJ | 2.0 | 1.0 | 939 | $3,450 | $3.67 | 9d | 1 | 0.61mi |
| 804 27th ST #2 | 2.0 | 1.0 | 900 | $2,200 | $2.44 | 26d | 1 | 0.62mi |
| 2105 New York Ave Unit Basement Union City, NJ | 2.0 | 1.0 | 700 | $2,100 | $3.00 | 45d | 1 | 0.63mi |
| 900 Ave At Port Imperial Blvd Weehawken, NJ | 2.0 | 1.0–2.0 | 791 | $6,320 | $7.98 | 1d | 25 | 0.64mi |
| 4206 Smith Ave Unit 1 North Bergen, NJ | 2.0 | 1.0 | 900 | $2,100 | $2.33 | 9d | 1 | 0.67mi |
| 4614 John F. Kennedy Blvd Unit 403 Union City, NJ | 2.0 | 1.0 | 925 | $3,595 | $3.89 | 26d | 1 | 0.73mi |
HOA detail condo
- Monthly dues
- $0 · $0/yr
- Assessments
- None detected in remarks — confirm with the listing agent.
Listing history 15 events
-
2026-06-21days on market $289,900 Coming Soon 66 DOM
-
2026-06-18days on market $289,900 Coming Soon 63 DOM
-
2026-06-17days on market $289,900 Coming Soon 62 DOM
-
2026-06-16days on market $289,900 Coming Soon 61 DOM
-
2026-06-15days on market $289,900 Coming Soon 60 DOM
-
2026-06-13days on market $289,900 Coming Soon 58 DOM
-
2026-06-13days on market $289,900 Coming Soon 57 DOM
-
2026-06-09days on market $289,900 Coming Soon 54 DOM
-
2026-06-08days on market $289,900 Coming Soon 53 DOM
-
2026-06-07days on market $289,900 Coming Soon 52 DOM
-
2026-06-04days on market $289,900 Coming Soon 49 DOM
-
2026-06-03days on market $289,900 Coming Soon 48 DOM
-
2026-06-02days on market $289,900 Coming Soon 47 DOM
-
2026-06-01days on market $289,900 Coming Soon 46 DOM
-
2026-05-31days on market $289,900 Coming Soon 45 DOM
ⓘ Source: listings_history table (triggers on properties + properties_extension) + one-shot
backfill from property_details.listing_events for pre-trigger history.
Nearby sold comps map
Loading sold comps map…
Walkable amenities ~0.75 mi
Loading nearby amenities…
Taxation est. · year 1
- Rental income
- $38,874
- − Mortgage interest
- −$16,239
- − Property taxes
- −$4,348
- − Insurance
- −$1,450
- − Repairs & maintenance
- −$3,110
- − Management
- −$3,110
- − Depreciation
- −$8,433
- Taxable income
- $2,183
- Est. tax owed @ 24.0%
- −$524
- After-tax cash flow
- $6,145/yr
For passive investors: Depreciation is non-cash, so a rental often shows a tax loss while cash-flowing — sheltering income. Rental losses are passive: they offset passive income freely, and up to $25,000/yr can offset ordinary (W-2) income if you actively participate and your MAGI is under $100k (phasing out to $0 by $150k); unused losses carry forward. On sale, claimed depreciation is recaptured at up to 25%, and gains may owe capital-gains tax (a 1031 exchange can defer both). Figures are a year-1 estimate at your 24.0% rate — not tax advice; consult a CPA.
Condition & rehab AI · 12 photos
This charming townhouse is in good condition with cosmetic updates needed to enhance its curb appeal and interior aesthetics. The property is located in a desirable area with easy access to public transportation and amenities.
Value-add opportunities
- Both Paint the interior walls and cabinets — Fresh paint enhances curb appeal and interior aesthetics
- Both Replace the countertops with quartz or granite — Quartz or granite countertops are durable and add value
- Both Install new flooring in the kitchen and bathrooms — New flooring can improve the overall look and feel of the home
- Both Upgrade the HVAC system — A new HVAC system can improve comfort and energy efficiency
- Both Landscaping improvements — Well-maintained landscaping can enhance curb appeal and property value
Renovation cost estimate screening
Value-add ROI direction
- Both Paint the interior walls and cabinets — Fresh paint enhances curb appeal and interior aesthetics ↑
- Both Replace the countertops with quartz or granite — Quartz or granite countertops are durable and add value ↑
- Both Install new flooring in the kitchen and bathrooms — New flooring can improve the overall look and feel of the home ↑
- Both Upgrade the HVAC system — A new HVAC system can improve comfort and energy efficiency ↑
- Both Landscaping improvements — Well-maintained landscaping can enhance curb appeal and property value ↑
ⓘ Cost ranges are severity-bucket heuristics (US national rule-of-thumb). Get contractor quotes + a written scope before underwriting a rehab budget.
Schools (NCES district)
- District
- Union City School District
- NCES district ID
- 3416380
- Math proficiency
- 15% ▼ -19.00%
- Reading proficiency
- 36% ▼ -19.00%
- Median HH income
- $41,210
- Composite
- 21.55/100
- National rank
- #8312
- State rank
- #399 of 472 in NJ
Livability — Union City
- Score
- 77/100
- State rank
- #117
- US rank
- #2998
Category grades
Schools grade is shown separately in the Schools card above.
Census & demographics
- Census place
- Union City, NJ
- County
- Hudson County · 718,323 people
- City population
- 66,463
- Metro
- New York-Newark-Jersey City, NY-NJ-PA
- Population (ZIP)
- 66,463
- Household income
- $64,310
- Rent vs Own
- Severe rent burden
- 6042.0
Population outlook (Hudson County) Hauer SSP2
- Today (2025)
- 771,834 people
- By 2030
- 818,028 · +6.0%
- By 2040
- 907,866 · +17.6%
- By 2050
- 994,480 · +28.8%
- By 2075
- 1,163,301 · +50.7%
- By 2100
- 1,254,703 · +62.6%
Race, ethnicity, and origin ACS 2023
- Neighborhood character
- Predominantly Hispanic (82%)
- Race & ethnicity
- Hispanic / Latino 82% Two or more races 28% White 10% Asian 4% Black 3% Native American 2%
- Hispanic origin (detail)
- Mexican 7% Puerto Rican 8% Cuban 9% Dominican 17%
- Foreign-born
- 55% · Canada, Jamaica, China
- Languages at home
- 18% English-only · Spanish 74% Other Indo-European 2% Arabic 1%
Political lean MEDSL · Hudson
- 2024 margin
- Strong D (+28.1) · D 62.6% · R 34.6% · Other 2.8%
- 2008→2024 swing
- -18.7pp toward R · 2008: 46.7pp · 2024: 28.1pp
- All cycles
- 2024: D+28.1 2020: D+46.2 2016: D+51.8 2012: D+55.7 2008: D+46.7
Not yet ingested
- Civics
- —
Market trends
- HPI YoY
- ▲ 52.10%
- Current HPI
- 597.8126
- Rent YoY
- ▲ 0.89%
- Metro
- New York-Newark-Jersey City, NY-NJ-PA
- State GDP YoY
- ▲ 2.05%
- F500 in state
- 34
Industry mix (Fortune 500 HQ in NJ)
| Industry | F500 HQs | Revenue |
|---|---|---|
| Consumer Goods | 3 | $31B |
|
||
| Pharmaceuticals | 2 | $153B |
|
||
| Technology | 2 | $21B |
|
||
| Insurance | 2 | $20B |
|
||
| Healthcare | 2 | $19B |
|
||
| Financial Services | 1 | $70B |
|
||
Cash-flow waterfall
monthlySold comps — $/sqft
last 12 mo · ≤1 miLoading sold comps…