1104 Poseidon Dr · Portland, TX
Flood risk No data
- FEMA flood zone
- —
- Chance of flooding over 30 yrs
- —
- Est. flood insurance / yr
- —
Fire risk No data
- Est. fire insurance / yr
- —
Heat risk No data
- Hot days now (above threshold)
- —
- Hot days in 30 yrs
- —
Wind risk No data
- Chance of severe wind over 30 yrs
- —
Air-quality risk No data
- Unhealthy air days now
- —
- Unhealthy air days in 30 yrs
- —
Risk factors via First Street. Map © Google.
Why this score? — see what drove the D+ grade
The composite is a weighted blend of 9 inputs, each scored 0–100. Each bar is that input's sub-score; the figure is the points it added to the 100-point composite (weight × sub-score).
- ARV discount +15.0/15.0
- Cash flow +13.3/30.0
- DSCR +4.0/10.0
- Livability +4.0/5.0
- Condition / age +4.0/5.0
- 1% rule +3.8/10.0
- Schools +3.7/10.0
- Rent growth +2.0/5.0
- Appreciation +0.0/10.0
$256,499
🖨 Deal sheet (PDF) 📄 Offer letter ✓ Due diligence
Listing remarks
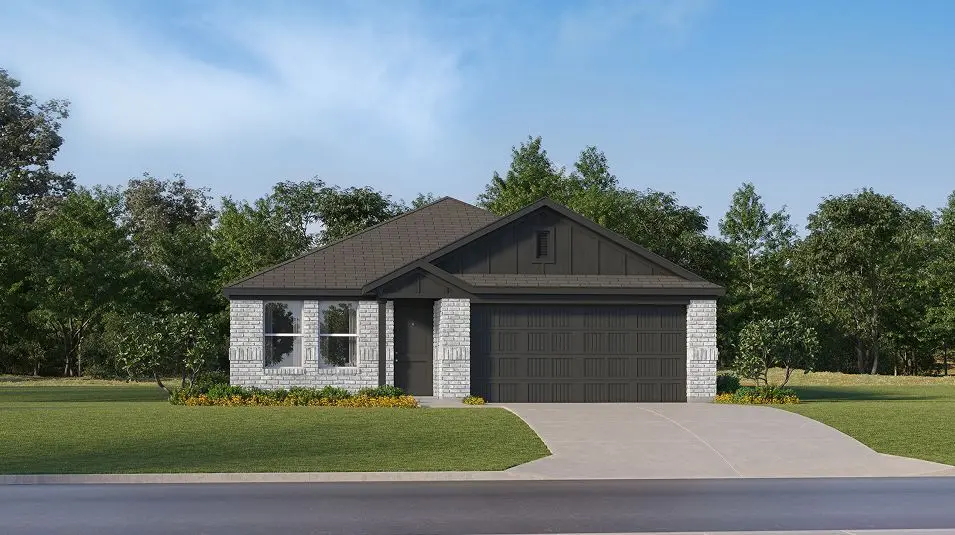
This new single-story design makes smart use of the space available. At the front are all three secondary bedrooms arranged near a convenient full-sized bathroom. Down the foyer is a modern layout connecting a peninsula-style kitchen made for inspired meals, an intimate dining area and a family room ideal for gatherings. Tucked in a quiet corner is the owner's suite with an attached bathroom and walk-in closet.
Key facts
- Intimate dining area
- Walk-in closet
- Single-story design
Tags
Property features AI
Finance
- Financial info: List price $278,999
Exterior
- Parking: 2 garage spaces (2 total parking spaces)
- Home design: Single-family home, Ramsey plan; Active listing
- Exterior features: Property located at 1104 Poseidon Dr, Portland, TX 78374
Interior
- Bedrooms: 4 bedrooms
- Bathrooms: 2 full bathrooms
- Interior features: Spec new construction (Ramsey plan); Living area approximately 1,676
Neighborhood map
What this means for you Summary
Snapshot
- This is a 4-bed/2.0-bath single-family listed at $256k. Condition is rated good.
Deal economics
- At list price, monthly cash flow is $1 ($9/yr) — positive.
- The deal already cash-flows at list — no discount required.
- To meet the 1% rule (rent ≥ 1% of price), the offer needs to be $224k (12.5% below list).
- Recommended offer: $224k (12.5% below list) — sets the bar for 1% rule.
- Cap rate 6.3% vs local median 4.2% in Portland — top-decile yield for the area; either an underpriced asset or a hidden risk that comps aren't pricing in. Stress-test before assuming the spread holds.
Location & tenants
- Location reads 80/100 on livability (#36 in TX, #1,740 nationally) — a professional / high-income tenant draw. Strengths: employment A+, cost of living A+, housing A+; Watch: amenities F, commute F.
- Gregory-Portland ISD (suburban): math 41% / reading 42% proficiency, ranked #314 of 826 in TX (top 38%) — families likely to look elsewhere, expect single-tenant / working-renter base with shorter leases.
- Zoned schools: Andrews El (math 35% / reading 45%, grade F, #1,514 of 4,322 statewide, top 36%, 636 students, 64% FRL); Gregory-Portland Middle (math 43% / reading 39%, grade F, #613 of 1,662 statewide, top 38%, 1,124 students, 48% FRL); Gregory-Portland H S (math 28% / reading 50%, grade F, #859 of 1,632 statewide, top 53%, 1,464 students, 45% FRL).
- Market conditions: Rents soft (-1.8%/yr); 307 active listings in the ZIP; 10 comparable units currently listed for rent nearby; rentals at typical pace (median 16d on market — plan ~3-4 weeks tenant-placement turnaround); solid renter incomes; 344 units permitted in San Patricio County in 2024 (0 in 5+ unit buildings).
- This rent runs 32% of the median local income ($84k/yr) — at the standard rent-burdened threshold; future hikes will face affordability resistance.
Forward outlook
- Local home prices are declining (-3.0%/yr); year-one equity from $2k of loan paydown is wiped out by about $8k of value loss. Plan a longer hold.
- San Patricio County population projected at +27% by 2050 — long-run rental-demand tailwind backs the buy-and-hold thesis.
Negotiation context
- Only 7 days on market — expect competitive offers; lowballing is unlikely to land.
Questions for the listing agent
- Is there a deadline driving the sale (1031 exchange, divorce, estate, relocation)? That informs how much negotiation room exists.
- The area grade is low — what's the realistic commute time and amenity access for the typical tenant pool here? Any planned neighborhood developments (good or bad) we should know about?
- What's the average days-on-market for RENTAL listings here right now (not sales)? A rising rental-DOM trend means longer vacancies and softer asking-rent achievability than the comps imply.
- What's the recent tenant-quality profile in this submarket — average credit score on applications, eviction rate, late-payment / NSF rate, and stable-employment percentage? A property-management company in the area should have these aggregated.
- How much new for-sale + rental construction is in the pipeline within 1–3 miles? Heavy new supply typically softens prices + rents 12–24 months out; constrained supply supports both.
Investment metrics
- 1% rule
- 0.88% ✗
- Cap rate
- 6.30%
- Cash-on-cash
- 0.01%
- DSCR
- 1.00
- GRM
- 9.5
CMA / ARV
- ARV (on-the-fly)
- $336,876
- Comps found
- 12
Show comp detail 12 sales within ~0.75 mi
| Address | Dist | Beds/Ba | Sqft | Sold | Price | $/sf | Match |
|---|---|---|---|---|---|---|---|
| 1118 Demeter Dr | 0.18mi | 4/2.0 | 1,668 (-0%) | 3mo | $262,000 | $157 | 88 |
| 2131 Artemis Dr | 0.09mi | 3/2.0 (-1) | 1,634 (-2%) | 1mo | $271,999 | $166 | 86 |
| 2137 Artemis Dr | 0.07mi | 3/2.0 (-1) | 1,634 (-2%) | 4mo | $300,999 | $184 | 85 |
| 2107 Fury | 0.25mi | 4/2.0 | 1,746 (+4%) | 2mo | $324,990 | $186 | 80 |
| 2103 Fury | 0.27mi | 3/2.0 (-1) | 1,595 (-5%) | 2mo | $319,990 | $201 | 73 |
| 1111 Poseidon Dr | 0.06mi | 3/2.0 (-1) | 1,474 (-12%) | 1mo | $236,999 | $161 | 72 |
| 1815 Clapper Rail Dr | 0.60mi | 3/2.0 (-1) | 1,795 (+7%) | 3mo | $384,900 | $214 | 52 |
| 1812 White Ibis Dr | 0.61mi | 3/2.0 (-1) | 1,817 (+8%) | 2mo | $379,900 | $209 | 51 |
| 1818 Spoonbill Dr | 0.57mi | 3/2.0 (-1) | 1,817 (+8%) | 4mo | $380,000 | $209 | 51 |
| 1814 White Ibis Dr | 0.62mi | 4/3.0 | 1,817 (+8%) | 5mo | $384,900 | $212 | 49 |
| 2007 Cottonwood Dr | 0.69mi | 4/3.5 | 1,787 (+7%) | 5mo | $271,000 | $152 | 47 |
| 1816 Clapper Rail Dr | 0.59mi | 3/2.0 (-1) | 1,896 (+13%) | 1mo | $399,900 | $211 | 45 |
Match score weights: distance 35% · size 25% · config 20% · recency 20%. Top-matched comps best support the ARV.
Projected returns pro-forma
-3.0% appreciation · 0.0% rent growth · sell at horizon
- IRR
- -19.7%
- Equity multiple
- 0.33×
- Total profit
- $-48,059
- Equity at exit
- $38,245
- IRR
- -20.7%
- Equity multiple
- 0.07×
- Total profit
- $-67,070
- Equity at exit
- $22,177
Cash invested: $71,820 (down + closing). Projections, not guarantees.
Landlord ↔ Tenant lean methodology
- Overall (STATE)
- 87 Strongly Landlord-Friendly
- State Texas
- 87 Strongly Landlord-Friendly · R+5
- County
- — inherits STATE
- City
- — inherits STATE
ZIP-level market 78374
- Rents YoY
- -1.8%
- Active inventory
- 307
- Price-to-rent
- 9.5×
Monthly cashflow live
- Estimated rent
- $2,245 high interval (Pro) →
- Mortgage (P&I)
- −$1,345
- Tax est. 1.5%
- −$321 /mo · $3,847/yr
- Insurance
- −$107
- HOA
- −$0
- Vacancy / Maint / Mgmt
- −$471
- Net cashflow
- $1
Break-even live
Sensitivity live
| Price | -10% $178 | -5% $89 | +0% $1 | +5% $-88 | +10% $-176 |
|---|---|---|---|---|---|
| Rent | -10% $-177 | -5% $-88 | +0% $1 | +5% $89 | +10% $178 |
| Rate | -1.0pp $130 | -0.5pp $66 | base $1 | +0.5pp $-66 | +1.0pp $-133 |
UW: 25.0% down · 7.5% · 30yr · 1.5% tax · 5.0% vac · 8.0% maint · 8.0% mgmt
Financing live
Cash to close
- Down payment
- $64,125
- Closing costs
- $7,695
- Reserves months
- —
- Total cash needed
- —
Loan-product check · same deal, 3 products live
Conventional
25% down · 7.5% · 30yr
- Down + closing
- —
- Monthly P&I
- —
- Monthly cashflow
- —
- DSCR
- —
- Eligible?
- —
Personal DTI + credit; lowest rate.
DSCR
20% down · 8.5% · 30yr
- Down + closing
- —
- Monthly P&I
- —
- Monthly cashflow
- —
- DSCR
- —
- Eligible?
- —
No personal income docs; deal must DSCR.
Hard money
10% down · 12.0% · 12mo
- Down + closing
- —
- Monthly P&I
- —
- Monthly cashflow
- —
- DSCR
- —
- Eligible?
- —
Short-term bridge; refi at stabilization.
Rent comps 10 comps
| Address | Beds | Baths | Sqft | Rent | $/sqft | DOM | Units | Dist |
|---|---|---|---|---|---|---|---|---|
| 1203 Athena Dr Portland, TX | 3.0 | 2.0 | 1535 | $2,400 | $1.56 | 15d | 1 | 0.13mi |
| 2012 Cottonwood Dr Portland, TX | 4.0 | 2.0 | 1619 | $2,350 | $1.45 | 23d | 1 | 0.63mi |
| 2112 Westwood Dr Portland, TX | 4.0 | 3.5 | 1863 | $2,350 | $1.26 | 15d | 1 | 0.67mi |
| 6736 Buddy Ganem Dr Portland, TX | 3.0 | 2.0 | 1216 | $1,595 | $1.31 | 23d | 1 | 0.71mi |
| 1801 Atascosa Dr Portland, TX | 3.0 | 2.0 | 1594 | $1,600 | $1.00 | 15d | 1 | 0.91mi |
| 1601 Moore Ave Portland, TX | 2.0–3.0 | 2.0–2.5 | 1295 | $1,899 | $1.47 | 15d | 18 | 0.99mi |
| 1719 Austin St Portland, TX | 3.0 | 1.5 | 1127 | $1,550 | $1.38 | 46d | 1 | 1.15mi |
| 1506 Briar St Portland, TX | 3.0 | 2.0 | 1803 | $2,300 | $1.28 | 45d | 1 | 1.24mi |
| 2201 Timberline Dr Unit Na Portland, TX | 4.0 | 2.0 | 1484 | $2,200 | $1.48 | 15d | 1 | 1.35mi |
| 1825 Billy G Webb Portland, TX | 1.0–3.0 | 1.0–2.0 | 1009 | $1,983 | $1.97 | 15d | 32 | 1.50mi |
Listing history 6 events
-
2026-06-07pricedays on market $256,499 Active 7 DOM
-
2026-06-03days on market $259,499 Active 3 DOM
-
2026-06-03price $259,499 Active 2 DOM
-
2026-06-02days on market $278,999 Active 2 DOM
-
2026-05-31remarks 414-char remark
-
2026-05-31$278,999 Active 1 DOM
ⓘ Source: listings_history table (triggers on properties + properties_extension) + one-shot
backfill from property_details.listing_events for pre-trigger history.
Nearby sold comps map
Loading sold comps map…
Walkable amenities ~0.75 mi
Loading nearby amenities…
Taxation est. · year 1
- Rental income
- $26,938
- − Mortgage interest
- −$14,368
- − Property taxes
- −$3,847
- − Insurance
- −$1,282
- − Repairs & maintenance
- −$2,155
- − Management
- −$2,155
- − Depreciation
- −$7,462
- Taxable loss
- −$4,332
- Est. tax savings @ 24.0%
- +$1,040
- After-tax cash flow
- $1,049/yr
For passive investors: Depreciation is non-cash, so a rental often shows a tax loss while cash-flowing — sheltering income. Rental losses are passive: they offset passive income freely, and up to $25,000/yr can offset ordinary (W-2) income if you actively participate and your MAGI is under $100k (phasing out to $0 by $150k); unused losses carry forward. On sale, claimed depreciation is recaptured at up to 25%, and gains may owe capital-gains tax (a 1031 exchange can defer both). Figures are a year-1 estimate at your 24.0% rate — not tax advice; consult a CPA.
Condition & rehab AI · 12 photos
This single-story home is in good condition with a modern design and well-maintained exterior. It offers a good balance of functionality and style, making it an attractive option for both buyers and renters. Potential value can be further increased with minor updates to the exterior and interior.
Value-add opportunities
- Both Painting the exterior and interior walls — Fresh paint can enhance curb appeal and interior aesthetics.
- Both Updating the flooring to a more modern style — Modern flooring can improve the overall look and feel of the home.
- Both Upgrading the kitchen appliances to a more modern style — Modern appliances can make the kitchen more functional and appealing to potential buyers/renters.
- Both Adding smart home features — Smart home features can increase the home's value and appeal to tech-savvy buyers/renters.
- Both Landscaping improvements — Enhanced landscaping can improve curb appeal and add value to the home.
Renovation cost estimate screening
Value-add ROI direction
- Both Painting the exterior and interior walls — Fresh paint can enhance curb appeal and interior aesthetics. ↑
- Both Updating the flooring to a more modern style — Modern flooring can improve the overall look and feel of the home. ↑
- Both Upgrading the kitchen appliances to a more modern style — Modern appliances can make the kitchen more functional and appealing to potential buyers/renters. ↑
- Both Adding smart home features — Smart home features can increase the home's value and appeal to tech-savvy buyers/renters. ↑
- Both Landscaping improvements — Enhanced landscaping can improve curb appeal and add value to the home. ↑
ⓘ Cost ranges are severity-bucket heuristics (US national rule-of-thumb). Get contractor quotes + a written scope before underwriting a rehab budget.
Schools (NCES district)
- District
- Gregory-Portland ISD
- NCES district ID
- 4821780
- Math proficiency
- 41% ▼ -15.00%
- Reading proficiency
- 42% ▼ -9.00%
- Median HH income
- $59,135
- Composite
- 36.62/100
- National rank
- #4622
- State rank
- #314 of 826 in TX
Livability — Portland
- Score
- 80/100
- State rank
- #36
- US rank
- #1740
Category grades
Schools grade is shown separately in the Schools card above.
Census & demographics
- Census place
- Portland, TX
- County
- San Patricio County · 31,224 people
- City population
- 20,408
- Metro
- Corpus Christi, TX
- Population (ZIP)
- 20,408
- Household income
- $83,504
- Rent vs Own
- Severe rent burden
- 523.0
Population outlook (San Patricio County) Hauer SSP2
- Today (2025)
- 75,538 people
- By 2030
- 79,575 · +5.3%
- By 2040
- 87,670 · +16.1%
- By 2050
- 96,107 · +27.2%
- By 2075
- 117,984 · +56.2%
- By 2100
- 130,010 · +72.1%
Race, ethnicity, and origin ACS 2023
- Neighborhood character
- Diverse neighborhood (Simpson 0.57)
- Race & ethnicity
- White 51% Hispanic / Latino 41% Two or more races 19% Asian 2% Black 2%
- Hispanic origin (detail)
- Mexican 35% Cuban 2%
- Common ancestry
- Lithuanian 2% Slovak 2% Estonian 1%
- Foreign-born
- 7% · Canada
- Languages at home
- 79% English-only · Spanish 18% Other Indo-European 2% Tagalog/Filipino 0%
Political lean MEDSL · San Patricio
- 2024 margin
- Solid R (+36.4) · D 31.4% · R 67.8%
- 2008→2024 swing
- -19.8pp toward R · 2008: -16.6pp · 2024: -36.4pp
- All cycles
- 2024: R+36.4 2020: R+29.1 2016: R+24.1 2012: R+20.6 2008: R+16.6
Not yet ingested
- Civics
- —
Market trends
- HPI YoY
- ▼ -227.28%
- Current HPI
- 166.5529
- Rent YoY
- ▼ -1.84%
- Metro
- Corpus Christi, TX
- State GDP YoY
- ▲ 3.95%
- F500 in state
- 110
Industry mix (Fortune 500 HQ in TX)
| Industry | F500 HQs | Revenue |
|---|---|---|
| Energy | 16 | $1,198B |
|
||
| Technology | 5 | $198B |
|
||
| Engineering / Construction | 4 | $72B |
|
||
| Energy Services | 3 | $60B |
|
||
| Utilities | 3 | $41B |
|
||
| Healthcare | 2 | $330B |
|
||
Cash-flow waterfall
monthlySold comps — $/sqft
last 12 mo · ≤1 miLoading sold comps…