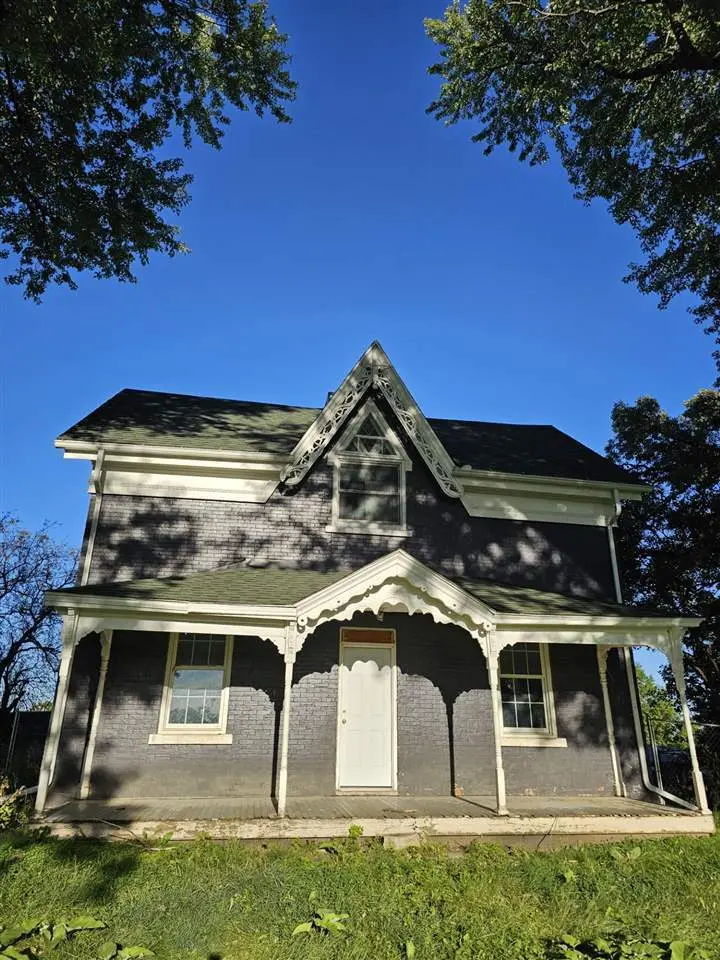
103 N Oak St · Anamosa, IA
Flood risk 1/10 · Minimal
- FEMA flood zone
- X (unshaded)
- Chance of flooding over 30 yrs
- 0.0%
- Est. flood insurance / yr
- $473 – $860
Fire risk 3/10 · Minor
- Est. fire insurance / yr
- $902 – $1,676
Heat risk 3/10 · Minor
- Hot days now (above 102°F)
- 7 days/yr
- Hot days in 30 yrs
- 15 days/yr
Wind risk 2/10 · Minimal
- Chance of severe wind over 30 yrs
- —
Air-quality risk 2/10 · Minimal
- Unhealthy air days now
- 1 days/yr
- Unhealthy air days in 30 yrs
- 1 days/yr
Risk factors via First Street. Map © Google.
Why this score? — see what drove the B grade
The composite is a weighted blend of 9 inputs, each scored 0–100. Each bar is that input's sub-score; the figure is the points it added to the 100-point composite (weight × sub-score).
- Cash flow +27.3/30.0
- ARV discount +15.0/15.0
- DSCR +9.5/10.0
- 1% rule +8.1/10.0
- Schools +5.4/10.0
- Livability +3.7/5.0
- Rent growth +2.5/5.0
- Condition / age +2.5/5.0
- Appreciation +0.0/10.0
$109,700
🖨 Deal sheet 📄 Offer letter ✓ Due diligence
Listing remarks MLS
Investor Alert! Priced way under assessed value! Great opportunity here! Square Footage Galore! You won't believe the room inside this sprawling 4 bedroom 2 bath home, each of your children can enjoy an airy, bright bedroom with ample closets and plenty of space. You'll enjoy the living room with walls of windows and charm, see the potential in this established neighborhood, a traditional home with flair. Create value out of this delightful primary located home, if you give it the loving attention it needs. Great opportunity for the right person with plenty of possibilities and room to sprawl out, nice lot, spacious kitchen, vinyl siding, newer roof, lots of space to build your own garage, property sold in as is condition.
Key facts
- Walls of windows
- Newer roof
- Spacious kitchen
Tags
Neighborhood map
What this means for you Summary
Snapshot
- This is a 3-bed/2.0-bath single-family listed at $110k.
Deal economics
- At list price, monthly cash flow is $316 ($4k/yr) — positive.
- The deal already cash-flows at list — no discount required.
- Meets the 1% rule at list price ($1k rent vs $110k).
- Recommended offer: $97k (12.0% below list) — sets the bar for market timing.
- Cap rate 9.8% vs local median 3.3% in Anamosa — top-decile yield for the area; either an underpriced asset or a hidden risk that comps aren't pricing in. Stress-test before assuming the spread holds.
Location & tenants
- Location reads 74/100 on livability (#240 in IA, #4,682 nationally) — a middle-class / working-renter tenant base. Strengths: crime A+, cost of living A+, housing A+; Watch: amenities F, commute F, employment F.
- Anamosa Community School District (town): math 62% / reading 65% proficiency, ranked #210 of 289 in IA (top 73%) — acceptable for families but not a draw, mixed tenant base, ~2y average lease.
- Market conditions: 47 active listings in the ZIP; 25 units permitted in Jones County in 2024 (0 in 5+ unit buildings).
Forward outlook
- Local home prices are declining (-3.0%/yr); year-one equity from $758 of loan paydown is wiped out by about $3k of value loss. Plan a longer hold.
- Jones County population projected to shrink 8% by 2050 — rents likely to lag national; underwrite the cash flow, not the appreciation.
- At projected returns (-3.0% appreciation + 3.0% rent growth), your $31k cash investment doubles in ~10 years — after that, you're playing with house money.
Negotiation context
- It's been on market 163 days — a 12% lower offer ($97k) is reasonable based on typical stale-listing flexibility.
- 6 sale attempts since 7y ago with the ask held roughly flat each time — persistent listings suggest the price (not the market) is what's stuck; bring a comps-based counter.
Risks & watch-outs
- Watch-outs: built in 1858 — expect roof / HVAC / electrical / plumbing capex.
Questions for the listing agent
- It's been on market 163 days. Have you received any prior offers? Is the seller open to a 12% concession, seller financing, or rate buy-down credit?
- Built in 1858 — when were the roof, HVAC, electrical panel, plumbing, and water heater last replaced?
- Why hasn't it sold? Are there any deal-killer items the seller is aware of (foundation, flood, title, zoning, code violations)?
- Is there a deadline driving the sale (1031 exchange, divorce, estate, relocation)? That informs how much negotiation room exists.
- Schools are B-rated — typically a magnet for longer-tenancy family renters. What's the average tenant stay here, and is there a school-zone premium baked into asking?
- What's the average days-on-market for RENTAL listings here right now (not sales)? A rising rental-DOM trend means longer vacancies and softer asking-rent achievability than the comps imply.
- What's the recent tenant-quality profile in this submarket — average credit score on applications, eviction rate, late-payment / NSF rate, and stable-employment percentage? A property-management company in the area should have these aggregated.
- How much new for-sale + rental construction is in the pipeline within 1–3 miles? Heavy new supply typically softens prices + rents 12–24 months out; constrained supply supports both.
Investment metrics
- 1% rule
- 1.31% ✓
- Cap rate
- 9.75%
- Cash-on-cash
- 12.36%
- DSCR
- 1.55
- GRM
- 6.4
CMA / ARV
- ARV (median comp)
- $181,079
- List price
- $109,700
- Delta
- -39.42%
- Verdict
- UNDERPRICED
- Comps
- 20 within 1.0 mi
Show comp detail 12 sales within ~0.75 mi
| Address | Dist | Beds/Ba | Sqft | Sold | Price | $/sf | Match |
|---|---|---|---|---|---|---|---|
| 611 E 1st St | 0.27mi | 3/2.0 | 1,711 (-1%) | 3mo | $230,000 | $134 | 84 |
| 1102 E 2nd St | 0.21mi | 4/2.0 (+1) | 1,748 (+1%) | 9mo | $229,950 | $132 | 76 |
| 1007 Maquoketa Street St | 0.07mi | 2/2.0 (-1) | 1,837 (+6%) | 8mo | $187,500 | $102 | 75 |
| 504 N Pratt St | 0.33mi | 3/2.0 | 1,626 (-6%) | 1mo | $220,000 | $135 | 74 |
| 114 Therese Ave | 0.56mi | 3/1.5 | 1,704 (-1%) | 4mo | $165,000 | $97 | 66 |
| 718 Dakota St | 0.43mi | 3/2.0 | 1,554 (-10%) | 1mo | $250,000 | $161 | 62 |
| 401 E Pine St | 0.30mi | 2/1.0 (-1) | 1,568 (-9%) | 1mo | $207,000 | $132 | 61 |
| 701 E 1st St | 0.25mi | 3/1.5 | 1,532 (-11%) | 9mo | $171,000 | $112 | 60 |
| 403 Chamber Dr | 0.49mi | 3/2.5 | 1,504 (-13%) | 5mo | $215,000 | $143 | 49 |
| 223 Wilson Ct | 0.54mi | 2/2.5 (-1) | 1,494 (-14%) | 5mo | $259,000 | $173 | 41 |
| 435 Council St | 0.73mi | 3/2.0 | 1,487 (-14%) | 7mo | $355,000 | $239 | 37 |
| 203 E 4th St | 0.64mi | 2/1.5 (-1) | 1,501 (-13%) | 9mo | $100,000 | $67 | 34 |
Match score weights: distance 35% · size 25% · config 20% · recency 20%. Top-matched comps best support the ARV.
Projected returns pro-forma
-3.0% appreciation · 3.0% rent growth · sell at horizon
- IRR
- 2.1%
- Equity multiple
- 1.08×
- Total profit
- $2,427
- Equity at exit
- $16,357
- IRR
- 11.7%
- Equity multiple
- 1.92×
- Total profit
- $28,294
- Equity at exit
- $9,485
Cash invested: $30,716 (down + closing). Projections, not guarantees.
Landlord ↔ Tenant lean methodology
- Overall (STATE)
- 83 Strongly Landlord-Friendly
- State Iowa
- 83 Strongly Landlord-Friendly · R+6
- County
- — inherits STATE
- City
- — inherits STATE
ZIP-level market 52205
- Home prices YoY
- -24.1%
- Active inventory
- 47
- Price-to-rent
- 6.4×
Monthly cashflow live
- Estimated rent
- $1,439 medium interval (Pro) →
- Mortgage (P&I)
- −$575
- Tax from tax record
- −$200 /mo · $2,394/yr
- Insurance
- −$46
- HOA
- −$0
- Vacancy / Maint / Mgmt
- −$302
- Net cashflow
- $316
Break-even live
UW: 25.0% down · 7.5% · 30yr · 1.5% tax · 5.0% vac · 8.0% maint · 8.0% mgmt
Financing live
Cash to close
- Down payment
- $27,425
- Closing costs
- $3,291
- Reserves months
- —
- Total cash needed
- —
Loan-product check · same deal, 3 products live
Conventional
25% down · 7.5% · 30yr
- Down + closing
- —
- Monthly P&I
- —
- Monthly cashflow
- —
- DSCR
- —
- Eligible?
- —
Personal DTI + credit; lowest rate.
DSCR
20% down · 8.5% · 30yr
- Down + closing
- —
- Monthly P&I
- —
- Monthly cashflow
- —
- DSCR
- —
- Eligible?
- —
No personal income docs; deal must DSCR.
Hard money
10% down · 12.0% · 12mo
- Down + closing
- —
- Monthly P&I
- —
- Monthly cashflow
- —
- DSCR
- —
- Eligible?
- —
Short-term bridge; refi at stabilization.
Listing history 33 events
-
2026-06-18days on market $109,700 Active 163 DOM
-
2026-06-17days on market $109,700 Active 162 DOM
-
2026-06-16days on market $109,700 Active 161 DOM
-
2026-06-15days on market $109,700 Active 160 DOM
-
2026-06-13days on market $109,700 Active 158 DOM
-
2026-06-12days on market $109,700 Active 157 DOM
-
2026-06-09days on market $109,700 Active 154 DOM
-
2026-06-08days on market $109,700 Active 153 DOM
-
2026-06-07days on market $109,700 Active 152 DOM
-
2026-06-07days on market $109,700 Active 151 DOM
-
2026-06-04days on market $109,700 Active 148 DOM
-
2026-06-02days on market $109,700 Active 147 DOM
-
2026-06-01days on market $109,700 Active 146 DOM
-
2026-05-31days on market $109,700 Active 145 DOM
-
2026-05-31days on market $109,700 Active 144 DOM
-
2026-01-06$109,700 Active 733-char remark
Show marketing remark (733 chars)
Investor Alert! Priced way under assessed value! Great opportunity here! Square Footage Galore! You won't believe the room inside this sprawling 4 bedroom 2 bath home, each of your children can enjoy an airy, bright bedroom with ample closets and plenty of space. You'll enjoy the living room with walls of windows and charm, see the potential in this established neighborhood, a traditional home with flair. Create value out of this delightful primary located home, if you give it the loving attention it needs. Great opportunity for the right person with plenty of possibilities and room to sprawl out, nice lot, spacious kitchen, vinyl siding, newer roof, lots of space to build your own garage, property sold in as is condition.
-
2025-12-16price $114,700
-
2025-11-01$119,900 Active
-
2025-10-20price $124,900
-
2025-10-01price $129,700
-
2025-09-11price $134,700
-
2025-08-25price $139,700
-
2025-07-23price $144,700
-
2025-06-19$149,700 Active
-
2025-05-10price $154,700
-
2025-04-08price $159,700
-
2025-01-05$164,900 Active
-
2024-09-11price $169,700
-
2024-06-14$176,000 Active
-
2019-11-25soldstatus $135,000
-
2019-11-15soldstatus $135,000
-
2019-09-11$139,900
-
2006-07-21soldstatus $85,500
ⓘ Source: listings_history table (triggers on properties + properties_extension) + one-shot
backfill from property_details.listing_events for pre-trigger history.
Tax reassessment forecast IA · Partial reset (capped growth)
- Current annual tax
- $2,394 · $200/mo
- Projected year-2 tax
- $2,394 · $200/mo
- Expected delta
- $0/yr ($0/mo · 0.0%)
ⓘ Screening estimate from a state-policy table — verify with the county assessor before closing.
Climate risk First Street
- Flood 1/10 Low FEMA zone X (unshaded) · 0% chance over 30 yrs
- Wildfire 3/10 Moderate
- Heat 3/10 Moderate 7 d/yr ≥102°F today · 15 d/yr by 30 yrs out
- Wind 2/10 Low
- Air quality 2/10 Low 1 unhealthy d/yr today · 1 by 30 yrs out
Nearby sold comps map
Loading sold comps map…
Walkable amenities ~0.75 mi
Loading nearby amenities…
Taxation est. · year 1
- Rental income
- $17,267
- − Mortgage interest
- −$6,145
- − Property taxes
- −$2,394
- − Insurance
- −$548
- − Repairs & maintenance
- −$1,381
- − Management
- −$1,381
- − Depreciation
- −$3,191
- Taxable income
- $2,226
- Est. tax owed @ 24.0%
- −$534
- After-tax cash flow
- $3,261/yr
For passive investors: Depreciation is non-cash, so a rental often shows a tax loss while cash-flowing — sheltering income. Rental losses are passive: they offset passive income freely, and up to $25,000/yr can offset ordinary (W-2) income if you actively participate and your MAGI is under $100k (phasing out to $0 by $150k); unused losses carry forward. On sale, claimed depreciation is recaptured at up to 25%, and gains may owe capital-gains tax (a 1031 exchange can defer both). Figures are a year-1 estimate at your 24.0% rate — not tax advice; consult a CPA.
Schools (NCES district)
- District
- Anamosa Community School District
- NCES district ID
- 1903570
- Math proficiency
- 62% ▼ -5.00%
- Reading proficiency
- 65% ▲ 3.00%
- Median HH income
- $51,672
- Composite
- 54.14/100
- National rank
- #1383
- State rank
- #210 of 289 in IA
Livability — Anamosa
- Score
- 74/100
- State rank
- #240
- US rank
- #4682
Category grades
Schools grade is shown separately in the Schools card above.
Census & demographics
- Census place
- Anamosa, IA
- Population (ZIP)
- 8,670
Population outlook (Jones County) Hauer SSP2
- Today (2025)
- 20,023 people
- By 2030
- 19,702 · -1.6%
- By 2040
- 19,007 · -5.1%
- By 2050
- 18,396 · -8.1%
- By 2075
- 17,955 · -10.3%
- By 2100
- 17,448 · -12.9%
Race, ethnicity, and origin ACS 2023
- Neighborhood character
- Predominantly White (91%)
- Race & ethnicity
- White 91% Black 4% Two or more races 2% Hispanic / Latino 2%
- Common ancestry
- Slovak 6% Portuguese 4% Lithuanian 3%
- Foreign-born
- 2% · China
- Languages at home
- 98% English-only · Spanish 1%
Political lean MEDSL · Jones
- 2024 margin
- Strong R (+26.3) · D 36.0% · R 62.3% · Other 1.7%
- 2008→2024 swing
- -36.7pp toward R · 2008: 10.4pp · 2024: -26.3pp
- All cycles
- 2024: R+26.3 2020: R+21.5 2016: R+19.4 2012: D+7.7 2008: D+10.4
Not yet ingested
- Civics
- —
Market trends
- HPI YoY
- ▼ -54.46%
- Current HPI
- 171.5338
- Rent YoY
- —
- Metro
- —
- State GDP YoY
- ▲ 2.48%
- F500 in state
- 4
Industry mix (Fortune 500 HQ in IA)
| Industry | F500 HQs | Revenue |
|---|---|---|
| Financial Services | 1 | $16B |
|
||
| Retail / Convenience | 1 | $15B |
|
||
Price history
+28.3% since first listed18 events — show timeline
- 2026-01-06 Listed $109,700 ICAARMLS
- 2025-12-16 Price Changed $114,700 ICAARMLS
- 2025-11-01 Listed $119,900 ICAARMLS
- 2025-10-20 Price Changed $124,900 ICAARMLS
- 2025-10-01 Price Changed $129,700 ICAARMLS
- 2025-09-11 Price Changed $134,700 ICAARMLS
- 2025-08-25 Price Changed $139,700 ICAARMLS
- 2025-07-23 Price Changed $144,700 ICAARMLS
- 2025-06-19 Listed $149,700 ICAARMLS
- 2025-05-10 Price Changed $154,700 ICAARMLS
- 2025-04-08 Price Changed $159,700 ICAARMLS
- 2025-01-05 Listed $164,900 ICAARMLS
- 2024-09-11 Price Changed $169,700 ICAARMLS
- 2024-06-14 Listed $176,000 ICAARMLS
- 2019-11-25 Sold (Public Records) $135,000 Public Records
- 2019-11-15 Sold (MLS) $135,000 CRAAR, CDRMLS
- 2019-09-11 Listed $139,900 CRAAR, CDRMLS
- 2006-07-21 Sold (Public Records) $85,500 Public Records
Property tax history
+4.0%/yrLatest (2025): $2,394 · +10.2% YoY. Source: county tax records.
Cash-flow waterfall
monthlySold comps — $/sqft
last 12 mo · ≤1 miLoading sold comps…