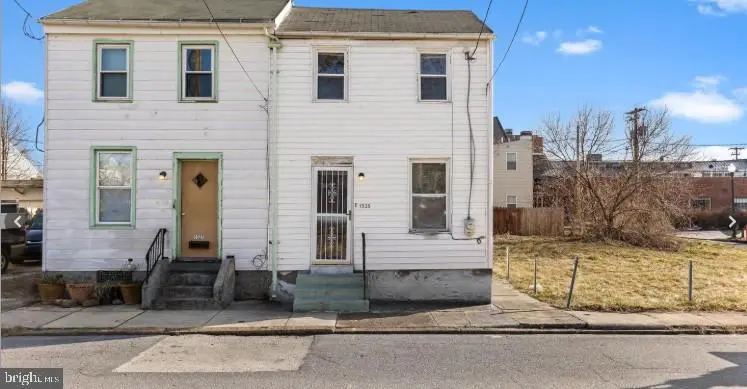
1325 William St · Harrisburg, PA
Flood risk 9/10 · Severe
- FEMA flood zone
- X (unshaded)
- Chance of flooding over 30 yrs
- 0.99%
- Est. flood insurance / yr
- $473 – $860
Fire risk 1/10 · Minimal
- Est. fire insurance / yr
- $511 – $949
Heat risk 6/10 · Moderate
- Hot days now (above 100°F)
- 7 days/yr
- Hot days in 30 yrs
- 15 days/yr
Wind risk 3/10 · Minor
- Chance of severe wind over 30 yrs
- 5.0%
Air-quality risk 2/10 · Minimal
- Unhealthy air days now
- 1 days/yr
- Unhealthy air days in 30 yrs
- 3 days/yr
Risk factors via First Street. Map © Google.
Why this score? — see what drove the B- grade
The composite is a weighted blend of 9 inputs, each scored 0–100. Each bar is that input's sub-score; the figure is the points it added to the 100-point composite (weight × sub-score).
- Cash flow +24.8/30.0
- ARV discount +14.7/15.0
- DSCR +8.0/10.0
- 1% rule +6.5/10.0
- Livability +4.2/5.0
- Rent growth +3.6/5.0
- Condition / age +2.5/5.0
- Schools +0.8/10.0
- Appreciation +0.0/10.0
$140,000
🖨 Deal sheet 📄 Offer letter ✓ Due diligence
Listing remarks MLS
Investor opportunity in central Harrisburg! This home is within walking distance to restaurants, entertainment, and local landmarks like Midtown, the Federal Building, Broad Street Market, Susquehanna Museum, and the movie theatre. Great potential for buyers ready to renovate.
Key facts
- Movie theatre
- Federal building
- Central harrisburg
Tags
Neighborhood map
What this means for you Summary
Snapshot
- This is a 4-bed/1.0-bath single-family listed at $140k.
Deal economics
- At list price, monthly cash flow is $239 ($3k/yr) — positive.
- The deal already cash-flows at list — no discount required.
- Meets the 1% rule at list price ($2k rent vs $140k).
- Recommended offer: $123k (12.0% below list) — sets the bar for market timing.
- Cap rate 8.8% vs local median 6.6% in Harrisburg — top-decile yield for the area; either an underpriced asset or a hidden risk that comps aren't pricing in. Stress-test before assuming the spread holds.
Location & tenants
- Location reads 84/100 on livability (#107 in PA, #826 nationally) — a professional / high-income tenant draw. Strengths: amenities A+, commute A+, cost of living A+; Watch: schools C-, employment D, crime F.
- Harrisburg City SD (urban): math 6% / reading 13% proficiency, ranked #535 of 539 in PA (top 99%) — low school quality limits family demand, transient renter base, plan for 1-2y turnover; 82% free/reduced lunch — lower-income household profile, screen leases tightly.
- Market conditions: Rents rising fast (+4.3%/yr); 58 active listings in the ZIP; 27 comparable units currently listed for rent nearby; rentals lingering (median 44d on market — plan ~5-8 weeks vacancy on turnover, expect pricing pressure); 56% of comp listings sitting > 30 days — soft ceiling on asking rent; 540 units permitted in Dauphin County in 2024 (194 in 5+ unit buildings).
- This rent runs 35% of the median local income ($55k/yr) — at the standard rent-burdened threshold; future hikes will face affordability resistance.
Forward outlook
- Local home prices are declining (-3.0%/yr); year-one equity from $968 of loan paydown is wiped out by about $4k of value loss. Plan a longer hold.
Negotiation context
- It's been on market 153 days — a 12% lower offer ($123k) is reasonable based on typical stale-listing flexibility.
- 4 sale attempts since 2y ago; this cycle's ask has dropped $10k (7%) from the opening price — seller is motivated, your offer sets the floor, not the list.
Risks & watch-outs
- Watch-outs: flood insurance adds $56/mo; built in 1900 — expect roof / HVAC / electrical / plumbing capex.
- Climate carrying-cost: severe flood risk; extreme-heat days projected 7→15/yr by 2055 (HVAC capex compounding) — expect insurance premiums to compound above CPI over the hold.
Questions for the listing agent
- It's been on market 153 days. Have you received any prior offers? Is the seller open to a 12% concession, seller financing, or rate buy-down credit?
- Built in 1900 — when were the roof, HVAC, electrical panel, plumbing, and water heater last replaced?
- What's the actual annual flood-insurance premium (NFIP or private), and is the property in a SFHA with mandatory coverage?
- Why hasn't it sold? Are there any deal-killer items the seller is aware of (foundation, flood, title, zoning, code violations)?
- Is there a deadline driving the sale (1031 exchange, divorce, estate, relocation)? That informs how much negotiation room exists.
- Crime grade is F in this area — have there been break-ins, vandalism, or insurance claims at this property in the last 3 years? What carrier currently insures it and at what premium?
- What's the average days-on-market for RENTAL listings here right now (not sales)? A rising rental-DOM trend means longer vacancies and softer asking-rent achievability than the comps imply.
- What's the recent tenant-quality profile in this submarket — average credit score on applications, eviction rate, late-payment / NSF rate, and stable-employment percentage? A property-management company in the area should have these aggregated.
- How much new for-sale + rental construction is in the pipeline within 1–3 miles? Heavy new supply typically softens prices + rents 12–24 months out; constrained supply supports both.
Investment metrics
- 1% rule
- 1.15% ✓
- Cap rate
- 8.82%
- Cash-on-cash
- 9.03%
- DSCR
- 1.40
- GRM
- 7.2
CMA / ARV
- ARV (median comp)
- $166,795
- List price
- $140,000
- Delta
- -16.06%
- Verdict
- UNDERPRICED
- Comps
- 20 within 1.0 mi
Show comp detail 1 sale within ~0.75 mi
| Address | Dist | Beds/Ba | Sqft | Sold | Price | $/sf | Match |
|---|---|---|---|---|---|---|---|
| 1732 Fulton St | 0.37mi | 3/1.0 (-1) | 1,250 (+11%) | 20mo | $150,000 | $120 | 43 |
Match score weights: distance 35% · size 25% · config 20% · recency 20%. Top-matched comps best support the ARV.
Projected returns pro-forma
-3.0% appreciation · 4.29% rent growth · sell at horizon
- IRR
- -3.5%
- Equity multiple
- 0.87×
- Total profit
- $-5,251
- Equity at exit
- $20,874
- IRR
- 7.7%
- Equity multiple
- 1.62×
- Total profit
- $24,260
- Equity at exit
- $12,105
Cash invested: $39,200 (down + closing). Projections, not guarantees.
Landlord ↔ Tenant lean methodology
- Overall (STATE)
- 62 Landlord-Friendly
- State Pennsylvania
- 62 Landlord-Friendly · EVEN
- County
- — inherits STATE
- City
- — inherits STATE
ZIP-level market 17102
- Home prices YoY
- -3.9%
- Rents YoY
- 4.3%
- Active inventory
- 58
- Price-to-rent
- 7.2×
Monthly cashflow live
- Estimated rent
- $1,612 high interval (Pro) →
- Mortgage (P&I)
- −$734
- Tax from tax record
- −$186 /mo · $2,235/yr
- Insurance
- −$58
- Flood insurance flood zone
- −$56 /mo · $666/yr
- HOA
- −$0
- Vacancy / Maint / Mgmt
- −$339
- Net cashflow
- $239
Break-even live
UW: 25.0% down · 7.5% · 30yr · 1.5% tax · 5.0% vac · 8.0% maint · 8.0% mgmt
Financing live
Cash to close
- Down payment
- $35,000
- Closing costs
- $4,200
- Reserves months
- —
- Total cash needed
- —
Loan-product check · same deal, 3 products live
Conventional
25% down · 7.5% · 30yr
- Down + closing
- —
- Monthly P&I
- —
- Monthly cashflow
- —
- DSCR
- —
- Eligible?
- —
Personal DTI + credit; lowest rate.
DSCR
20% down · 8.5% · 30yr
- Down + closing
- —
- Monthly P&I
- —
- Monthly cashflow
- —
- DSCR
- —
- Eligible?
- —
No personal income docs; deal must DSCR.
Hard money
10% down · 12.0% · 12mo
- Down + closing
- —
- Monthly P&I
- —
- Monthly cashflow
- —
- DSCR
- —
- Eligible?
- —
Short-term bridge; refi at stabilization.
Rent comps 27 comps
| Address | Beds | Baths | Sqft | Rent | $/sqft | DOM | Units | Dist |
|---|---|---|---|---|---|---|---|---|
| 918 Grand St Harrisburg, PA | 3.0 | 1.5 | 890 | $1,450 | $1.63 | 43d | 1 | 0.27mi |
| 919 Penn St Harrisburg, PA | 3.0 | 2.0 | 1458 | $1,795 | $1.23 | 23d | 1 | 0.34mi |
| 640 Kelker St Harrisburg, PA | 3.0 | 1.0 | 1294 | $1,650 | $1.28 | 43d | 1 | 0.46mi |
| 644 Kelker St Harrisburg, PA | 3.0 | 1.0 | 1294 | $1,295 | $1.00 | 43d | 1 | 0.46mi |
| 1841 N 4th St Harrisburg, PA | 3.0 | 1.0 | 1376 | $1,399 | $1.02 | 23d | 1 | 0.47mi |
| 1841 N 3rd St Harrisburg, PA | 3.0 | 1.0 | 1376 | $1,399 | $1.02 | 13d | 1 | 0.47mi |
| 2042 N 4th St Harrisburg, PA | 3.0 | 1.0 | 1090 | $1,400 | $1.28 | 43d | 1 | 0.64mi |
| 2118 N 4th St Harrisburg, PA | 4.0 | 1.0 | 1383 | $1,595 | $1.15 | 43d | 1 | 0.72mi |
| 2235 Logan St Harrisburg, PA | 3.0 | 1.0 | 1406 | $1,495 | $1.06 | 43d | 1 | 0.85mi |
| 339 Emerald St Harrisburg, PA | 3.0 | 1.5 | 1420 | $1,650 | $1.16 | 13d | 1 | 0.89mi |
| 21 Summit St Harrisburg, PA | 3.0 | 1.0 | 1200 | $1,550 | $1.29 | 13d | 1 | 0.90mi |
| 301 Chestnut St Harrisburg, PA | 4.0 | 1.0–2.5 | 1437 | $3,000 | $2.09 | 13d | 10 | 0.92mi |
| 301 Chestnut St Harrisburg, PA | 1.0–4.0 | 1.0–2.5 | 1437 | $2,600 | $1.81 | 43d | 1 | 0.92mi |
| 1251 Bailey St Harrisburg, PA | 3.0 | 1.0 | 1200 | $1,500 | $1.25 | 43d | 1 | 0.96mi |
| 1207 Market St Harrisburg, PA | 4.0 | 1.5 | 1423 | $1,995 | $1.40 | 43d | 1 | 0.96mi |
| 200 S Court St Harrisburg, PA | 1.0–3.0 | 1.0–2.5 | 950 | $1,800 | $1.89 | 13d | 14 | 1.02mi |
| 2406 Reel St Harrisburg, PA | 4.0 | 1.0 | 1500 | $1,395 | $0.93 | 43d | 1 | 1.03mi |
| 1139 Mulberry St Harrisburg, PA | 1.0–3.0 | 1.0 | 900 | $1,185 | $1.32 | 43d | 1 | 1.04mi |
| 1517 Walnut St Harrisburg, PA | 3.0 | 1.0 | 1172 | $1,150 | $0.98 | 43d | 1 | 1.05mi |
| 616 N Front St Lemoyne, PA | 3.0 | 1.0 | 1408 | $1,650 | $1.17 | 43d | 1 | 1.17mi |
| 29 S 15th St Harrisburg, PA | 5.0 | 1.0 | 1285 | $1,895 | $1.47 | 23d | 1 | 1.20mi |
| 514 Radnor St Harrisburg, PA | 4.0 | 1.0 | 1498 | $1,600 | $1.07 | 43d | 1 | 1.27mi |
| 52 N 18th St Harrisburg, PA | 3.0 | 1.0 | 1100 | $1,250 | $1.14 | 13d | 1 | 1.27mi |
| 2615 Waldo St Harrisburg, PA | 3.0 | 1.0 | 1400 | $1,095 | $0.78 | 43d | 1 | 1.31mi |
| 337 S 15th St Harrisburg, PA | 3.0 | 1.0 | 1440 | $1,195 | $0.83 | 21d | 1 | 1.38mi |
| 400 W Crestwood Dr Camp Hill, PA | 1.0–3.0 | 1.0–2.0 | 1042 | $2,071 | $1.99 | 13d | 14 | 1.46mi |
| 1429 Naudain St Harrisburg, PA | 3.0 | 1.0 | 1254 | $1,400 | $1.12 | 23d | 1 | 1.50mi |
Listing history 26 events
-
2026-06-15status $140,000 Pending 153 DOM
-
2026-06-15days on market $140,000 Active 153 DOM
-
2026-06-14days on market $140,000 Active 151 DOM
-
2026-06-13days on market $140,000 Active 150 DOM
-
2026-06-10days on market $140,000 Active 148 DOM
-
2026-06-09days on market $140,000 Active 147 DOM
-
2026-06-08days on market $140,000 Active 146 DOM
-
2026-06-07days on market $140,000 Active 145 DOM
-
2026-06-03days on market $140,000 Active 141 DOM
-
2026-06-02days on market $140,000 Active 140 DOM
-
2026-06-01days on market $140,000 Active 139 DOM
-
2026-05-31days on market $140,000 Active 138 DOM
-
2026-05-31days on market $140,000 Active 137 DOM
-
2026-03-25price $145,000 277-char remark
Show marketing remark (277 chars)
Investor opportunity in central Harrisburg! This home is within walking distance to restaurants, entertainment, and local landmarks like Midtown, the Federal Building, Broad Street Market, Susquehanna Museum, and the movie theatre. Great potential for buyers ready to renovate.
-
2026-02-25price $148,000 277-char remark
Show marketing remark (277 chars)
Investor opportunity in central Harrisburg! This home is within walking distance to restaurants, entertainment, and local landmarks like Midtown, the Federal Building, Broad Street Market, Susquehanna Museum, and the movie theatre. Great potential for buyers ready to renovate.
-
2026-01-13$150,000 Active 277-char remark
Show marketing remark (277 chars)
Investor opportunity in central Harrisburg! This home is within walking distance to restaurants, entertainment, and local landmarks like Midtown, the Federal Building, Broad Street Market, Susquehanna Museum, and the movie theatre. Great potential for buyers ready to renovate.
-
2026-01-12historical
-
2025-05-06$150,000 Active
-
2025-05-05historical
-
2025-02-13historical
-
2024-05-28price $150,000
-
2024-05-28status Active
-
2024-05-06historical
-
2024-02-26$200,000 Active
-
2024-02-25price $200,000
-
2024-02-15historical
ⓘ Source: listings_history table (triggers on properties + properties_extension) + one-shot
backfill from property_details.listing_events for pre-trigger history.
Tax reassessment forecast PA · Partial reset (capped growth)
- Current annual tax
- $2,235 · $186/mo
- Projected year-2 tax
- $2,235 · $186/mo
- Expected delta
- $0/yr ($0/mo · 0.0%)
ⓘ Screening estimate from a state-policy table — verify with the county assessor before closing.
Climate risk First Street
- Flood 9/10 Extreme FEMA zone X (unshaded) · 99% chance over 30 yrs
- Wildfire 1/10 Low
- Heat 6/10 Major 7 d/yr ≥100°F today · 15 d/yr by 30 yrs out
- Wind 3/10 Moderate 5% chance of damaging wind over 30 yrs
- Air quality 2/10 Low 1 unhealthy d/yr today · 3 by 30 yrs out
Nearby sold comps map
Loading sold comps map…
Walkable amenities ~0.75 mi
Loading nearby amenities…
Taxation est. · year 1
- Rental income
- $19,348
- − Mortgage interest
- −$7,842
- − Property taxes
- −$2,235
- − Insurance
- −$1,366
- − Repairs & maintenance
- −$1,548
- − Management
- −$1,548
- − Depreciation
- −$4,073
- Taxable income
- $736
- Est. tax owed @ 24.0%
- −$177
- After-tax cash flow
- $2,697/yr
For passive investors: Depreciation is non-cash, so a rental often shows a tax loss while cash-flowing — sheltering income. Rental losses are passive: they offset passive income freely, and up to $25,000/yr can offset ordinary (W-2) income if you actively participate and your MAGI is under $100k (phasing out to $0 by $150k); unused losses carry forward. On sale, claimed depreciation is recaptured at up to 25%, and gains may owe capital-gains tax (a 1031 exchange can defer both). Figures are a year-1 estimate at your 24.0% rate — not tax advice; consult a CPA.
Schools (NCES district)
- District
- Harrisburg City SD
- NCES district ID
- 4211580
- Math proficiency
- 6% ▼ -6.00%
- Reading proficiency
- 13% ▼ -10.00%
- Median HH income
- $33,432
- Composite
- 7.6/100
- National rank
- #9945
- State rank
- #535 of 539 in PA
Livability — Harrisburg
- Score
- 84/100
- State rank
- #107
- US rank
- #826
Category grades
Schools grade is shown separately in the Schools card above.
Census & demographics
- Census place
- Harrisburg, PA
- County
- Dauphin County · 247,857 people
- City population
- 184,296
- Metro
- Harrisburg-Carlisle, PA
- Population (ZIP)
- 8,118
- Household income
- $54,573
- Rent vs Own
- Severe rent burden
- 720.0
Population outlook (Dauphin County) Hauer SSP2
- Today (2025)
- 281,628 people
- By 2030
- 283,549 · +0.7%
- By 2040
- 285,385 · +1.3%
- By 2050
- 286,188 · +1.6%
- By 2075
- 291,053 · +3.3%
- By 2100
- 282,374 · +0.3%
Race, ethnicity, and origin ACS 2023
- Neighborhood character
- Diverse neighborhood (Simpson 0.62)
- Race & ethnicity
- White 54% Black 25% Hispanic / Latino 14% Two or more races 7% Asian 2%
- Hispanic origin (detail)
- Mexican 1% Puerto Rican 8% Dominican 2%
- Common ancestry
- Romanian 5% Italian 2% Lithuanian 2%
- Foreign-born
- 7% · Canada, Vietnam, South Korea
- Languages at home
- 86% English-only · Spanish 9% Arabic 1% Other Asian/Pacific 1%
Political lean MEDSL · Dauphin
- 2024 margin
- Lean D (+5.9) · D 52.4% · R 46.5% · Other 1.1%
- 2008→2024 swing
- -3.1pp toward R · 2008: 9.1pp · 2024: 5.9pp
- All cycles
- 2024: D+5.9 2020: D+8.5 2016: D+2.8 2012: D+6.0 2008: D+9.1
Not yet ingested
- Civics
- —
Market trends
- HPI YoY
- ▼ -18.43%
- Current HPI
- 451.4739
- Rent YoY
- ▲ 4.29%
- Metro
- Harrisburg-Carlisle, PA
- State GDP YoY
- ▲ 1.68%
- F500 in state
- 34
Industry mix (Fortune 500 HQ in PA)
| Industry | F500 HQs | Revenue |
|---|---|---|
| Healthcare | 2 | $309B |
|
||
| Insurance | 2 | $27B |
|
||
| Telecommunications / Media | 1 | $124B |
|
||
| Industrial Distribution | 1 | $22B |
|
||
| Financial Services | 1 | $20B |
|
||
| Chemicals / Materials | 1 | $18B |
|
||
Price history
-27.5% since first listed13 events — show timeline
- 2026-03-25 Price Changed $145,000 BRIGHT MLS
- 2026-02-25 Price Changed $148,000 BRIGHT MLS
- 2026-01-13 Listed $150,000 BRIGHT MLS
- 2026-01-12 Listing Removed — BRIGHT MLS
- 2025-05-06 Listed $150,000 BRIGHT MLS
- 2025-05-05 Coming Soon — BRIGHT MLS
- 2025-02-13 Listing Removed — BRIGHT MLS
- 2024-05-28 Price Changed $150,000 BRIGHT MLS
- 2024-05-28 Relisted — BRIGHT MLS
- 2024-05-06 Listing Removed — BRIGHT MLS
- 2024-02-26 Listed $200,000 BRIGHT MLS
- 2024-02-25 Price Changed $200,000 BRIGHT MLS
- 2024-02-15 Coming Soon — BRIGHT MLS
Property tax history
+1.0%/yrLatest (2026): $2,235 · +1.6% YoY. Source: county tax records.
Cash-flow waterfall
monthlySold comps — $/sqft
last 12 mo · ≤1 miLoading sold comps…