 Multi-family
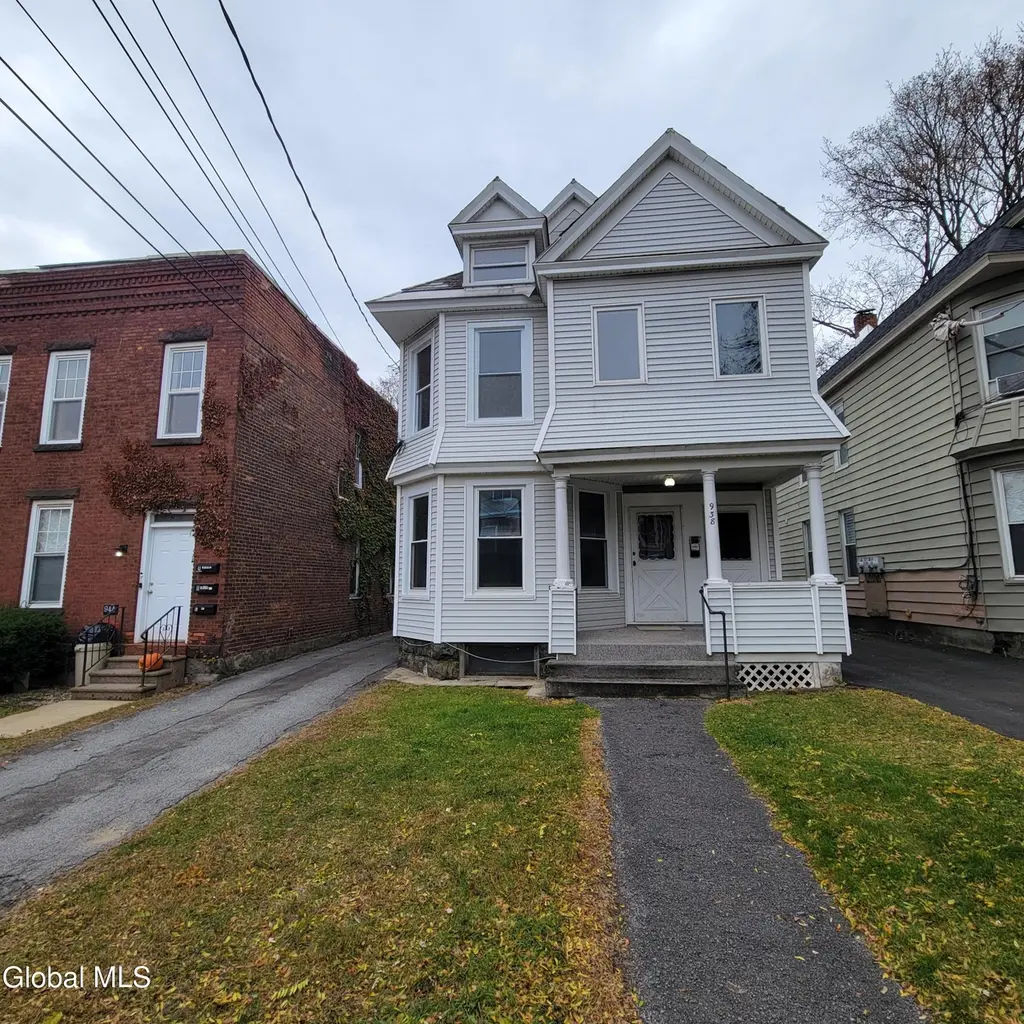
938 Park Ave · Schenectady, NY
Flood risk 1/10 · Minimal
- FEMA flood zone
- X (unshaded)
- Chance of flooding over 30 yrs
- 0.0%
- Est. flood insurance / yr
- $473 – $860
Fire risk 1/10 · Minimal
- Est. fire insurance / yr
- $691 – $1,283
Heat risk 4/10 · Minor
- Hot days now (above 95°F)
- 7 days/yr
- Hot days in 30 yrs
- 16 days/yr
Wind risk 3/10 · Minor
- Chance of severe wind over 30 yrs
- 5.0%
Air-quality risk 1/10 · Minimal
- Unhealthy air days now
- 0 days/yr
- Unhealthy air days in 30 yrs
- 0 days/yr
Risk factors via First Street. Map © Google.
Why this score? — see what drove the B- grade
The composite is a weighted blend of 9 inputs, each scored 0–100. Each bar is that input's sub-score; the figure is the points it added to the 100-point composite (weight × sub-score).
- Cash flow +25.4/30.0
- ARV discount +15.0/15.0
- DSCR +8.4/10.0
- 1% rule +7.2/10.0
- Livability +3.9/5.0
- Schools +3.0/10.0
- Rent growth +2.5/5.0
- Condition / age +2.5/5.0
- Appreciation +0.0/10.0
$349,900
🖨 Deal sheet 📄 Offer letter ✓ Due diligence
Multi-family units
County records classify this as Multi-Family (2-4 Unit). Listing-text estimate: 1 unit. estimate disagrees with records
Listing remarks MLS
Great multi-family investment opportunity in Schenectady. 3 units. All utilities separated. 2 units empty, 1-unit occupied (month to month). Large 2-car garage. Plenty of off street parking. Perfect for owner occupied or pure investment. Very close to downtown amenities; Union College, Rivers Casino, local restaurants and shopping. Don't miss this one!
Key facts
- Large garage
- Off street parking
- Utilities separated
Tags
Neighborhood map
What this means for you Summary
Snapshot
- This is a 7-bed/3.0-bath multifamily listed at $350k.
Deal economics
- At list price, monthly cash flow is $807 ($10k/yr) — positive.
- The deal already cash-flows at list — no discount required.
- Meets the 1% rule at list price ($4k rent vs $350k).
- Recommended offer: $308k (12.0% below list) — sets the bar for market timing.
- Cap rate 9.1% vs local median 6.3% in Schenectady — top-decile yield for the area; either an underpriced asset or a hidden risk that comps aren't pricing in. Stress-test before assuming the spread holds.
Location & tenants
- Location reads 78/100 on livability (#167 in NY, #2,597 nationally) — a middle-class / working-renter tenant base. Strengths: commute A+, health & safety A+, cost of living A; Watch: schools C-, employment D+, crime F.
- Schenectady City School District (urban): math 38% / reading 34% proficiency, ranked #556 of 590 in NY (top 94%) — families likely to look elsewhere, expect single-tenant / working-renter base with shorter leases; 65% free/reduced lunch — lower-income household profile, screen leases tightly.
- Market conditions: 78 active listings in the ZIP; 154 units permitted in Schenectady County in 2024 (54 in 5+ unit buildings).
- At $4,276/mo this rent would consume 81% of the median local household income ($63k/yr) (locally 1016% of renters already pay >50% of income on rent) — very limited rent-growth headroom before tenants either downsize or default.
Forward outlook
- Local home prices are declining (-3.0%/yr); year-one equity from $2k of loan paydown is wiped out by about $10k of value loss. Plan a longer hold.
- Schenectady County population projected to shrink 4% by 2050 — rents likely to lag national; underwrite the cash flow, not the appreciation.
Negotiation context
- It's been on market 179 days — a 12% lower offer ($308k) is reasonable based on typical stale-listing flexibility.
Risks & watch-outs
- Watch-outs: built in 1910 — expect roof / HVAC / electrical / plumbing capex.
Questions for the listing agent
- It's been on market 179 days. Have you received any prior offers? Is the seller open to a 12% concession, seller financing, or rate buy-down credit?
- Built in 1910 — when were the roof, HVAC, electrical panel, plumbing, and water heater last replaced?
- Why hasn't it sold? Are there any deal-killer items the seller is aware of (foundation, flood, title, zoning, code violations)?
- Is there a deadline driving the sale (1031 exchange, divorce, estate, relocation)? That informs how much negotiation room exists.
- Crime grade is F in this area — have there been break-ins, vandalism, or insurance claims at this property in the last 3 years? What carrier currently insures it and at what premium?
- What's the average days-on-market for RENTAL listings here right now (not sales)? A rising rental-DOM trend means longer vacancies and softer asking-rent achievability than the comps imply.
- What's the recent tenant-quality profile in this submarket — average credit score on applications, eviction rate, late-payment / NSF rate, and stable-employment percentage? A property-management company in the area should have these aggregated.
- How much new apartment / multifamily construction is in the pipeline within 1–3 miles? Heavy new supply (>2% of stock underway) typically softens rents 12–24 months out; light construction supports rent growth.
Investment metrics
- 1% rule
- 1.22% ✓
- Cap rate
- 9.06%
- Cash-on-cash
- 9.89%
- DSCR
- 1.44
- GRM
- 6.8
CMA / ARV
- ARV (median comp)
- $436,025
- List price
- $349,900
- Delta
- -19.75%
- Verdict
- UNDERPRICED
- Comps
- 20 within 1.0 mi
Show comp detail 12 sales within ~0.75 mi
| Address | Dist | Beds/Ba | Sqft | Sold | Price | $/sf | Match |
|---|---|---|---|---|---|---|---|
| 1 Chestnut St | 0.48mi | 6/3.0 (-1) | 2,406 (+1%) | 2mo | $290,000 | $121 | 69 |
| 762 Eastern Ave | 0.23mi | 6/2.0 (-1) | 2,205 (-7%) | 3mo | $269,900 | $122 | 65 |
| 21 Hawk St | 0.50mi | 6/2.0 (-1) | 2,294 (-4%) | 0mo | $334,750 | $146 | 61 |
| 16 Paulding St | 0.11mi | 6/2.0 (-1) | 2,078 (-13%) | 5mo | $205,000 | $99 | 61 |
| 5 Hawk St | 0.55mi | 6/2.0 (-1) | 2,294 (-4%) | 1mo | $325,000 | $142 | 59 |
| 1610 Avenue A | 0.70mi | 6/3.0 (-1) | 2,442 (+3%) | 5mo | $268,000 | $110 | 54 |
| 1111 Parkwood Blvd | 0.48mi | 6/2.0 (-1) | 2,532 (+6%) | 6mo | $250,000 | $99 | 53 |
| 16 Hawk St | 0.51mi | 6/2.0 (-1) | 2,584 (+9%) | 0mo | $370,000 | $143 | 53 |
| 531 Nott St | 0.65mi | 6/2.0 (-1) | 2,524 (+6%) | 4mo | $210,000 | $83 | 48 |
| 309 Mcclellan St | 0.63mi | 6/2.0 (-1) | 2,572 (+8%) | 6mo | $312,000 | $121 | 43 |
| 25 Steuben St | 0.74mi | 6/3.0 (-1) | 2,640 (+11%) | 1mo | $265,000 | $100 | 42 |
| 316 Georgetta Dix Plz | 0.69mi | 6/4.0 (-1) | 2,664 (+12%) | 4mo | $262,500 | $99 | 35 |
Match score weights: distance 35% · size 25% · config 20% · recency 20%. Top-matched comps best support the ARV.
Projected returns pro-forma
-3.0% appreciation · 3.0% rent growth · sell at horizon
- IRR
- -1.4%
- Equity multiple
- 0.95×
- Total profit
- $-5,135
- Equity at exit
- $52,171
- IRR
- 8.3%
- Equity multiple
- 1.64×
- Total profit
- $62,364
- Equity at exit
- $30,253
Cash invested: $97,972 (down + closing). Projections, not guarantees.
Landlord ↔ Tenant lean methodology
- Overall (STATE)
- 15 Strongly Tenant-Friendly
- State New York
- 15 Strongly Tenant-Friendly · D+10
- County
- — inherits STATE
- City
- — inherits STATE
ZIP-level market 12308
- Home prices YoY
- -14.6%
- Active inventory
- 78
- Price-to-rent
- 20.5×
Monthly cashflow live
- Estimated rent
- $4,276 high interval (Pro) →
- Mortgage (P&I)
- −$1,835
- Tax from tax record
- −$590 /mo · $7,083/yr
- Insurance
- −$146
- HOA
- −$0
- Vacancy / Maint / Mgmt
- −$898
- Net cashflow
- $807
Break-even live
3-unit breakdown (identical units grouped — click to expand)
| Units | Beds | Baths | Est. rent |
|---|---|---|---|
| 3× units | 2 | 1 | $4,275 |
| #1 | 2 | 1 | $1,425 |
| #2 | 2 | 1 | $1,425 |
| #3 | 2 | 1 | $1,425 |
| Total (3 units) | $4,276 | ||
UW: 25.0% down · 7.5% · 30yr · 1.5% tax · 5.0% vac · 8.0% maint · 8.0% mgmt
Financing live
Cash to close
- Down payment
- $87,475
- Closing costs
- $10,497
- Reserves months
- —
- Total cash needed
- —
Loan-product check · same deal, 3 products live
Conventional
25% down · 7.5% · 30yr
- Down + closing
- —
- Monthly P&I
- —
- Monthly cashflow
- —
- DSCR
- —
- Eligible?
- —
Personal DTI + credit; lowest rate.
DSCR
20% down · 8.5% · 30yr
- Down + closing
- —
- Monthly P&I
- —
- Monthly cashflow
- —
- DSCR
- —
- Eligible?
- —
No personal income docs; deal must DSCR.
Hard money
10% down · 12.0% · 12mo
- Down + closing
- —
- Monthly P&I
- —
- Monthly cashflow
- —
- DSCR
- —
- Eligible?
- —
Short-term bridge; refi at stabilization.
Listing history 3 events
-
2026-05-19historical Contingent 354-char remark
Show marketing remark (354 chars)
Great multi-family investment opportunity in Schenectady. 3 units. All utilities separated. 2 units empty, 1-unit occupied (month to month). Large 2-car garage. Plenty of off street parking. Perfect for owner occupied or pure investment. Very close to downtown amenities; Union College, Rivers Casino, local restaurants and shopping. Don't miss this one!
-
2026-05-16price $349,900 354-char remark
Show marketing remark (354 chars)
Great multi-family investment opportunity in Schenectady. 3 units. All utilities separated. 2 units empty, 1-unit occupied (month to month). Large 2-car garage. Plenty of off street parking. Perfect for owner occupied or pure investment. Very close to downtown amenities; Union College, Rivers Casino, local restaurants and shopping. Don't miss this one!
-
2025-11-24$379,900 Active 354-char remark
Show marketing remark (354 chars)
Great multi-family investment opportunity in Schenectady. 3 units. All utilities separated. 2 units empty, 1-unit occupied (month to month). Large 2-car garage. Plenty of off street parking. Perfect for owner occupied or pure investment. Very close to downtown amenities; Union College, Rivers Casino, local restaurants and shopping. Don't miss this one!
ⓘ Source: listings_history table (triggers on properties + properties_extension) + one-shot
backfill from property_details.listing_events for pre-trigger history.
Tax reassessment forecast NY · Partial reset (capped growth)
- Current annual tax
- $7,083 · $590/mo
- Projected year-2 tax
- $7,083 · $590/mo
- Expected delta
- $0/yr ($0/mo · 0.0%)
ⓘ Screening estimate from a state-policy table — verify with the county assessor before closing.
Climate risk First Street
- Flood 1/10 Low FEMA zone X (unshaded) · 0% chance over 30 yrs
- Wildfire 1/10 Low
- Heat 4/10 Moderate 7 d/yr ≥95°F today · 16 d/yr by 30 yrs out
- Wind 3/10 Moderate 5% chance of damaging wind over 30 yrs
- Air quality 1/10 Low 0 unhealthy d/yr today · 0 by 30 yrs out
Nearby sold comps map
Loading sold comps map…
Walkable amenities ~0.75 mi
Loading nearby amenities…
Taxation est. · year 1
- Rental income
- $51,312
- − Mortgage interest
- −$19,600
- − Property taxes
- −$7,083
- − Insurance
- −$1,750
- − Repairs & maintenance
- −$4,105
- − Management
- −$4,105
- − Depreciation
- −$10,179
- Taxable income
- $4,491
- Est. tax owed @ 24.0%
- −$1,078
- After-tax cash flow
- $8,607/yr
For passive investors: Depreciation is non-cash, so a rental often shows a tax loss while cash-flowing — sheltering income. Rental losses are passive: they offset passive income freely, and up to $25,000/yr can offset ordinary (W-2) income if you actively participate and your MAGI is under $100k (phasing out to $0 by $150k); unused losses carry forward. On sale, claimed depreciation is recaptured at up to 25%, and gains may owe capital-gains tax (a 1031 exchange can defer both). Figures are a year-1 estimate at your 24.0% rate — not tax advice; consult a CPA.
Schools (NCES district)
- District
- Schenectady City School District
- NCES district ID
- 3626010
- Math proficiency
- 38% ▲ 12.00%
- Reading proficiency
- 34% ▲ 2.00%
- Median HH income
- $39,453
- Composite
- 30.2/100
- National rank
- #6309
- State rank
- #556 of 590 in NY
Livability — Schenectady
- Score
- 78/100
- State rank
- #167
- US rank
- #2597
Category grades
Schools grade is shown separately in the Schools card above.
Census & demographics
- Census place
- Schenectady, NY
- County
- Schenectady County · 141,369 people
- City population
- 141,369
- Metro
- Albany-Schenectady-Troy, NY
- Population (ZIP)
- 15,511
- Household income
- $63,434
- Rent vs Own
- Severe rent burden
- 1016.0
Population outlook (Schenectady County) Hauer SSP2
- Today (2025)
- 155,046 people
- By 2030
- 154,322 · -0.5%
- By 2040
- 151,796 · -2.1%
- By 2050
- 148,621 · -4.1%
- By 2075
- 141,229 · -8.9%
- By 2100
- 126,014 · -18.7%
Race, ethnicity, and origin ACS 2023
- Neighborhood character
- Diverse neighborhood (Simpson 0.63)
- Race & ethnicity
- White 57% Black 17% Hispanic / Latino 13% Two or more races 7% Asian 3%
- Hispanic origin (detail)
- Mexican 2% Puerto Rican 8%
- Common ancestry
- Lithuanian 4% Romanian 4% Slovak 3%
- Foreign-born
- 10% · Canada
- Languages at home
- 89% English-only · Spanish 5% Other Indo-European 2% Arabic 1%
Political lean MEDSL · Schenectady
- 2024 margin
- D (+10.8) · D 55.4% · R 44.6%
- 2008→2024 swing
- -1.8pp toward R · 2008: 12.7pp · 2024: 10.8pp
- All cycles
- 2024: D+10.8 2020: D+15.7 2016: D+5.8 2012: D+15.4 2008: D+12.7
Not yet ingested
- Civics
- —
Market trends
- HPI YoY
- ▼ -59.17%
- Current HPI
- 344.8675
- Rent YoY
- —
- Metro
- Albany-Schenectady-Troy, NY
- State GDP YoY
- ▲ 2.60%
- F500 in state
- 92
Industry mix (Fortune 500 HQ in NY)
| Industry | F500 HQs | Revenue |
|---|---|---|
| Financial Services | 10 | $950B |
|
||
| Consumer Goods | 9 | $162B |
|
||
| Insurance | 4 | $225B |
|
||
| Telecommunications | 2 | $144B |
|
||
| Pharmaceuticals | 2 | $112B |
|
||
| Media / Entertainment | 2 | $69B |
|
||
Price history
-7.9% since first listed3 events — show timeline
- 2026-05-19 Contingent — Global MLS
- 2026-05-16 Price Changed $349,900 Global MLS
- 2025-11-24 Listed $379,900 Global MLS
Property tax history
+1.0%/yrLatest (2025): $7,083 · +4.1% YoY. Source: county tax records.
Cash-flow waterfall
monthlySold comps — $/sqft
last 12 mo · ≤1 miLoading sold comps…