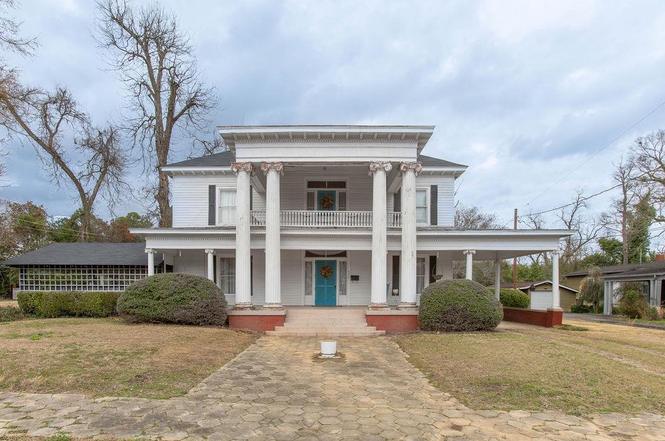
440 Church St., N.e St · Dawson, GA
Flood risk 1/10 · Minimal
- FEMA flood zone
- X (unshaded)
- Chance of flooding over 30 yrs
- 0.0%
- Est. flood insurance / yr
- $473 – $860
Fire risk 3/10 · Minor
- Est. fire insurance / yr
- $963 – $1,789
Heat risk 7/10 · Major
- Hot days now (above 108°F)
- 7 days/yr
- Hot days in 30 yrs
- 19 days/yr
Wind risk 8/10 · Major
- Chance of severe wind over 30 yrs
- 80.0%
Air-quality risk 2/10 · Minimal
- Unhealthy air days now
- 1 days/yr
- Unhealthy air days in 30 yrs
- 2 days/yr
Risk factors via First Street. Map © Google.
Why this score? — see what drove the C- grade
The composite is a weighted blend of 9 inputs, each scored 0–100. Each bar is that input's sub-score; the figure is the points it added to the 100-point composite (weight × sub-score).
- Cash flow +19.1/30.0
- ARV discount +7.5/15.0
- DSCR +6.0/10.0
- Appreciation +5.8/10.0
- 1% rule +4.2/10.0
- Livability +2.8/5.0
- Rent growth +2.5/5.0
- Condition / age +2.5/5.0
- Schools +0.8/10.0
$175,000
🖨 Deal sheet 📄 Offer letter ✓ Due diligence
Listing remarks
Built in 1880 and centrally located in Terrell County, this classic two-story home blends historic character with everyday comfort. Featuring 4 bedrooms and 2 full bathrooms, the property showcases beautiful hardwood floors throughout and generous living spaces designed for both relaxation and entertaining. A welcoming foyer opens to a spacious great room and formal dining room, offering an elegant flow on the main level. The primary bedroom is conveniently located downstairs with its own private bath. The kitchen provides abundant cabinet space, a functional island, and a cozy breakfast nook. Just off the main living area, a bright sunroom overlooks the fenced backyard, creating the perfec
Key facts
- Formal dining room
- Private bath
- Functional island
Tags
Neighborhood map
What this means for you Summary
Snapshot
- This is a 4-bed/2.0-bath single-family listed at $175k.
Deal economics
- At list price, monthly cash flow is $184 ($2k/yr) — positive.
- The deal already cash-flows at list — no discount required.
- To meet the 1% rule (rent ≥ 1% of price), the offer needs to be $162k (7.5% below list).
- Recommended offer: $162k (7.5% below list) — sets the bar for 1% rule.
Location & tenants
- Location reads 55/100 on livability (#508 in GA) — a working-class tenant base; expect higher turnover. Strengths: cost of living A+, housing A-; Watch: crime D+, schools F, amenities F.
- Terrell County (rural): math 7% / reading 13% proficiency, ranked #167 of 174 in GA (top 96%) — low school quality limits family demand, transient renter base, plan for 1-2y turnover; 79% free/reduced lunch — lower-income household profile, screen leases tightly.
- Market conditions: 35 active listings in the ZIP; 2 units permitted in Terrell County in 2024 (0 in 5+ unit buildings).
Forward outlook
- In year one you build about $4k of equity ($1k loan paydown + $3k appreciation (1.6% local appreciation)).
- Terrell County population projected at -33% by 2050 — secular population decline; favor cash flow + early exit over multi-decade hold.
- At projected returns (1.6% appreciation + 3.0% rent growth), your $49k cash investment doubles in ~7 years — after that, you're playing with house money.
- By year 8, paydown + projected appreciation supports a ~$30k cash-out refi (75% LTV) — recoverable capital for the next deal without selling this one.
Negotiation context
- It's been on market 49 days — a 3% lower offer ($170k) is reasonable based on typical stale-listing flexibility.
- 2 sale attempts; this cycle's ask has dropped $15k (8%) from the opening price — seller is motivated, your offer sets the floor, not the list.
Risks & watch-outs
- Watch-outs: built in 1880 — expect roof / HVAC / electrical / plumbing capex.
- Climate carrying-cost: severe wind risk, 80% chance of damaging wind over 30y; extreme-heat days projected 7→19/yr by 2055 (HVAC capex compounding) — expect insurance premiums to compound above CPI over the hold.
Questions for the listing agent
- It's been on market 49 days. Have you received any prior offers? Is the seller open to a 8% concession, seller financing, or rate buy-down credit?
- Built in 1880 — when were the roof, HVAC, electrical panel, plumbing, and water heater last replaced?
- Is there a deadline driving the sale (1031 exchange, divorce, estate, relocation)? That informs how much negotiation room exists.
- Schools are F-rated, which usually means shorter tenancies and higher turnover. Who's the typical renter profile here, and what's been the actual vacancy rate?
- Crime grade is D in this area — have there been break-ins, vandalism, or insurance claims at this property in the last 3 years? What carrier currently insures it and at what premium?
- What's the average days-on-market for RENTAL listings here right now (not sales)? A rising rental-DOM trend means longer vacancies and softer asking-rent achievability than the comps imply.
- What's the recent tenant-quality profile in this submarket — average credit score on applications, eviction rate, late-payment / NSF rate, and stable-employment percentage? A property-management company in the area should have these aggregated.
- How much new for-sale + rental construction is in the pipeline within 1–3 miles? Heavy new supply typically softens prices + rents 12–24 months out; constrained supply supports both.
Investment metrics
- 1% rule
- 0.92% ✗
- Cap rate
- 7.56%
- Cash-on-cash
- 4.51%
- DSCR
- 1.20
- GRM
- 9.0
CMA / ARV
- ARV (on-the-fly)
- $103,896
- Comps found
- 1
Show comp detail 1 sale within ~0.75 mi
| Address | Dist | Beds/Ba | Sqft | Sold | Price | $/sf | Match |
|---|---|---|---|---|---|---|---|
| 389 Stonewall St NE | 0.29mi | 4/3.0 | 4,042 (+5%) | 21mo | $109,000 | $27 | 57 |
Match score weights: distance 35% · size 25% · config 20% · recency 20%. Top-matched comps best support the ARV.
Projected returns pro-forma
1.56% appreciation · 3.0% rent growth · sell at horizon
- IRR
- 7.7%
- Equity multiple
- 1.41×
- Total profit
- $19,848
- Equity at exit
- $64,939
- IRR
- 11.3%
- Equity multiple
- 2.45×
- Total profit
- $71,229
- Equity at exit
- $90,471
Cash invested: $49,000 (down + closing). Projections, not guarantees.
Landlord ↔ Tenant lean methodology
- Overall (STATE)
- 90 Strongly Landlord-Friendly
- State Georgia
- 90 Strongly Landlord-Friendly · R+3
- County
- — inherits STATE
- City
- — inherits STATE
ZIP-level market 39842
- Home prices YoY
- 0.8%
- Active inventory
- 35
- Price-to-rent
- 9.0×
Monthly cashflow live
- Estimated rent
- $1,618 medium interval (Pro) →
- Mortgage (P&I)
- −$918
- Tax from tax record
- −$103 /mo · $1,240/yr
- Insurance
- −$73
- HOA
- −$0
- Vacancy / Maint / Mgmt
- −$340
- Net cashflow
- $184
Break-even live
UW: 25.0% down · 7.5% · 30yr · 1.5% tax · 5.0% vac · 8.0% maint · 8.0% mgmt
Financing live
Cash to close
- Down payment
- $43,750
- Closing costs
- $5,250
- Reserves months
- —
- Total cash needed
- —
Loan-product check · same deal, 3 products live
Conventional
25% down · 7.5% · 30yr
- Down + closing
- —
- Monthly P&I
- —
- Monthly cashflow
- —
- DSCR
- —
- Eligible?
- —
Personal DTI + credit; lowest rate.
DSCR
20% down · 8.5% · 30yr
- Down + closing
- —
- Monthly P&I
- —
- Monthly cashflow
- —
- DSCR
- —
- Eligible?
- —
No personal income docs; deal must DSCR.
Hard money
10% down · 12.0% · 12mo
- Down + closing
- —
- Monthly P&I
- —
- Monthly cashflow
- —
- DSCR
- —
- Eligible?
- —
Short-term bridge; refi at stabilization.
Listing history 5 events
-
2026-04-15status Pending
-
2026-03-28price $175,000
-
2026-03-20status Active
-
2026-03-15status Pending
-
2026-02-21$189,900 Active
ⓘ Source: listings_history table (triggers on properties + properties_extension) + one-shot
backfill from property_details.listing_events for pre-trigger history.
Tax reassessment forecast GA · Resets to sale price
- Current annual tax
- $1,240 · $103/mo
- Projected year-2 tax
- $1,610 · $134/mo
- Expected delta
- +$370/yr (+$31/mo · 29.8%)
ⓘ Screening estimate from a state-policy table — verify with the county assessor before closing.
Climate risk First Street
- Flood 1/10 Low FEMA zone X (unshaded) · 0% chance over 30 yrs
- Wildfire 3/10 Moderate
- Heat 7/10 Severe 7 d/yr ≥108°F today · 19 d/yr by 30 yrs out
- Wind 8/10 Severe 80% chance of damaging wind over 30 yrs
- Air quality 2/10 Low 1 unhealthy d/yr today · 2 by 30 yrs out
Nearby sold comps map
Loading sold comps map…
Walkable amenities ~0.75 mi
Loading nearby amenities…
Taxation est. · year 1
- Rental income
- $19,416
- − Mortgage interest
- −$9,803
- − Property taxes
- −$1,240
- − Insurance
- −$875
- − Repairs & maintenance
- −$1,553
- − Management
- −$1,553
- − Depreciation
- −$5,091
- Taxable loss
- −$699
- Est. tax savings @ 24.0%
- +$168
- After-tax cash flow
- $2,379/yr
For passive investors: Depreciation is non-cash, so a rental often shows a tax loss while cash-flowing — sheltering income. Rental losses are passive: they offset passive income freely, and up to $25,000/yr can offset ordinary (W-2) income if you actively participate and your MAGI is under $100k (phasing out to $0 by $150k); unused losses carry forward. On sale, claimed depreciation is recaptured at up to 25%, and gains may owe capital-gains tax (a 1031 exchange can defer both). Figures are a year-1 estimate at your 24.0% rate — not tax advice; consult a CPA.
Schools (NCES district)
- District
- Terrell County
- NCES district ID
- 1304860
- Math proficiency
- 7% ▼ -14.00%
- Reading proficiency
- 13% ▼ -9.00%
- Median HH income
- $31,887
- Composite
- 7.87/100
- National rank
- #9928
- State rank
- #167 of 174 in GA
Livability — Dawson
- Score
- 55/100
- State rank
- #508
- US rank
- #23135
Category grades
Schools grade is shown separately in the Schools card above.
Census & demographics
- Census place
- Dawson, GA
- Population (ZIP)
- 7,780
Population outlook (Terrell County) Hauer SSP2
- Today (2025)
- 8,041 people
- By 2030
- 7,444 · -7.4%
- By 2040
- 6,339 · -21.2%
- By 2050
- 5,415 · -32.7%
- By 2075
- 4,220 · -47.5%
- By 2100
- 3,750 · -53.4%
Race, ethnicity, and origin ACS 2023
- Neighborhood character
- Majority Black (64%)
- Race & ethnicity
- Black 64% White 33% Hispanic / Latino 2%
- Common ancestry
- Serbian 1% Lithuanian 1% Italian 1%
- Foreign-born
- 1% · Canada
- Languages at home
- 97% English-only · Spanish 3%
Political lean MEDSL · Terrell
- 2024 margin
- Toss-up / Even · D 51.9% · R 47.8%
- 2008→2024 swing
- -9.7pp toward R · 2008: 13.8pp · 2024: 4.1pp
- All cycles
- 2024: D+4.1 2020: D+8.4 2016: D+9.4 2012: D+16.1 2008: D+13.8
Not yet ingested
- Civics
- —
Market trends
- HPI YoY
- ▲ 1.56%
- Current HPI
- 190.252
- Rent YoY
- —
- Metro
- —
- State GDP YoY
- ▲ 2.66%
- F500 in state
- 28
Industry mix (Fortune 500 HQ in GA)
| Industry | F500 HQs | Revenue |
|---|---|---|
| Paper / Packaging | 2 | $29B |
|
||
| Retail | 1 | $160B |
|
||
| Transportation / Logistics | 1 | $91B |
|
||
| Airlines | 1 | $62B |
|
||
| Consumer Goods | 1 | $47B |
|
||
| Utilities | 1 | $25B |
|
||
Price history
-7.8% since first listed5 events — show timeline
- 2026-04-15 Pending — SWGABOR
- 2026-03-28 Price Changed $175,000 SWGABOR
- 2026-03-20 Relisted — SWGABOR
- 2026-03-15 Pending — SWGABOR
- 2026-02-21 Listed $189,900 SWGABOR
Property tax history
-0.9%/yrLatest (2025): $1,240 · -0.1% YoY. Source: county tax records.
Cash-flow waterfall
monthlySold comps — $/sqft
last 12 mo · ≤1 miLoading sold comps…