8347 Constellation Ln · Houston, TX
Flood risk 6/10 · Moderate
- FEMA flood zone
- X (unshaded)
- Chance of flooding over 30 yrs
- 0.67%
- Est. flood insurance / yr
- $507 – $1,088
Fire risk 1/10 · Minimal
- Est. fire insurance / yr
- $1,222 – $2,270
Heat risk 9/10 · Severe
- Hot days now (above 109°F)
- 7 days/yr
- Hot days in 30 yrs
- 25 days/yr
Wind risk 9/10 · Severe
- Chance of severe wind over 30 yrs
- 99.0%
Air-quality risk 2/10 · Minimal
- Unhealthy air days now
- 1 days/yr
- Unhealthy air days in 30 yrs
- 2 days/yr
Risk factors via First Street. Map © Google.
Why this score? — see what drove the D- grade
The composite is a weighted blend of 9 inputs, each scored 0–100. Each bar is that input's sub-score; the figure is the points it added to the 100-point composite (weight × sub-score).
- ARV discount +10.1/15.0
- Cash flow +8.4/30.0
- Livability +3.7/5.0
- Rent growth +3.0/5.0
- 1% rule +2.9/10.0
- Schools +2.7/10.0
- Condition / age +2.5/5.0
- DSCR +2.3/10.0
- Appreciation +0.0/10.0
$249,000
🖨 Deal sheet (PDF) 📄 Offer letter ✓ Due diligence
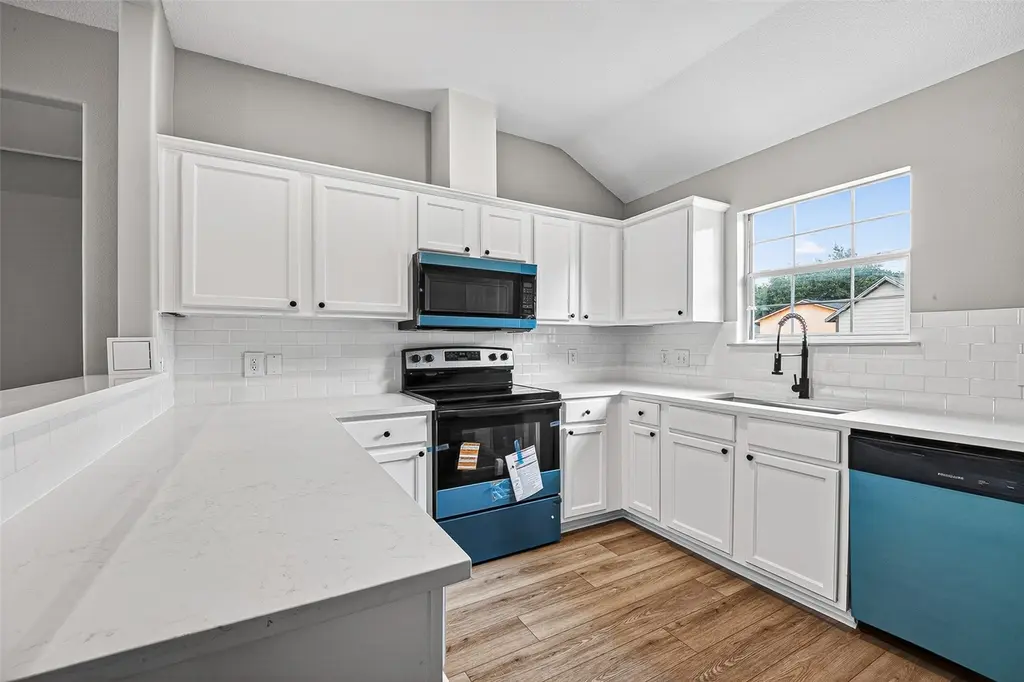
Listing remarks
Beautifully renovated one-story home featuring 4 bedrooms and situated on a large lot. The updated kitchen includes a new stove, dishwasher, microwave, and elegant quartz countertops. Extensive parking available in driveway. Vinyl woodgrain style flooring has been installed throughout the living room, kitchen, and bathrooms, while all four bedrooms feature brand-new carpet and ceiling fans for added comfort. The bathrooms have been tastefully renovated, and the interior has been refreshed with new paint, creating a clean and inviting atmosphere. Per seller, roof was replaced in 2026. Step outside to a generously sized backyard featuring a large concrete open-air patio, perfect for outdoor e
Key facts
- New stove
- Quartz countertops
- Extensive parking
Tags
Property features AI
Exterior
- Parking: No parking
- Utilities: Public water; Public sewer; Electric service
- Home design: Residential property; Single-story (entry level: first floor)
- Construction: Built in 2007; Brick and vinyl siding exterior; Composition roof; Slab foundation
- Exterior features: Located in a subdivision
Interior
- Kitchen: Dishwasher; Microwave
- Bedrooms: Primary bedroom (first floor, approx. 12 x 12); Bedroom (first floor, approx. 12 x 10); Bedroom (first floor, approx. 11 x 12); Bedroom (first floor, approx. 10 x 11)
- Bathrooms: 2 full bathrooms
- Heating & cooling: Central heating (electric); Central air conditioning (electric)
- Interior features: Quartz counters; Family room (first floor, approx. 14 x 18); Total of 5 rooms
Neighborhood map
What this means for you Summary
Snapshot
- This is a 3-bed/2.0-bath single-family listed at $249k.
Deal economics
- At list price, monthly cash flow is $-224 ($-3k/yr) — negative.
- To cash-flow at today's rent, offer at most $209k (15.9% below list).
- To meet the 1% rule (rent ≥ 1% of price), the offer needs to be $196k (21.1% below list).
- Recommended offer: $196k (21.1% below list) — sets the bar for 1% rule.
- Cap rate 5.2% vs local median 3.2% in Houston — top-decile yield for the area; either an underpriced asset or a hidden risk that comps aren't pricing in. Stress-test before assuming the spread holds.
Location & tenants
- Location reads 74/100 on livability (#184 in TX, #4,771 nationally) — a middle-class / working-renter tenant base. Strengths: amenities A+, cost of living A+, housing A+; Watch: crime F.
- Houston ISD (urban): math 27% / reading 35% proficiency, ranked #593 of 826 in TX (top 72%) — families likely to look elsewhere, expect single-tenant / working-renter base with shorter leases; 71% free/reduced lunch — lower-income household profile, screen leases tightly.
- Zoned schools: Thomas Middle (math 3% / reading 13%, grade F, #1,654 of 1,662 statewide, top 100%, 526 students, 98% FRL); Sterling H S (math 16% / reading 27%, grade F, #1,377 of 1,632 statewide, top 85%, 1,421 students, 92% FRL) — zoned schools average 95% FRL vs 71% district-wide (24 pts higher); higher-poverty schools than district average — tighter screening recommended.
- Zoned-school proficiency averages 15% at this address vs 31% district-wide (-16 pts) — the specific schools serving this property underperform the Houston ISD average; the district grade overstates school quality for this exact location.
- Market conditions: Rents rising (+2.2%/yr); 148 active listings in the ZIP; 11 comparable units currently listed for rent nearby; rentals leasing fast (median 12d on market — plan ~1-2 weeks tenant-placement turnaround); 29,883 units permitted in Harris County in 2024 (8,621 in 5+ unit buildings).
- This rent runs 34% of the median local income ($69k/yr) — at the standard rent-burdened threshold; future hikes will face affordability resistance.
Forward outlook
- Local home prices are declining (-3.0%/yr); year-one equity from $2k of loan paydown is wiped out by about $7k of value loss. Plan a longer hold.
- Harris County population projected at +47% by 2050 — long-run rental-demand tailwind backs the buy-and-hold thesis.
Negotiation context
- Only 10 days on market — expect competitive offers; lowballing is unlikely to land.
Risks & watch-outs
- Climate carrying-cost: major flood risk; severe wind risk, 99% chance of damaging wind over 30y; extreme-heat days projected 7→25/yr by 2055 (HVAC capex compounding) — expect insurance premiums to compound above CPI over the hold.
Questions for the listing agent
- What do current leases actually rent for vs. the listed asking? Can we see a recent rent roll and the last 12 months of T-12 income?
- Is there a deadline driving the sale (1031 exchange, divorce, estate, relocation)? That informs how much negotiation room exists.
- Schools are D-rated, which usually means shorter tenancies and higher turnover. Who's the typical renter profile here, and what's been the actual vacancy rate?
- Crime grade is F in this area — have there been break-ins, vandalism, or insurance claims at this property in the last 3 years? What carrier currently insures it and at what premium?
- The area grade is low — what's the realistic commute time and amenity access for the typical tenant pool here? Any planned neighborhood developments (good or bad) we should know about?
- What's the average days-on-market for RENTAL listings here right now (not sales)? A rising rental-DOM trend means longer vacancies and softer asking-rent achievability than the comps imply.
- What's the recent tenant-quality profile in this submarket — average credit score on applications, eviction rate, late-payment / NSF rate, and stable-employment percentage? A property-management company in the area should have these aggregated.
- How much new for-sale + rental construction is in the pipeline within 1–3 miles? Heavy new supply typically softens prices + rents 12–24 months out; constrained supply supports both.
Investment metrics
- 1% rule
- 0.79% ✗
- Cap rate
- 5.21%
- Cash-on-cash
- -3.86%
- DSCR
- 0.83
- GRM
- 10.6
CMA / ARV
- ARV (on-the-fly)
- $264,000
- Comps found
- 6
Show comp detail 6 sales within ~0.75 mi
| Address | Dist | Beds/Ba | Sqft | Sold | Price | $/sf | Match |
|---|---|---|---|---|---|---|---|
| 8314 Tavenor Ln | 0.18mi | 3/2.0 | 1,300 (-2%) | 12mo | $259,900 | $200 | 80 |
| 8418 Swiss Ln | 0.20mi | 3/2.0 | 1,344 (+2%) | 22mo | $275,000 | $205 | 69 |
| 8123 Tareyton Ln | 0.45mi | 3/2.0 | 1,181 (-10%) | 2mo | $215,000 | $182 | 60 |
| 8223 Holiday Ln | 0.42mi | 3/2.0 | 1,385 (+5%) | 20mo | $275,000 | $199 | 56 |
| 8047 Botany Ln | 0.49mi | 3/2.0 | 1,172 (-11%) | 16mo | $239,000 | $204 | 45 |
| 8207 Holiday Ln | 0.46mi | 3/2.0 | 1,516 (+15%) | 13mo | $250,000 | $165 | 44 |
Match score weights: distance 35% · size 25% · config 20% · recency 20%. Top-matched comps best support the ARV.
Projected returns pro-forma
-3.0% appreciation · 2.17% rent growth · sell at horizon
- IRR
- -23.7%
- Equity multiple
- 0.19×
- Total profit
- $-56,181
- Equity at exit
- $37,127
- IRR
- -21.1%
- Equity multiple
- -0.06×
- Total profit
- $-73,603
- Equity at exit
- $21,529
Cash invested: $69,720 (down + closing). Projections, not guarantees.
Landlord ↔ Tenant lean methodology
- Overall (STATE)
- 87 Strongly Landlord-Friendly
- State Texas
- 87 Strongly Landlord-Friendly · R+5
- County
- — inherits STATE
- City
- — inherits STATE
ZIP-level market 77075
- Home prices YoY
- -25.3%
- Rents YoY
- 2.2%
- Active inventory
- 148
- Price-to-rent
- 10.6×
Monthly cashflow live
- Estimated rent
- $1,964 high interval (Pro) →
- Mortgage (P&I)
- −$1,306
- Tax from tax record
- −$366 /mo · $4,394/yr
- Insurance
- −$104
- HOA
- −$0
- Vacancy / Maint / Mgmt
- −$412
- Net cashflow
- $-224
Break-even live
Sensitivity live
| Price | -10% $-83 | -5% $-154 | +0% $-224 | +5% $-295 | +10% $-365 |
|---|---|---|---|---|---|
| Rent | -10% $-379 | -5% $-302 | +0% $-224 | +5% $-146 | +10% $-69 |
| Rate | -1.0pp $-99 | -0.5pp $-161 | base $-224 | +0.5pp $-289 | +1.0pp $-354 |
UW: 25.0% down · 7.5% · 30yr · 1.5% tax · 5.0% vac · 8.0% maint · 8.0% mgmt
Financing live
Cash to close
- Down payment
- $62,250
- Closing costs
- $7,470
- Reserves months
- —
- Total cash needed
- —
Loan-product check · same deal, 3 products live
Conventional
25% down · 7.5% · 30yr
- Down + closing
- —
- Monthly P&I
- —
- Monthly cashflow
- —
- DSCR
- —
- Eligible?
- —
Personal DTI + credit; lowest rate.
DSCR
20% down · 8.5% · 30yr
- Down + closing
- —
- Monthly P&I
- —
- Monthly cashflow
- —
- DSCR
- —
- Eligible?
- —
No personal income docs; deal must DSCR.
Hard money
10% down · 12.0% · 12mo
- Down + closing
- —
- Monthly P&I
- —
- Monthly cashflow
- —
- DSCR
- —
- Eligible?
- —
Short-term bridge; refi at stabilization.
Rent comps 11 comps
| Address | Beds | Baths | Sqft | Rent | $/sqft | DOM | Units | Dist |
|---|---|---|---|---|---|---|---|---|
| 8020 Botany Ln Unit 1546255P Houston, TX | 3.0 | 2.0 | 1388 | $3,226 | $2.32 | 18d | 1 | 0.53mi |
| 8012 Folkstone Ln Houston, TX | 3.0 | 2.0 | 1589 | $1,900 | $1.20 | 45d | 1 | 0.99mi |
| 8238 Fuqua Gardens Dr Houston, TX | 3.0 | 2.5 | 1787 | $1,995 | $1.12 | 6d | 1 | 1.21mi |
| 9150 Blackhawk Blvd Houston, TX | 1.0–2.0 | 1.0–2.0 | 834 | $1,550 | $1.86 | 3d | 1 | 1.27mi |
| 7821 Fuqua St Houston, TX | 3.0 | 2.0 | 1408 | $1,700 | $1.21 | 45d | 1 | 1.33mi |
| 9130 Arledge St Houston, TX | 3.0 | 2.0 | 1253 | $1,700 | $1.36 | 45d | 1 | 1.37mi |
| 9757 Windwater Dr Unit 2047 Houston, TX | 2.0 | 2.0 | 1017 | $1,290 | $1.27 | 12d | 1 | 1.48mi |
| 9763 Windwater Dr Houston, TX | 2.0 | 1.0 | 916 | $1,149 | $1.25 | 45d | 1 | 1.49mi |
| 8911 Durham Manor Ln Houston, TX | 3.0 | 3.0 | 1848 | $2,201 | $1.19 | 6d | 1 | 1.49mi |
| 9757 Windwater Dr Unit 9814 Houston, TX | 2.0 | 2.0 | 1017 | $1,239 | $1.22 | 0d | 1 | 1.50mi |
| 9750 Windwater Dr Houston, TX | 1.0–2.0 | 1.0–2.0 | 856 | $1,788 | $2.09 | 0d | 16 | 1.50mi |
Listing history 7 events
-
2026-06-21days on market $249,000 Active 10 DOM
-
2026-06-18days on market $249,000 Active 7 DOM
-
2026-06-17days on market $249,000 Active 6 DOM
-
2026-06-16days on market $249,000 Active 5 DOM
-
2026-06-15days on market $249,000 Active 4 DOM
-
2026-06-13remarks 699-char remark
-
2026-06-13$249,000 Active 2 DOM
ⓘ Source: listings_history table (triggers on properties + properties_extension) + one-shot
backfill from property_details.listing_events for pre-trigger history.
Tax reassessment forecast TX · Resets to sale price
- Current annual tax
- $4,394 · $366/mo
- Projected year-2 tax
- $4,557 · $380/mo
- Expected delta
- +$162/yr (+$14/mo · 3.7%)
ⓘ Screening estimate from a state-policy table — verify with the county assessor before closing.
Climate risk First Street
- Flood 6/10 Major FEMA zone X (unshaded) · 67% chance over 30 yrs
- Wildfire 1/10 Low
- Heat 9/10 Extreme 7 d/yr ≥109°F today · 25 d/yr by 30 yrs out
- Wind 9/10 Extreme 99% chance of damaging wind over 30 yrs
- Air quality 2/10 Low 1 unhealthy d/yr today · 2 by 30 yrs out
Nearby sold comps map
Loading sold comps map…
Walkable amenities ~0.75 mi
Loading nearby amenities…
Taxation est. · year 1
- Rental income
- $23,570
- − Mortgage interest
- −$13,948
- − Property taxes
- −$4,394
- − Insurance
- −$1,245
- − Repairs & maintenance
- −$1,886
- − Management
- −$1,886
- − Depreciation
- −$7,244
- Taxable loss
- −$7,032
- Est. tax savings @ 24.0%
- +$1,688
- After-tax cash flow
- $-1,001/yr
For passive investors: Depreciation is non-cash, so a rental often shows a tax loss while cash-flowing — sheltering income. Rental losses are passive: they offset passive income freely, and up to $25,000/yr can offset ordinary (W-2) income if you actively participate and your MAGI is under $100k (phasing out to $0 by $150k); unused losses carry forward. On sale, claimed depreciation is recaptured at up to 25%, and gains may owe capital-gains tax (a 1031 exchange can defer both). Figures are a year-1 estimate at your 24.0% rate — not tax advice; consult a CPA.
Schools (NCES district)
- District
- Houston ISD
- NCES district ID
- 4823640
- Math proficiency
- 27% ▼ -18.00%
- Reading proficiency
- 35% ▼ -6.00%
- Median HH income
- $46,054
- Composite
- 26.63/100
- National rank
- #7173
- State rank
- #593 of 826 in TX
Livability — Houston
- Score
- 74/100
- State rank
- #184
- US rank
- #4771
Category grades
Schools grade is shown separately in the Schools card above.
Census & demographics
- Census place
- Houston, TX
- County
- Harris County · 4,702,590 people
- City population
- 3,226,434
- Metro
- Houston-The Woodlands-Sugar Land, TX
- Population (ZIP)
- 40,626
- Household income
- $69,191
- Rent vs Own
- Severe rent burden
- 1573.0
Population outlook (Harris County) Hauer SSP2
- Today (2025)
- 5,571,493 people
- By 2030
- 6,089,821 · +9.3%
- By 2040
- 7,142,806 · +28.2%
- By 2050
- 8,185,864 · +46.9%
- By 2075
- 10,574,329 · +89.8%
- By 2100
- 12,109,958 · +117.4%
Race, ethnicity, and origin ACS 2023
- Neighborhood character
- Predominantly Hispanic (71%)
- Race & ethnicity
- Hispanic / Latino 71% Two or more races 34% Black 14% White 7% Asian 6% Native American 1%
- Hispanic origin (detail)
- Mexican 53%
- Common ancestry
- Lithuanian 1%
- Foreign-born
- 30% · Canada, Vietnam, Jamaica
- Languages at home
- 34% English-only · Spanish 60% Vietnamese 6%
Political lean MEDSL · Harris
- 2024 margin
- Lean D (+5.5) · D 52.0% · R 46.4% · Other 1.6%
- 2008→2024 swing
- +3.9pp toward D · 2008: 1.6pp · 2024: 5.5pp
- All cycles
- 2024: D+5.5 2020: D+13.3 2016: D+12.4 2012: D+0.1 2008: D+1.6
Not yet ingested
- Civics
- —
Market trends
- HPI YoY
- ▼ -88.33%
- Current HPI
- 260.3733
- Rent YoY
- ▲ 2.17%
- Metro
- Houston-The Woodlands-Sugar Land, TX
- State GDP YoY
- ▲ 3.95%
- F500 in state
- 110
Industry mix (Fortune 500 HQ in TX)
| Industry | F500 HQs | Revenue |
|---|---|---|
| Energy | 16 | $1,198B |
|
||
| Technology | 5 | $198B |
|
||
| Engineering / Construction | 4 | $72B |
|
||
| Energy Services | 3 | $60B |
|
||
| Utilities | 3 | $41B |
|
||
| Healthcare | 2 | $330B |
|
||
Price history
5 events — show timeline
- 2026-06-11 Listed $249,000 HARMLS
- 2022-10-28 Sold (Public Records) — Public Records
- 2022-10-28 Sold (Public Records) — Public Records
- 2006-03-14 Sold (Public Records) — Public Records
- 1990-12-20 Sold (Public Records) — Public Records
Property tax history
+2.0%/yrLatest (2025): $4,394 · +1.5% YoY. Source: county tax records.
Cash-flow waterfall
monthlySold comps — $/sqft
last 12 mo · ≤1 miLoading sold comps…