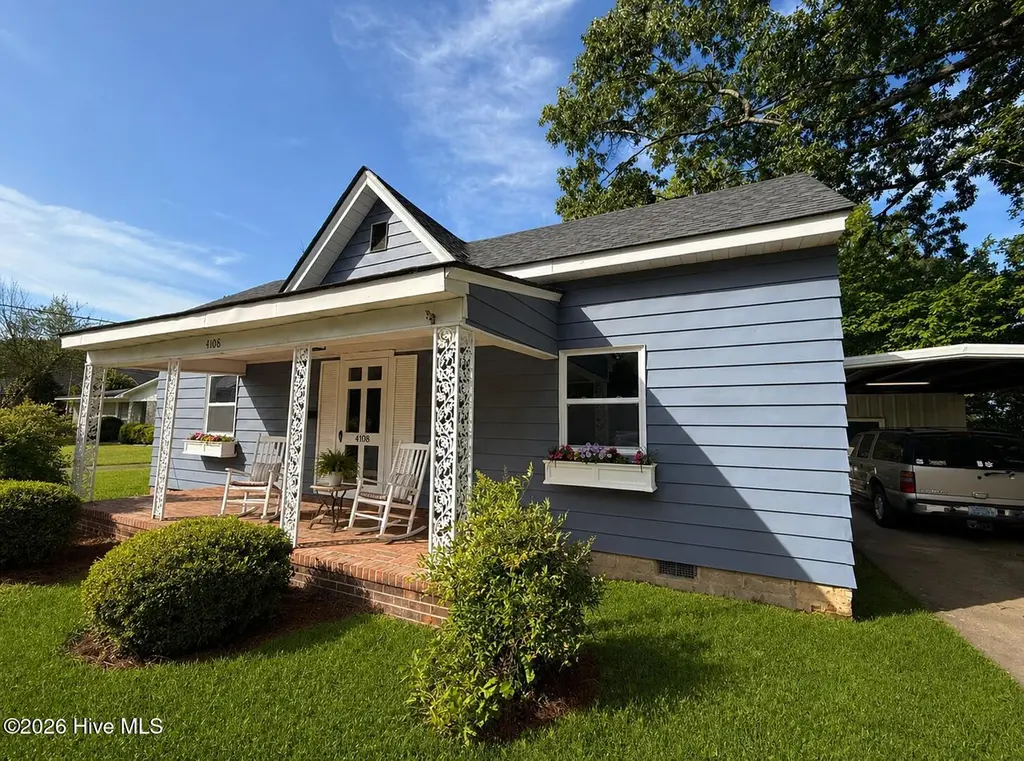
4108 Grimmersburg St · Farmville, NC
Flood risk 1/10 · Minimal
- FEMA flood zone
- X (unshaded)
- Chance of flooding over 30 yrs
- 0.0%
- Est. flood insurance / yr
- $507 – $1,088
Fire risk 3/10 · Minor
- Est. fire insurance / yr
- $906 – $1,684
Heat risk 8/10 · Major
- Hot days now (above 107°F)
- 7 days/yr
- Hot days in 30 yrs
- 18 days/yr
Wind risk 8/10 · Major
- Chance of severe wind over 30 yrs
- 80.0%
Air-quality risk 3/10 · Minor
- Unhealthy air days now
- 3 days/yr
- Unhealthy air days in 30 yrs
- 3 days/yr
Risk factors via First Street. Map © Google.
Why this score? — see what drove the B- grade
The composite is a weighted blend of 9 inputs, each scored 0–100. Each bar is that input's sub-score; the figure is the points it added to the 100-point composite (weight × sub-score).
- Cash flow +27.9/30.0
- ARV discount +13.1/15.0
- DSCR +9.9/10.0
- 1% rule +6.8/10.0
- Schools +3.6/10.0
- Livability +3.3/5.0
- Rent growth +2.5/5.0
- Condition / age +2.5/5.0
- Appreciation +0.0/10.0
$190,000
🖨 Deal sheet 📄 Offer letter ✓ Due diligence
Listing remarks
Step into the charm of small-town living with this beautifully reimagined farmhouse at 4108 Grimmersburg in the heart of downtown Farmville. From the moment you arrive, the inviting front porch sets the tone--perfect for morning coffee, evening conversations, and soaking in the character this home effortlessly delivers. Situated on a generous lot, the fully fenced backyard offers plenty of space for pets, play, or entertaining, while the carport and detached storage building provide everyday convenience and functionality. What truly sets this home apart is its unbeatable walkability. A sidewalk just outside your door connects you to everything that makes downtown Farmville so special--local
Key facts
- Sidewalk to downtown
- Front porch
- Carport
Tags
Property features AI
Exterior
- Parking: Has a 1-space carport; Concrete parking surface
- Utilities: Water connected
- Home design: Single-family residence; One story; Entry level is 1
- Construction: Aluminum siding and frame construction; Shingle roof; Crawl space foundation; Built on one level (single story)
- Exterior features: Front porch; Back yard fencing; Has a view
Interior
- Kitchen: Eat-in kitchen
- Bedrooms: Total of 6 rooms (includes bedrooms and living spaces)
- Bathrooms: 1 full bathroom
- Heating & cooling: Heat pump (heating and cooling); Electric heating backup
- Interior features: Entrance foyer; Built-in bookcases; Ceiling fans; Eat-in kitchen; Window coverings
- Laundry & utility: Crawl space basement
Neighborhood map
What this means for you Summary
Snapshot
- This is a 3-bed/1.0-bath single-family listed at $190k.
Deal economics
- At list price, monthly cash flow is $585 ($7k/yr) — positive.
- The deal already cash-flows at list — no discount required.
- Meets the 1% rule at list price ($2k rent vs $190k).
- Cap rate 10.0% vs local median 4.0% in Farmville — top-decile yield for the area; either an underpriced asset or a hidden risk that comps aren't pricing in. Stress-test before assuming the spread holds.
Location & tenants
- Location reads 66/100 on livability (#272 in NC) — a middle-class / working-renter tenant base. Strengths: cost of living A+, health & safety A+, housing A; Watch: amenities C-, employment C-, crime F.
- Pitt County Schools (rural): math 41% / reading 44% proficiency, ranked #100 of 178 in NC (top 56%) — families likely to look elsewhere, expect single-tenant / working-renter base with shorter leases.
- Zoned schools: H B Sugg Elementary (401 students, 99% FRL); Farmville Middle (math 31% / reading 35%, grade F, #305 of 475 statewide, top 65%, 611 students, 100% FRL); Farmville Central High (math 42% / reading 47%, grade F, #352 of 535 statewide, top 68%, 789 students, 99% FRL) — zoned schools average 99% FRL vs 56% district-wide (43 pts higher); higher-poverty schools than district average — tighter screening recommended.
- Market conditions: 86 active listings in the ZIP; 1 comparable units currently listed for rent nearby; 1,300 units permitted in Pitt County in 2024 (204 in 5+ unit buildings).
Forward outlook
- Local home prices are declining (-3.0%/yr); year-one equity from $1k of loan paydown is wiped out by about $6k of value loss. Plan a longer hold.
- Pitt County population projected at +22% by 2050 — long-run rental-demand tailwind backs the buy-and-hold thesis.
- At projected returns (-3.0% appreciation + 3.0% rent growth), your $53k cash investment doubles in ~9 years — after that, you're playing with house money.
Negotiation context
- Only 6 days on market — expect competitive offers; lowballing is unlikely to land.
- Current owner paid $60k; list at $190k implies a 217% gain — meaningful room to come down on a strong offer.
Risks & watch-outs
- Watch-outs: built in 1940 — expect roof / HVAC / electrical / plumbing capex.
- Climate carrying-cost: severe wind risk, 80% chance of damaging wind over 30y; extreme-heat days projected 7→18/yr by 2055 (HVAC capex compounding) — expect insurance premiums to compound above CPI over the hold.
Questions for the listing agent
- Built in 1940 — when were the roof, HVAC, electrical panel, plumbing, and water heater last replaced?
- Is there a deadline driving the sale (1031 exchange, divorce, estate, relocation)? That informs how much negotiation room exists.
- Schools are F-rated, which usually means shorter tenancies and higher turnover. Who's the typical renter profile here, and what's been the actual vacancy rate?
- Crime grade is F in this area — have there been break-ins, vandalism, or insurance claims at this property in the last 3 years? What carrier currently insures it and at what premium?
- What's the average days-on-market for RENTAL listings here right now (not sales)? A rising rental-DOM trend means longer vacancies and softer asking-rent achievability than the comps imply.
- What's the recent tenant-quality profile in this submarket — average credit score on applications, eviction rate, late-payment / NSF rate, and stable-employment percentage? A property-management company in the area should have these aggregated.
- How much new for-sale + rental construction is in the pipeline within 1–3 miles? Heavy new supply typically softens prices + rents 12–24 months out; constrained supply supports both.
Investment metrics
- 1% rule
- 1.18% ✓
- Cap rate
- 9.99%
- Cash-on-cash
- 13.20%
- DSCR
- 1.59
- GRM
- 7.0
CMA / ARV
- ARV (on-the-fly)
- $216,836
- Comps found
- 12
Show comp detail 12 sales within ~0.75 mi
| Address | Dist | Beds/Ba | Sqft | Sold | Price | $/sf | Match |
|---|---|---|---|---|---|---|---|
| 4146 East Pine St | 0.32mi | 3/2.0 | 1,430 (-0%) | 1mo | $140,000 | $98 | 80 |
| 3242 N Contentnea St | 0.29mi | 3/1.0 | 1,393 (-3%) | 8mo | $210,000 | $151 | 75 |
| 185 Lang Farm Rd | 0.38mi | 3/2.5 | 1,404 (-2%) | 3mo | $214,991 | $153 | 70 |
| 3222 North Contentnea St | 0.32mi | 4/2.0 (+1) | 1,520 (+6%) | 5mo | $127,500 | $84 | 62 |
| 4008 Davis Cir | 0.18mi | 2/2.0 (-1) | 1,274 (-11%) | 10mo | $212,500 | $167 | 56 |
| 3209 North Waverly St | 0.40mi | 3/2.0 | 1,600 (+11%) | 4mo | $225,000 | $141 | 55 |
| 4205 W West Prince Rd | 0.54mi | 3/2.0 | 1,568 (+9%) | 6mo | $227,000 | $145 | 50 |
| 3178 N Contentnea St | 0.40mi | 3/2.0 | 1,295 (-10%) | 13mo | $180,000 | $139 | 50 |
| 3530 S Pitt St | 0.46mi | 3/2.0 | 1,650 (+15%) | 2mo | $165,000 | $100 | 48 |
| 4252 Pinehurst Ct | 0.64mi | 3/2.0 | 1,565 (+9%) | 5mo | $338,126 | $216 | 47 |
| 4266 Pinehurst Ct | 0.68mi | 3/2.0 | 1,617 (+13%) | 4mo | $338,126 | $209 | 39 |
| 4272 Pinehurst Ct | 0.68mi | 3/2.0 | 1,615 (+12%) | 10mo | $300,000 | $186 | 35 |
Match score weights: distance 35% · size 25% · config 20% · recency 20%. Top-matched comps best support the ARV.
Projected returns pro-forma
-3.0% appreciation · 3.0% rent growth · sell at horizon
- IRR
- 3.1%
- Equity multiple
- 1.12×
- Total profit
- $6,437
- Equity at exit
- $28,330
- IRR
- 12.7%
- Equity multiple
- 2.00×
- Total profit
- $53,427
- Equity at exit
- $16,428
Cash invested: $53,200 (down + closing). Projections, not guarantees.
Landlord ↔ Tenant lean methodology
- Overall (STATE)
- 85 Strongly Landlord-Friendly
- State North Carolina
- 85 Strongly Landlord-Friendly · R+3
- County
- — inherits STATE
- City
- — inherits STATE
ZIP-level market 27828
- Home prices YoY
- -20.9%
- Active inventory
- 86
- Price-to-rent
- 7.0×
Monthly cashflow live
- Estimated rent
- $2,250 medium interval (Pro) →
- Mortgage (P&I)
- −$996
- Tax from tax record
- −$117 /mo · $1,402/yr
- Insurance
- −$79
- HOA
- −$0
- Vacancy / Maint / Mgmt
- −$472
- Net cashflow
- $585
Break-even live
UW: 25.0% down · 7.5% · 30yr · 1.5% tax · 5.0% vac · 8.0% maint · 8.0% mgmt
Financing live
Cash to close
- Down payment
- $47,500
- Closing costs
- $5,700
- Reserves months
- —
- Total cash needed
- —
Loan-product check · same deal, 3 products live
Conventional
25% down · 7.5% · 30yr
- Down + closing
- —
- Monthly P&I
- —
- Monthly cashflow
- —
- DSCR
- —
- Eligible?
- —
Personal DTI + credit; lowest rate.
DSCR
20% down · 8.5% · 30yr
- Down + closing
- —
- Monthly P&I
- —
- Monthly cashflow
- —
- DSCR
- —
- Eligible?
- —
No personal income docs; deal must DSCR.
Hard money
10% down · 12.0% · 12mo
- Down + closing
- —
- Monthly P&I
- —
- Monthly cashflow
- —
- DSCR
- —
- Eligible?
- —
Short-term bridge; refi at stabilization.
Rent comps 1 comps
| Address | Beds | Baths | Sqft | Rent | $/sqft | DOM | Units | Dist |
|---|---|---|---|---|---|---|---|---|
| 4022 East Horne Ave Farmville, NC | 3.0 | 2.0 | 1700 | $2,250 | $1.32 | 21d | 1 | 0.13mi |
Listing history 3 events
-
2026-05-01status Pending
-
2026-04-28$190,000 Active
-
2001-10-01soldstatus $60,000
ⓘ Source: listings_history table (triggers on properties + properties_extension) + one-shot
backfill from property_details.listing_events for pre-trigger history.
Tax reassessment forecast NC · Resets to sale price
- Current annual tax
- $1,402 · $117/mo
- Projected year-2 tax
- $1,558 · $130/mo
- Expected delta
- +$156/yr (+$13/mo · 11.1%)
ⓘ Screening estimate from a state-policy table — verify with the county assessor before closing.
Climate risk First Street
- Flood 1/10 Low FEMA zone X (unshaded) · 0% chance over 30 yrs
- Wildfire 3/10 Moderate
- Heat 8/10 Severe 7 d/yr ≥107°F today · 18 d/yr by 30 yrs out
- Wind 8/10 Severe 80% chance of damaging wind over 30 yrs
- Air quality 3/10 Moderate 3 unhealthy d/yr today · 3 by 30 yrs out
Nearby sold comps map
Loading sold comps map…
Walkable amenities ~0.75 mi
Loading nearby amenities…
Taxation est. · year 1
- Rental income
- $27,000
- − Mortgage interest
- −$10,643
- − Property taxes
- −$1,402
- − Insurance
- −$950
- − Repairs & maintenance
- −$2,160
- − Management
- −$2,160
- − Depreciation
- −$5,527
- Taxable income
- $4,158
- Est. tax owed @ 24.0%
- −$998
- After-tax cash flow
- $6,023/yr
For passive investors: Depreciation is non-cash, so a rental often shows a tax loss while cash-flowing — sheltering income. Rental losses are passive: they offset passive income freely, and up to $25,000/yr can offset ordinary (W-2) income if you actively participate and your MAGI is under $100k (phasing out to $0 by $150k); unused losses carry forward. On sale, claimed depreciation is recaptured at up to 25%, and gains may owe capital-gains tax (a 1031 exchange can defer both). Figures are a year-1 estimate at your 24.0% rate — not tax advice; consult a CPA.
Schools (NCES district)
- District
- Pitt County Schools
- NCES district ID
- 3700012
- Math proficiency
- 41% ▬ 0.00%
- Reading proficiency
- 44% ▲ 2.00%
- Median HH income
- $40,631
- Composite
- 35.67/100
- National rank
- #4877
- State rank
- #100 of 178 in NC
Livability — Farmville
- Score
- 66/100
- State rank
- #272
- US rank
- #11852
Category grades
Schools grade is shown separately in the Schools card above.
Census & demographics
- Census place
- Farmville, NC
- Population (ZIP)
- 8,155
Population outlook (Pitt County) Hauer SSP2
- Today (2025)
- 194,585 people
- By 2030
- 203,756 · +4.7%
- By 2040
- 220,807 · +13.5%
- By 2050
- 236,614 · +21.6%
- By 2075
- 275,940 · +41.8%
- By 2100
- 300,058 · +54.2%
Race, ethnicity, and origin ACS 2023
- Neighborhood character
- Diverse neighborhood (Simpson 0.60)
- Race & ethnicity
- White 50% Black 37% Two or more races 6% Hispanic / Latino 6%
- Hispanic origin (detail)
- Mexican 3% Puerto Rican 3%
- Common ancestry
- Subsaharan African 2% Slovak 1% Italian 1%
- Foreign-born
- 3% · Canada
- Languages at home
- 95% English-only · Spanish 3% Russian/Polish/Slavic 1%
Political lean MEDSL · Pitt
- 2024 margin
- Lean D (+6.0) · D 52.5% · R 46.5% · Other 1.1%
- 2008→2024 swing
- -2.8pp toward R · 2008: 8.8pp · 2024: 6.0pp
- All cycles
- 2024: D+6.0 2020: D+9.4 2016: D+7.4 2012: D+6.7 2008: D+8.8
Not yet ingested
- Civics
- —
Market trends
- HPI YoY
- ▼ -51.30%
- Current HPI
- 193.5248
- Rent YoY
- —
- Metro
- —
- State GDP YoY
- ▲ 3.28%
- F500 in state
- 26
Industry mix (Fortune 500 HQ in NC)
| Industry | F500 HQs | Revenue |
|---|---|---|
| Financial Services | 2 | $213B |
|
||
| Retail | 2 | $95B |
|
||
| Industrial Conglomerate | 1 | $38B |
|
||
| Metals / Steel | 1 | $35B |
|
||
| Utilities | 1 | $30B |
|
||
| Industrial Machinery | 1 | $19B |
|
||
Price history
+216.7% since first listed3 events — show timeline
- 2026-05-01 Pending — Hive MLS
- 2026-04-28 Listed $190,000 Hive MLS
- 2001-10-01 Sold (Public Records) $60,000 Public Records
Property tax history
+9.1%/yrLatest (2025): $1,402 · +0.9% YoY. Source: county tax records.
Cash-flow waterfall
monthlySold comps — $/sqft
last 12 mo · ≤1 miLoading sold comps…