 🏷️ Likely Rental
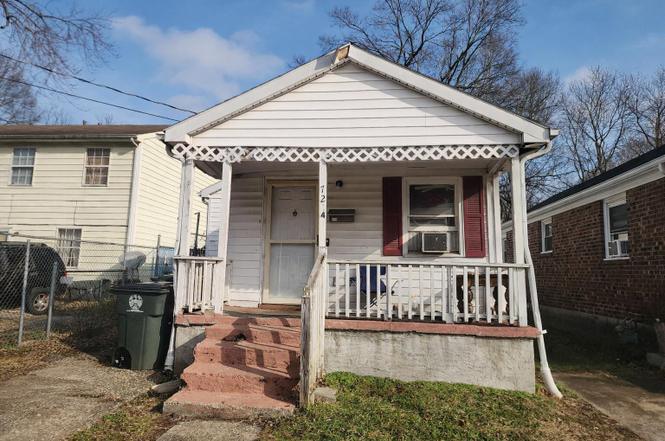
724 Florence Ave · Lexington-Fayette, KY
Flood risk 1/10 · Minimal
- FEMA flood zone
- X (unshaded)
- Chance of flooding over 30 yrs
- 0.0%
- Est. flood insurance / yr
- $507 – $1,088
Fire risk 1/10 · Minimal
- Est. fire insurance / yr
- $839 – $1,559
Heat risk 4/10 · Minor
- Hot days now (above 101°F)
- 7 days/yr
- Hot days in 30 yrs
- 18 days/yr
Wind risk 2/10 · Minimal
- Chance of severe wind over 30 yrs
- 2.0%
Air-quality risk 2/10 · Minimal
- Unhealthy air days now
- 0 days/yr
- Unhealthy air days in 30 yrs
- 2 days/yr
Risk factors via First Street. Map © Google.
Why this score? — see what drove the B+ grade
The composite is a weighted blend of 9 inputs, each scored 0–100. Each bar is that input's sub-score; the figure is the points it added to the 100-point composite (weight × sub-score).
- Cash flow +30.0/30.0
- ARV discount +15.0/15.0
- DSCR +10.0/10.0
- 1% rule +8.6/10.0
- Rent growth +5.0/5.0
- Schools +3.4/10.0
- Livability +2.5/5.0
- Condition / age +2.5/5.0
- Appreciation +0.0/10.0
$109,500
🖨 Deal sheet (PDF) 📄 Offer letter ✓ Due diligence
Listing remarks MLS
Great chance to become an investor in real estate! Has been rented for $550/mo! Several updates, but needs work. SOLD AS IS Seller says Bring Offers!
Key facts
- Location to bus line
- Location to downtown
- Location to parks
Tags
Property features AI
Exterior
- Parking: Driveway
- Utilities: Public water; Public sewer; Electricity connected; Natural gas connected
- Home design: House; Composition roof; Vinyl siding
- Construction: Block foundation
- Exterior features: Chain link fencing (partial)
Interior
- Kitchen: Range
- Bedrooms: 2 total rooms
- Flooring: Vinyl; Wood
- Bathrooms: 1 full bathroom
- Heating & cooling: Forced air heating (natural gas); Window air conditioning units
- Interior features: Range; Washer hookup; Electric dryer hookup
- Laundry & utility: Washer hookup; Electric dryer hookup
Neighborhood map
What this means for you Summary
Snapshot
- This is a 3-bed/1.0-bath single-family listed at $110k.
Deal economics
- At list price, monthly cash flow is $522 ($6k/yr) — positive.
- The deal already cash-flows at list — no discount required.
- Meets the 1% rule at list price ($1k rent vs $110k).
- Recommended offer: $96k (12.0% below list) — sets the bar for market timing.
- Cap rate 12.0% vs local median 3.8% in Lexington-Fayette — top-decile yield for the area; either an underpriced asset or a hidden risk that comps aren't pricing in. Stress-test before assuming the spread holds.
Location & tenants
- Location reads: area grade B — affects rentability + tenant quality, not the cash-flow math above.
- Fayette County (urban): math 35% / reading 45% proficiency, ranked #27 of 165 in KY (top 16%) — families likely to look elsewhere, expect single-tenant / working-renter base with shorter leases.
- Zoned schools: Booker T Washington Elementary School (math 17% / reading 17%, grade F, #607 of 676 statewide, top 91%, 313 students, 83% FRL); Winburn Middle School (math 26% / reading 36%, grade F, #138 of 217 statewide, top 65%, 800 students, 66% FRL); Paul Laurence Dunbar High School (math 51% / reading 49%, grade D+, #12 of 254 statewide, top 4%, 1,946 students, 46% FRL) — zoned schools average 65% FRL vs 44% district-wide (20 pts higher); higher-poverty schools than district average — tighter screening recommended.
- Market conditions: Rents rising fast (+11.8%/yr); 83 active listings in the ZIP; 11 comparable units currently listed for rent nearby; rentals at typical pace (median 25d on market — plan ~3-4 weeks tenant-placement turnaround); lower-income renter base — watch delinquency; 1,036 units permitted in Fayette County in 2024 (542 in 5+ unit buildings).
- At $1,490/mo this rent would consume 61% of the median local household income ($29k/yr) (locally 2644% of renters already pay >50% of income on rent) — very limited rent-growth headroom before tenants either downsize or default.
Forward outlook
- Local home prices are declining (-3.0%/yr); year-one equity from $757 of loan paydown is wiped out by about $3k of value loss. Plan a longer hold.
- Fayette County population projected at +35% by 2050 — long-run rental-demand tailwind backs the buy-and-hold thesis.
- At projected returns (-3.0% appreciation + 8.0% rent growth), your $31k cash investment doubles in ~5 years — after that, you're playing with house money.
Negotiation context
- It's been on market 123 days — a 12% lower offer ($96k) is reasonable based on typical stale-listing flexibility.
- 4 sale attempts since 19y ago with the ask held roughly flat each time — persistent listings suggest the price (not the market) is what's stuck; bring a comps-based counter.
- Current owner paid $50k; list at $110k implies a 117% gain — meaningful room to come down on a strong offer.
Risks & watch-outs
- Watch-outs: built in 1920 — expect roof / HVAC / electrical / plumbing capex.
Questions for the listing agent
- It's been on market 123 days. Have you received any prior offers? Is the seller open to a 12% concession, seller financing, or rate buy-down credit?
- Built in 1920 — when were the roof, HVAC, electrical panel, plumbing, and water heater last replaced?
- Why hasn't it sold? Are there any deal-killer items the seller is aware of (foundation, flood, title, zoning, code violations)?
- Is there a deadline driving the sale (1031 exchange, divorce, estate, relocation)? That informs how much negotiation room exists.
- What's the average days-on-market for RENTAL listings here right now (not sales)? A rising rental-DOM trend means longer vacancies and softer asking-rent achievability than the comps imply.
- What's the recent tenant-quality profile in this submarket — average credit score on applications, eviction rate, late-payment / NSF rate, and stable-employment percentage? A property-management company in the area should have these aggregated.
- How much new for-sale + rental construction is in the pipeline within 1–3 miles? Heavy new supply typically softens prices + rents 12–24 months out; constrained supply supports both.
Investment metrics
- 1% rule
- 1.36% ✓
- Cap rate
- 12.01%
- Cash-on-cash
- 20.42%
- DSCR
- 1.91
- GRM
- 6.1
CMA / ARV
- ARV (on-the-fly)
- $161,875
- Comps found
- 12
Show comp detail 12 sales within ~0.75 mi
| Address | Dist | Beds/Ba | Sqft | Sold | Price | $/sf | Match |
|---|---|---|---|---|---|---|---|
| 430 Lindberg Dr | 0.04mi | 3/1.5 | 920 (+5%) | 4mo | $170,000 | $185 | 84 |
| 407 Glen Arvin Ave | 0.13mi | 3/1.0 | 896 (+2%) | 19mo | $185,000 | $206 | 74 |
| 869 Whitney Ave | 0.32mi | 2/1.0 (-1) | 893 (+2%) | 7mo | $70,000 | $78 | 71 |
| 742 Breathitt Ave | 0.06mi | 2/1.0 (-1) | 760 (-13%) | 1mo | $155,000 | $204 | 70 |
| 447 Greenwood Ave | 0.22mi | 2/1.0 (-1) | 804 (-8%) | 4mo | $115,000 | $143 | 68 |
| 962 Waverly Dr | 0.45mi | 2/2.0 (-1) | 900 (+3%) | 3mo | $199,000 | $221 | 63 |
| 806 Charles Ave | 0.41mi | 2/1.0 (-1) | 882 (+1%) | 17mo | $94,000 | $107 | 60 |
| 481 Dominican Dr | 0.52mi | 3/1.0 | 925 (+6%) | 10mo | $166,000 | $179 | 58 |
| 482 Erie Rd | 0.55mi | 3/1.0 | 864 (-1%) | 19mo | $177,900 | $206 | 56 |
| 459 Erie Rd | 0.57mi | 3/1.0 | 952 (+9%) | 3mo | $193,500 | $203 | 56 |
| 826 Charles Ave | 0.37mi | 2/1.0 (-1) | 800 (-9%) | 16mo | $80,000 | $100 | 51 |
| 101 Thompson Rd | 0.70mi | 2/1.0 (-1) | 974 (+11%) | 10mo | $150,000 | $154 | 35 |
Match score weights: distance 35% · size 25% · config 20% · recency 20%. Top-matched comps best support the ARV.
Projected returns pro-forma
-3.0% appreciation · 8.0% rent growth · sell at horizon
- IRR
- 17.8%
- Equity multiple
- 1.76×
- Total profit
- $23,324
- Equity at exit
- $16,327
- IRR
- 29.4%
- Equity multiple
- 4.22×
- Total profit
- $98,776
- Equity at exit
- $9,468
Cash invested: $30,660 (down + closing). Projections, not guarantees.
Landlord ↔ Tenant lean methodology
- Overall (STATE)
- 83 Strongly Landlord-Friendly
- State Kentucky
- 83 Strongly Landlord-Friendly · R+16
- County
- — inherits STATE
- City
- — inherits STATE
ZIP-level market 40508
- Rents YoY
- 11.8%
- Active inventory
- 83
- Price-to-rent
- 6.1×
Monthly cashflow live
- Estimated rent
- $1,490 high interval (Pro) →
- Mortgage (P&I)
- −$574
- Tax from tax record
- −$35 /mo · $423/yr
- Insurance
- −$46
- HOA
- −$0
- Vacancy / Maint / Mgmt
- −$313
- Net cashflow
- $522
Break-even live
Sensitivity live
| Price | -10% $584 | -5% $553 | +0% $522 | +5% $491 | +10% $460 |
|---|---|---|---|---|---|
| Rent | -10% $404 | -5% $463 | +0% $522 | +5% $581 | +10% $640 |
| Rate | -1.0pp $577 | -0.5pp $550 | base $522 | +0.5pp $493 | +1.0pp $465 |
UW: 25.0% down · 7.5% · 30yr · 1.5% tax · 5.0% vac · 8.0% maint · 8.0% mgmt
Financing live
Cash to close
- Down payment
- $27,375
- Closing costs
- $3,285
- Reserves months
- —
- Total cash needed
- —
Loan-product check · same deal, 3 products live
Conventional
25% down · 7.5% · 30yr
- Down + closing
- —
- Monthly P&I
- —
- Monthly cashflow
- —
- DSCR
- —
- Eligible?
- —
Personal DTI + credit; lowest rate.
DSCR
20% down · 8.5% · 30yr
- Down + closing
- —
- Monthly P&I
- —
- Monthly cashflow
- —
- DSCR
- —
- Eligible?
- —
No personal income docs; deal must DSCR.
Hard money
10% down · 12.0% · 12mo
- Down + closing
- —
- Monthly P&I
- —
- Monthly cashflow
- —
- DSCR
- —
- Eligible?
- —
Short-term bridge; refi at stabilization.
Rent comps 11 comps
| Address | Beds | Baths | Sqft | Rent | $/sqft | DOM | Units | Dist |
|---|---|---|---|---|---|---|---|---|
| 405 Roosevelt Blvd Lexington, KY | 3.0 | 1.0 | 960 | $1,495 | $1.56 | 15d | 1 | 0.09mi |
| 723 Charles Ave Lexington, KY | 3.0 | 1.0 | 992 | $1,300 | $1.31 | 15d | 1 | 0.46mi |
| 330 Newtown Pike Lexington, KY | 1.0–3.0 | 1.0–2.0 | 976 | $1,377 | $1.41 | 25d | 1 | 0.60mi |
| 345 Blackburn Ave Lexington, KY | 2.0 | 2.0 | 946 | $1,925 | $2.03 | 15d | 1 | 0.72mi |
| 301 Thompson Rd Lexington, KY | 3.0 | 1.0 | 1008 | $1,450 | $1.44 | 15d | 1 | 0.83mi |
| 208 Clyde St Lexington, KY | 2.0 | 1.0 | 982 | $1,100 | $1.12 | 22d | 1 | 0.92mi |
| 832 W High St Unit 1 Lexington, KY | 3.0 | 1.5 | 900 | $1,400 | $1.56 | 25d | 1 | 1.07mi |
| 222 W Sixth St Lexington, KY | 3.0 | 1.5 | 1050 | $1,150 | $1.10 | 25d | 1 | 1.24mi |
| 115 W Loudon Ave Unit L97 Lexington, KY | 3.0 | 2.0 | 960 | $980 | $1.02 | 25d | 1 | 1.42mi |
| 434 N Martin Luther King Blvd #201 Lexington, KY | 2.0 | 2.0 | 950 | $1,450 | $1.53 | 25d | 1 | 1.49mi |
| 149 Old Towne Walk Lexington, KY | 1.0–3.0 | 1.0–3.0 | 906 | $1,964 | $2.17 | 25d | 1 | 1.49mi |
Listing history 29 events
-
2026-06-22days on market $109,500 Active 123 DOM
-
2026-06-18days on market $109,500 Active 120 DOM
-
2026-06-17days on market $109,500 Active 119 DOM
-
2026-06-16days on market $109,500 Active 118 DOM
-
2026-06-15days on market $109,500 Active 117 DOM
-
2026-06-14days on market $109,500 Active 115 DOM
-
2026-06-13days on market $109,500 Active 114 DOM
-
2026-06-10days on market $109,500 Active 112 DOM
-
2026-06-09days on market $109,500 Active 111 DOM
-
2026-06-08days on market $109,500 Active 110 DOM
-
2026-06-07days on market $109,500 Active 109 DOM
-
2026-06-05days on market $109,500 Active 106 DOM
-
2026-06-03days on market $109,500 Active 105 DOM
-
2026-06-02days on market $109,500 Active 104 DOM
-
2026-06-01days on market $109,500 Active 103 DOM
-
2026-05-31days on market $109,500 Active 102 DOM
-
2026-02-13$109,500 Active
-
2021-07-29soldstatus $50,400
-
2020-01-24soldstatus $24,000
-
2016-04-21soldstatus $35,000
-
2016-04-21soldstatus $24,000
-
2016-04-20soldstatus $24,000 Sold 149-char remark
Show marketing remark (149 chars)
Great chance to become an investor in real estate! Has been rented for $550/mo! Several updates, but needs work. SOLD AS IS Seller says Bring Offers!
-
2016-04-01status Pending 149-char remark
Show marketing remark (149 chars)
Great chance to become an investor in real estate! Has been rented for $550/mo! Several updates, but needs work. SOLD AS IS Seller says Bring Offers!
-
2016-03-02price $33,000 149-char remark
Show marketing remark (149 chars)
Great chance to become an investor in real estate! Has been rented for $550/mo! Several updates, but needs work. SOLD AS IS Seller says Bring Offers!
-
2016-01-18$38,000 Active 149-char remark
Show marketing remark (149 chars)
Great chance to become an investor in real estate! Has been rented for $550/mo! Several updates, but needs work. SOLD AS IS Seller says Bring Offers!
-
2010-02-18historical
-
2009-08-22$55,000
-
2008-09-30historical
-
2007-12-11$55,000
ⓘ Source: listings_history table (triggers on properties + properties_extension) + one-shot
backfill from property_details.listing_events for pre-trigger history.
Tax reassessment forecast KY · Resets to sale price
- Current annual tax
- $423 · $35/mo
- Projected year-2 tax
- $942 · $78/mo
- Expected delta
- +$519/yr (+$43/mo · 122.8%)
ⓘ Screening estimate from a state-policy table — verify with the county assessor before closing.
Climate risk First Street
- Flood 1/10 Low FEMA zone X (unshaded) · 0% chance over 30 yrs
- Wildfire 1/10 Low
- Heat 4/10 Moderate 7 d/yr ≥101°F today · 18 d/yr by 30 yrs out
- Wind 2/10 Low 2% chance of damaging wind over 30 yrs
- Air quality 2/10 Low 0 unhealthy d/yr today · 2 by 30 yrs out
Nearby sold comps map
Loading sold comps map…
Walkable amenities ~0.75 mi
Loading nearby amenities…
Taxation est. · year 1
- Rental income
- $17,877
- − Mortgage interest
- −$6,134
- − Property taxes
- −$423
- − Insurance
- −$548
- − Repairs & maintenance
- −$1,430
- − Management
- −$1,430
- − Depreciation
- −$3,185
- Taxable income
- $4,727
- Est. tax owed @ 24.0%
- −$1,135
- After-tax cash flow
- $5,127/yr
For passive investors: Depreciation is non-cash, so a rental often shows a tax loss while cash-flowing — sheltering income. Rental losses are passive: they offset passive income freely, and up to $25,000/yr can offset ordinary (W-2) income if you actively participate and your MAGI is under $100k (phasing out to $0 by $150k); unused losses carry forward. On sale, claimed depreciation is recaptured at up to 25%, and gains may owe capital-gains tax (a 1031 exchange can defer both). Figures are a year-1 estimate at your 24.0% rate — not tax advice; consult a CPA.
Schools (NCES district)
- District
- Fayette County
- NCES district ID
- 2101860
- Math proficiency
- 35% ▼ -16.00%
- Reading proficiency
- 45% ▼ -13.00%
- Median HH income
- $49,245
- Composite
- 34.38/100
- National rank
- #5211
- State rank
- #27 of 165 in KY
Livability — Lexington-Fayette
No livability data for this city. (Only ~50 U.S. cities are tracked.)
Census & demographics
- Census place
- Lexington-Fayette, KY
- County
- Fayette County · 317,143 people
- City population
- 321,882
- Metro
- Lexington-Fayette, KY
- Population (ZIP)
- 23,756
- Household income
- $29,440
- Rent vs Own
- Severe rent burden
- 2644.0
Population outlook (Fayette County) Hauer SSP2
- Today (2025)
- 363,454 people
- By 2030
- 388,270 · +6.8%
- By 2040
- 438,688 · +20.7%
- By 2050
- 490,667 · +35.0%
- By 2075
- 625,394 · +72.1%
- By 2100
- 721,354 · +98.5%
Race, ethnicity, and origin ACS 2023
- Neighborhood character
- Diverse neighborhood (Simpson 0.58)
- Race & ethnicity
- White 60% Black 22% Hispanic / Latino 9% Two or more races 7% Asian 3%
- Hispanic origin (detail)
- Mexican 5%
- Common ancestry
- Serbian 2% Italian 2% Lithuanian 2%
- Foreign-born
- 9% · Canada, China
- Languages at home
- 87% English-only · Spanish 8% Chinese 1% Other Indo-European 1%
Political lean MEDSL · Fayette
- 2024 margin
- D (+18.1) · D 58.0% · R 39.9% · Other 2.1%
- 2008→2024 swing
- +13.3pp toward D · 2008: 4.8pp · 2024: 18.1pp
- All cycles
- 2024: D+18.1 2020: D+20.8 2016: D+9.5 2012: D+1.0 2008: D+4.8
Not yet ingested
- Civics
- —
Market trends
- HPI YoY
- ▼ -251.04%
- Current HPI
- 204.3994
- Rent YoY
- ▲ 11.83%
- Metro
- Lexington-Fayette, KY
- State GDP YoY
- ▲ 1.81%
- F500 in state
- 4
Industry mix (Fortune 500 HQ in KY)
| Industry | F500 HQs | Revenue |
|---|---|---|
| Healthcare | 1 | $118B |
|
||
| Food / Beverage | 1 | $7B |
|
||
Price history
+99.1% since first listed13 events — show timeline
- 2026-02-13 Listed $109,500 ImagineMLS
- 2021-07-29 Sold (Public Records) $50,400 Public Records
- 2020-01-24 Sold (Public Records) $24,000 Public Records
- 2016-04-21 Sold (Public Records) $24,000 Public Records
- 2016-04-21 Sold (Public Records) $35,000 Public Records
- 2016-04-20 Sold (MLS) $24,000 ImagineMLS
- 2016-04-01 Pending — ImagineMLS
- 2016-03-02 Price Changed $33,000 ImagineMLS
- 2016-01-18 Listed $38,000 ImagineMLS
- 2010-02-18 Listing Removed — ImagineMLS
- 2009-08-22 Listed $55,000 ImagineMLS
- 2008-09-30 Listing Removed — ImagineMLS
- 2007-12-11 Listed $55,000 ImagineMLS
Property tax history
+1.8%/yrLatest (2015): $423 · +1.8% YoY. Source: county tax records.
Cash-flow waterfall
monthlySold comps — $/sqft
last 12 mo · ≤1 miLoading sold comps…