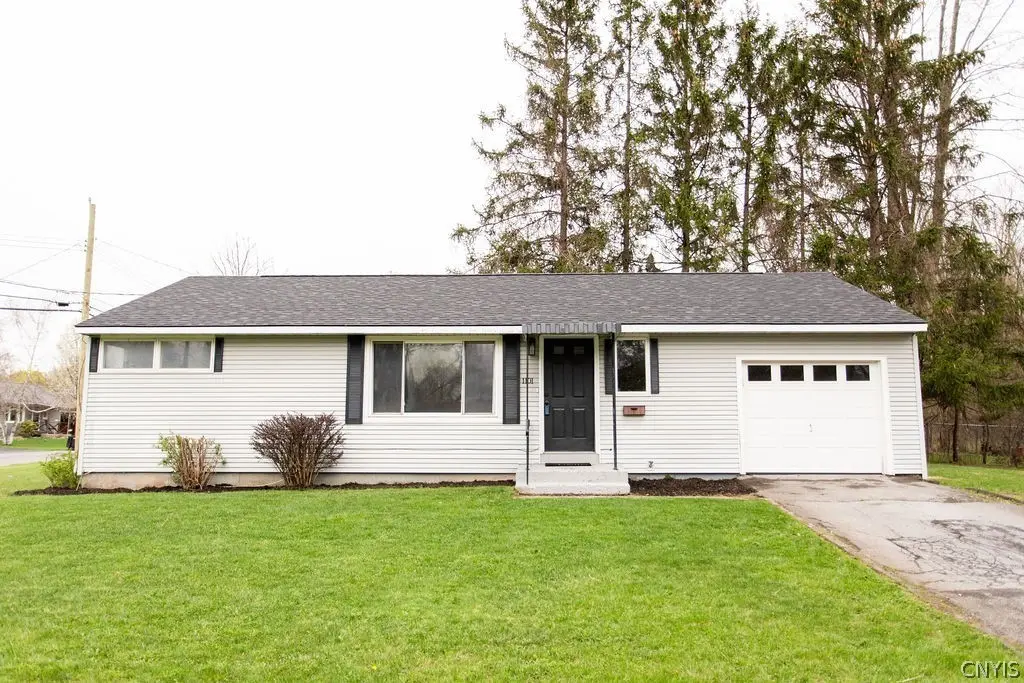
1101 Boulevard St · Mattydale, NY
Flood risk 1/10 · Minimal
- FEMA flood zone
- X (unshaded)
- Chance of flooding over 30 yrs
- 0.0%
- Est. flood insurance / yr
- $473 – $860
Fire risk 2/10 · Minimal
- Est. fire insurance / yr
- $691 – $1,283
Heat risk 3/10 · Minor
- Hot days now (above 95°F)
- 7 days/yr
- Hot days in 30 yrs
- 16 days/yr
Wind risk 1/10 · Minimal
- Chance of severe wind over 30 yrs
- 0.0%
Air-quality risk 2/10 · Minimal
- Unhealthy air days now
- 0 days/yr
- Unhealthy air days in 30 yrs
- 1 days/yr
Risk factors via First Street. Map © Google.
Why this score? — see what drove the D- grade
The composite is a weighted blend of 9 inputs, each scored 0–100. Each bar is that input's sub-score; the figure is the points it added to the 100-point composite (weight × sub-score).
- Appreciation +10.0/10.0
- Cash flow +8.1/30.0
- Schools +4.2/10.0
- Livability +3.6/5.0
- 1% rule +2.8/10.0
- Rent growth +2.5/5.0
- Condition / age +2.5/5.0
- DSCR +2.1/10.0
- ARV discount +0.0/15.0
$209,900
🖨 Deal sheet (PDF) 📄 Offer letter ✓ Due diligence
Listing remarks
Welcome to this beautifully restored 2 bed, 1 bath Ranch nestled on a generous sized corner lot with loads of improvements, including BRAND NEW ROOF, luxury vinyl tile flooring, wall-to-wall carpeting in bedrooms, butcher block countertops, brand new matching stainless steel appliances, and so much more! Bathroom has all new fixtures including new vanity, new tub and shower surround, and new LVT flooring. Single bay attached garage with garage door opener means no scraping windshields in winter! Electrical and plumbing services have been updated, as well as fresh interior paint throughout the home… just move in and enjoy from Day 1! Conveniently located just minutes from I-81 and the
Key facts
- 6,900 sq ft lot
- Garage
- Built 1955
Neighborhood map
What this means for you Summary
Snapshot
- This is a 2-bed/1.0-bath single-family listed at $210k.
Deal economics
- At list price, monthly cash flow is $-207 ($-2k/yr) — negative.
- To cash-flow at today's rent, offer at most $173k (17.4% below list).
- To meet the 1% rule (rent ≥ 1% of price), the offer needs to be $164k (21.8% below list).
- Recommended offer: $164k (21.8% below list) — sets the bar for 1% rule.
Location & tenants
- Location reads 72/100 on livability (#360 in NY) — a middle-class / working-renter tenant base. Strengths: cost of living A+, housing A+, health & safety A+; Watch: schools D, crime D, amenities F.
- North Syracuse Central School District (suburban): math 45% / reading 50% proficiency, ranked #402 of 590 in NY (top 68%) — families likely to look elsewhere, expect single-tenant / working-renter base with shorter leases.
- Market conditions: 20 active listings in the ZIP; 2 comparable units currently listed for rent nearby; 616 units permitted in Onondaga County in 2024 (256 in 5+ unit buildings).
Forward outlook
- In year one you build about $22k of equity ($1k loan paydown + $21k appreciation (10.0% local appreciation)).
- Onondaga County population projected to shrink 9% by 2050 — rents likely to lag national; underwrite the cash flow, not the appreciation.
- By year 2, paydown + projected appreciation supports a ~$36k cash-out refi (75% LTV) — recoverable capital for the next deal without selling this one.
Negotiation context
- Only 11 days on market — expect competitive offers; lowballing is unlikely to land.
- 2 sale attempts with the ask held roughly flat each time — persistent listings suggest the price (not the market) is what's stuck; bring a comps-based counter.
- Current owner paid $83k; list at $210k implies a 153% gain — meaningful room to come down on a strong offer.
Risks & watch-outs
- Watch-outs: built in 1955 — expect roof / HVAC / electrical / plumbing capex.
Questions for the listing agent
- What do current leases actually rent for vs. the listed asking? Can we see a recent rent roll and the last 12 months of T-12 income?
- Built in 1955 — when were the roof, HVAC, electrical panel, plumbing, and water heater last replaced?
- Is there a deadline driving the sale (1031 exchange, divorce, estate, relocation)? That informs how much negotiation room exists.
- Schools are D-rated, which usually means shorter tenancies and higher turnover. Who's the typical renter profile here, and what's been the actual vacancy rate?
- Crime grade is D in this area — have there been break-ins, vandalism, or insurance claims at this property in the last 3 years? What carrier currently insures it and at what premium?
- The area grade is low — what's the realistic commute time and amenity access for the typical tenant pool here? Any planned neighborhood developments (good or bad) we should know about?
- What's the average days-on-market for RENTAL listings here right now (not sales)? A rising rental-DOM trend means longer vacancies and softer asking-rent achievability than the comps imply.
- What's the recent tenant-quality profile in this submarket — average credit score on applications, eviction rate, late-payment / NSF rate, and stable-employment percentage? A property-management company in the area should have these aggregated.
- How much new for-sale + rental construction is in the pipeline within 1–3 miles? Heavy new supply typically softens prices + rents 12–24 months out; constrained supply supports both.
Investment metrics
- 1% rule
- 0.78% ✗
- Cap rate
- 5.11%
- Cash-on-cash
- -4.22%
- DSCR
- 0.81
- GRM
- 10.7
CMA / ARV
- ARV (on-the-fly)
- $178,568
- Comps found
- 12
Show comp detail 12 sales within ~0.75 mi
| Address | Dist | Beds/Ba | Sqft | Sold | Price | $/sf | Match |
|---|---|---|---|---|---|---|---|
| 193 Medford Rd | 0.22mi | 2/1.0 | 936 (+6%) | 5mo | $175,000 | $187 | 76 |
| 117 Marian Dr | 0.08mi | 3/1.0 (+1) | 936 (+6%) | 8mo | $230,000 | $246 | 75 |
| 140 Chester Dr | 0.43mi | 2/1.0 | 864 (-2%) | 5mo | $166,000 | $192 | 72 |
| 119 Florida Rd S | 0.10mi | 3/1.5 (+1) | 936 (+6%) | 10mo | $185,000 | $198 | 70 |
| 718 Matty Ave | 0.36mi | 2/1.0 | 952 (+8%) | 2mo | $210,000 | $221 | 69 |
| 112 1/2 Medford Rd | 0.26mi | 3/1.0 (+1) | 936 (+6%) | 9mo | $150,000 | $160 | 66 |
| 103 Chester Dr | 0.45mi | 2/1.5 | 792 (-10%) | 3mo | $159,900 | $202 | 57 |
| 201 Beley Ave | 0.63mi | 2/1.0 | 814 (-8%) | 7mo | $144,500 | $178 | 52 |
| 367 Matty Ave | 0.38mi | 3/1.5 (+1) | 1,013 (+15%) | 5mo | $249,200 | $246 | 47 |
| 108 Earl Ave | 0.72mi | 2/1.0 | 961 (+9%) | 7mo | $171,900 | $179 | 46 |
| 212 Florida Rd N | 0.38mi | 3/1.5 (+1) | 1,014 (+15%) | 10mo | $210,000 | $207 | 43 |
| 119 Earl Ave | 0.71mi | 2/1.0 | 768 (-13%) | 9mo | $189,900 | $247 | 37 |
Match score weights: distance 35% · size 25% · config 20% · recency 20%. Top-matched comps best support the ARV.
Projected returns pro-forma
10.0% appreciation · 3.0% rent growth · sell at horizon
- IRR
- 21.3%
- Equity multiple
- 2.72×
- Total profit
- $101,209
- Equity at exit
- $189,095
- IRR
- 19.3%
- Equity multiple
- 6.25×
- Total profit
- $308,510
- Equity at exit
- $407,790
Cash invested: $58,772 (down + closing). Projections, not guarantees.
Landlord ↔ Tenant lean methodology
- Overall (STATE)
- 15 Strongly Tenant-Friendly
- State New York
- 15 Strongly Tenant-Friendly · D+10
- County
- — inherits STATE
- City
- — inherits STATE
ZIP-level market 13211
- Home prices YoY
- 10.7%
- Active inventory
- 20
- Price-to-rent
- 10.7×
Monthly cashflow live
- Estimated rent
- $1,641 medium interval (Pro) →
- Mortgage (P&I)
- −$1,101
- Tax from tax record
- −$315 /mo · $3,778/yr
- Insurance
- −$87
- HOA
- −$0
- Vacancy / Maint / Mgmt
- −$345
- Net cashflow
- $-207
Break-even live
Sensitivity live
| Price | -10% $-88 | -5% $-147 | +0% $-207 | +5% $-266 | +10% $-326 |
|---|---|---|---|---|---|
| Rent | -10% $-336 | -5% $-272 | +0% $-207 | +5% $-142 | +10% $-77 |
| Rate | -1.0pp $-101 | -0.5pp $-153 | base $-207 | +0.5pp $-261 | +1.0pp $-316 |
UW: 25.0% down · 7.5% · 30yr · 1.5% tax · 5.0% vac · 8.0% maint · 8.0% mgmt
Financing live
Cash to close
- Down payment
- $52,475
- Closing costs
- $6,297
- Reserves months
- —
- Total cash needed
- —
Loan-product check · same deal, 3 products live
Conventional
25% down · 7.5% · 30yr
- Down + closing
- —
- Monthly P&I
- —
- Monthly cashflow
- —
- DSCR
- —
- Eligible?
- —
Personal DTI + credit; lowest rate.
DSCR
20% down · 8.5% · 30yr
- Down + closing
- —
- Monthly P&I
- —
- Monthly cashflow
- —
- DSCR
- —
- Eligible?
- —
No personal income docs; deal must DSCR.
Hard money
10% down · 12.0% · 12mo
- Down + closing
- —
- Monthly P&I
- —
- Monthly cashflow
- —
- DSCR
- —
- Eligible?
- —
Short-term bridge; refi at stabilization.
Rent comps 2 comps
| Address | Beds | Baths | Sqft | Rent | $/sqft | DOM | Units | Dist |
|---|---|---|---|---|---|---|---|---|
| 2802 Lemoyne Ave Unit 1 Syracuse, NY | 3.0 | 1.0 | 988 | $1,700 | $1.72 | 15d | 1 | 0.67mi |
| 286 Ross Park Syracuse, NY | 3.0 | 1.0 | 1100 | $1,500 | $1.36 | 46d | 1 | 1.43mi |
Listing history 8 events
-
2026-04-28status Pending
-
2026-04-20historical Active Under Contract
-
2026-04-17$209,900 Active
-
2026-02-11soldstatus $83,000
-
2026-01-30status Pending
-
2026-01-26historical Active Under Contract
-
2026-01-25historical
-
2026-01-22$199,900 Active
ⓘ Source: listings_history table (triggers on properties + properties_extension) + one-shot
backfill from property_details.listing_events for pre-trigger history.
Tax reassessment forecast NY · Partial reset (capped growth)
- Current annual tax
- $3,778 · $315/mo
- Projected year-2 tax
- $3,778 · $315/mo
- Expected delta
- $0/yr ($0/mo · 0.0%)
ⓘ Screening estimate from a state-policy table — verify with the county assessor before closing.
Climate risk First Street
- Flood 1/10 Low FEMA zone X (unshaded) · 0% chance over 30 yrs
- Wildfire 2/10 Low
- Heat 3/10 Moderate 7 d/yr ≥95°F today · 16 d/yr by 30 yrs out
- Wind 1/10 Low 0% chance of damaging wind over 30 yrs
- Air quality 2/10 Low 0 unhealthy d/yr today · 1 by 30 yrs out
Nearby sold comps map
Loading sold comps map…
Walkable amenities ~0.75 mi
Loading nearby amenities…
Taxation est. · year 1
- Rental income
- $19,691
- − Mortgage interest
- −$11,758
- − Property taxes
- −$3,778
- − Insurance
- −$1,050
- − Repairs & maintenance
- −$1,575
- − Management
- −$1,575
- − Depreciation
- −$6,106
- Taxable loss
- −$6,151
- Est. tax savings @ 24.0%
- +$1,476
- After-tax cash flow
- $-1,004/yr
For passive investors: Depreciation is non-cash, so a rental often shows a tax loss while cash-flowing — sheltering income. Rental losses are passive: they offset passive income freely, and up to $25,000/yr can offset ordinary (W-2) income if you actively participate and your MAGI is under $100k (phasing out to $0 by $150k); unused losses carry forward. On sale, claimed depreciation is recaptured at up to 25%, and gains may owe capital-gains tax (a 1031 exchange can defer both). Figures are a year-1 estimate at your 24.0% rate — not tax advice; consult a CPA.
Schools (NCES district)
- District
- North Syracuse Central School District
- NCES district ID
- 3621210
- Math proficiency
- 45% ▼ -9.00%
- Reading proficiency
- 50% ▲ 1.00%
- Median HH income
- $62,904
- Composite
- 41.93/100
- National rank
- #3356
- State rank
- #402 of 590 in NY
Livability — Mattydale
- Score
- 72/100
- State rank
- #360
- US rank
- #6130
Category grades
Schools grade is shown separately in the Schools card above.
Census & demographics
- Census place
- Mattydale, NY
- City population
- 6,155
- Population (ZIP)
- 6,155
Population outlook (Onondaga County) Hauer SSP2
- Today (2025)
- 467,894 people
- By 2030
- 463,381 · -1.0%
- By 2040
- 447,697 · -4.3%
- By 2050
- 426,399 · -8.9%
- By 2075
- 373,661 · -20.1%
- By 2100
- 307,967 · -34.2%
Race, ethnicity, and origin ACS 2023
- Neighborhood character
- Predominantly White (78%)
- Race & ethnicity
- White 78% Two or more races 7% Asian 5% Hispanic / Latino 5% Black 4%
- Common ancestry
- Romanian 7% Lithuanian 5% Iranian 2%
- Foreign-born
- 5% · Philippines, India, Vietnam
- Languages at home
- 93% English-only · Other Indo-European 2% Other Asian/Pacific 2% Russian/Polish/Slavic 1%
Political lean MEDSL · Onondaga
- 2024 margin
- D (+17.3) · D 58.6% · R 41.4%
- 2008→2024 swing
- -3.0pp toward R · 2008: 20.3pp · 2024: 17.3pp
- All cycles
- 2024: D+17.3 2020: D+20.6 2016: D+12.8 2012: D+21.1 2008: D+20.3
Not yet ingested
- Civics
- —
Market trends
- HPI YoY
- ▲ 31.87%
- Current HPI
- 330.266
- Rent YoY
- —
- Metro
- —
- State GDP YoY
- ▲ 2.60%
- F500 in state
- 92
Industry mix (Fortune 500 HQ in NY)
| Industry | F500 HQs | Revenue |
|---|---|---|
| Financial Services | 10 | $950B |
|
||
| Consumer Goods | 9 | $162B |
|
||
| Insurance | 4 | $225B |
|
||
| Telecommunications | 2 | $144B |
|
||
| Pharmaceuticals | 2 | $112B |
|
||
| Media / Entertainment | 2 | $69B |
|
||
Price history
+5.0% since first listed8 events — show timeline
- 2026-04-28 Pending — CNYIS
- 2026-04-20 Contingent — CNYIS
- 2026-04-17 Listed $209,900 CNYIS
- 2026-02-11 Sold (Public Records) $83,000 Public Records
- 2026-01-30 Pending — CNYIS
- 2026-01-26 Contingent — CNYIS
- 2026-01-25 Listing Removed — CNYIS
- 2026-01-22 Listed $199,900 CNYIS
Property tax history
+2.6%/yrLatest (2025): $3,778 · -0.8% YoY. Source: county tax records.
Cash-flow waterfall
monthlySold comps — $/sqft
last 12 mo · ≤1 miLoading sold comps…