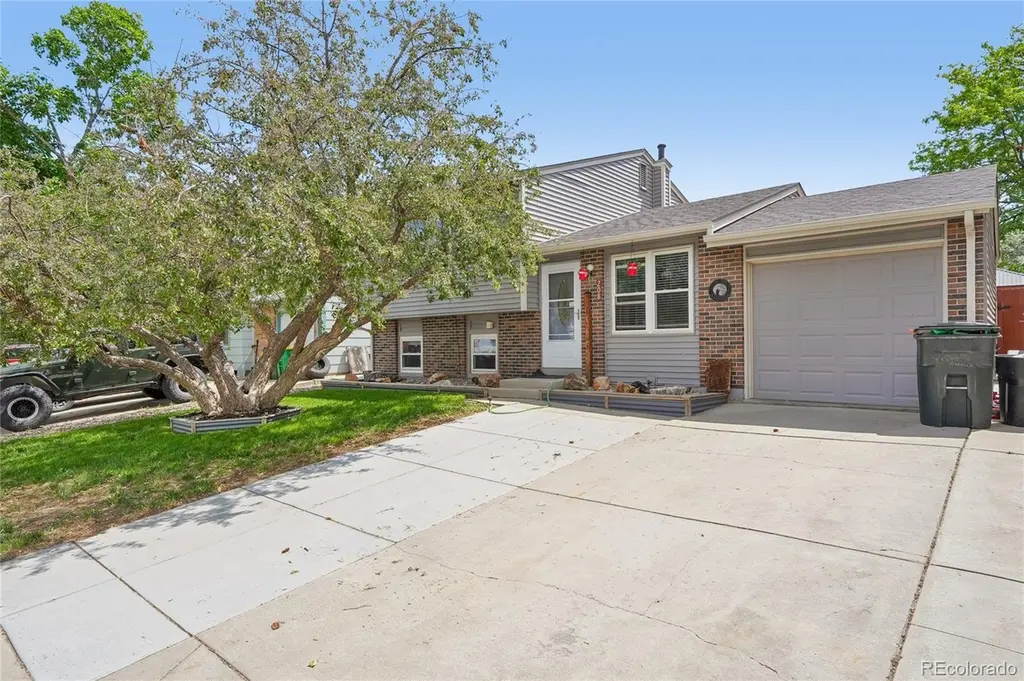
208 Madison Dr · Bennett, CO
Flood risk 1/10 · Minimal
- FEMA flood zone
- X (unshaded)
- Chance of flooding over 30 yrs
- 0.0%
- Est. flood insurance / yr
- $507 – $1,088
Fire risk 5/10 · Moderate
- Est. fire insurance / yr
- $939 – $1,743
Heat risk 3/10 · Minor
- Hot days now (above 92°F)
- 6 days/yr
- Hot days in 30 yrs
- 15 days/yr
Wind risk 2/10 · Minimal
- Chance of severe wind over 30 yrs
- —
Air-quality risk 2/10 · Minimal
- Unhealthy air days now
- 1 days/yr
- Unhealthy air days in 30 yrs
- 2 days/yr
Risk factors via First Street. Map © Google.
Why this score? — see what drove the C- grade
The composite is a weighted blend of 9 inputs, each scored 0–100. Each bar is that input's sub-score; the figure is the points it added to the 100-point composite (weight × sub-score).
- Cash flow +14.3/30.0
- Appreciation +10.0/10.0
- ARV discount +9.2/15.0
- DSCR +4.4/10.0
- 1% rule +3.0/10.0
- Livability +3.0/5.0
- Rent growth +2.5/5.0
- Condition / age +2.5/5.0
- Schools +2.1/10.0
$375,000
🖨 Deal sheet 📄 Offer letter ✓ Due diligence
Listing remarks MLS
**$10,000 SELLER CREDIT*** Welcome to this beautifully updated 3-bedroom, 2-bath tri-level home located in the desirable Centennial Subdivision of Bennett. NO HOA! The main level features an open-concept kitchen and dining area with vaulted ceilings, ample cabinet space, and a breakfast bar that overlooks the dining space, allowing for convenient everyday living. The lower level includes a comfortable living room highlighted by a wood accent feature wall, along with a laundry area, a 3/4 bath, and a flex room suitable for a variety of uses such as an office, workout space, or hobby room. The upper level hosts three sizable bedrooms and a full bathroom, including a primary bedroom with dual closets for added storage. Step outside to enjoy the expansive, fully fenced backyard, complete with a large patio and gazebo-ideal for gatherings-plus plenty of open space for recreation. Two large storage sheds and attached garage provide extra room for tools and equipment, making this property as functional as it is inviting. Conveniently located near grocery stores, restaurants, and shopping, with access for commuting to the surrounding metro area. Don't miss out on this great opportunity.
Key facts
- Open concept kitchen
- Gazebo
- Large patio
Tags
Property features AI
Exterior
- Parking: Attached 1-car garage (1 total parking space)
- Security: Carbon monoxide detector(s); Smoke detector(s)
- Utilities: Public water; Public sewer; Electricity connected; Natural gas connected; Phone available; Paved, public-maintained road access
- Home design: Single-family residence; Tri-level layout; Updated/remodeled condition; West-facing; Unattached property
- Construction: Frame construction; Composition roof; Concrete perimeter foundation and slab; Built as a house
- Exterior features: Private yard; Fire pit; Covered patio; Full fencing
Interior
- Kitchen: Dishwasher; Oven; Refrigerator; Eat-in kitchen layout
- Bedrooms: Three bedrooms (all on the upper level) including a primary suite
- Flooring: Carpet; Laminate; Tile
- Bathrooms: Two bathrooms — one full (upper) and one three-quarter (lower)
- Heating & cooling: Forced air heating
- Interior features: Ceiling fans; Eat-in kitchen; Open floor plan; Vaulted ceilings; Double pane windows; Carbon monoxide and smoke detectors
- Laundry & utility: In-unit laundry
Neighborhood map
What this means for you Summary
Snapshot
- This is a 4-bed/2.0-bath single-family listed at $375k.
Deal economics
- At list price, monthly cash flow is $70 ($837/yr) — positive.
- The deal already cash-flows at list — no discount required.
- To meet the 1% rule (rent ≥ 1% of price), the offer needs to be $300k (20.0% below list).
- Recommended offer: $300k (20.0% below list) — sets the bar for 1% rule.
- Cap rate 6.5% vs local median 4.7% in Bennett — top-decile yield for the area; either an underpriced asset or a hidden risk that comps aren't pricing in. Stress-test before assuming the spread holds.
Location & tenants
- Location reads 59/100 on livability (#263 in CO) — a working-class tenant base; expect higher turnover. Strengths: housing A+, crime A-; Watch: cost of living D+, amenities F, commute F.
- Bennett School District No. 29J (rural): math 13% / reading 31% proficiency, ranked #69 of 86 in CO (top 80%) — low school quality limits family demand, transient renter base, plan for 1-2y turnover.
- Zoned schools: Bennett Preschool (71 students, 11% FRL); Bennett Middle School (math 8% / reading 42%, grade F, #168 of 270 statewide, top 63%, 304 students, 38% FRL); Bennett High School (math 22% / reading 47%, grade F, #209 of 381 statewide, top 56%, 427 students, 25% FRL) — zoned schools at 25% FRL track the district average.
- Market conditions: 212 active listings in the ZIP; 1 comparable units currently listed for rent nearby; 2,299 units permitted in Adams County in 2024 (343 in 5+ unit buildings).
Forward outlook
- In year one you build about $40k of equity ($3k loan paydown + $38k appreciation (10.0% local appreciation)).
- Adams County population projected at +44% by 2050 — long-run rental-demand tailwind backs the buy-and-hold thesis.
- At projected returns (10.0% appreciation + 3.0% rent growth), your $105k cash investment doubles in ~3 years — after that, you're playing with house money.
- By year 2, paydown + projected appreciation supports a ~$64k cash-out refi (75% LTV) — recoverable capital for the next deal without selling this one.
Negotiation context
- Only 7 days on market — expect competitive offers; lowballing is unlikely to land.
- 9 sale attempts since 10y ago with the ask held roughly flat each time — persistent listings suggest the price (not the market) is what's stuck; bring a comps-based counter.
Risks & watch-outs
- Climate carrying-cost: moderate wildfire risk — expect insurance premiums to compound above CPI over the hold.
Questions for the listing agent
- Is there a deadline driving the sale (1031 exchange, divorce, estate, relocation)? That informs how much negotiation room exists.
- Schools are F-rated, which usually means shorter tenancies and higher turnover. Who's the typical renter profile here, and what's been the actual vacancy rate?
- What's the average days-on-market for RENTAL listings here right now (not sales)? A rising rental-DOM trend means longer vacancies and softer asking-rent achievability than the comps imply.
- What's the recent tenant-quality profile in this submarket — average credit score on applications, eviction rate, late-payment / NSF rate, and stable-employment percentage? A property-management company in the area should have these aggregated.
- How much new for-sale + rental construction is in the pipeline within 1–3 miles? Heavy new supply typically softens prices + rents 12–24 months out; constrained supply supports both.
Investment metrics
- 1% rule
- 0.80% ✗
- Cap rate
- 6.52%
- Cash-on-cash
- 0.80%
- DSCR
- 1.04
- GRM
- 10.4
CMA / ARV
- ARV (on-the-fly)
- $389,400
- Comps found
- 12
Show comp detail 12 sales within ~0.75 mi
| Address | Dist | Beds/Ba | Sqft | Sold | Price | $/sf | Match |
|---|---|---|---|---|---|---|---|
| 220 Mckinley Dr | 0.05mi | 4/2.0 | 1,482 (+5%) | 2mo | $325,000 | $219 | 88 |
| 845 Madison Way | 0.11mi | 3/2.0 (-1) | 1,380 (-2%) | 4mo | $378,900 | $275 | 82 |
| 215 Mckinley Dr | 0.08mi | 3/2.0 (-1) | 1,210 (-14%) | 1mo | $355,000 | $293 | 66 |
| 46541 Sunflower Ln | 0.43mi | 3/3.0 (-1) | 1,436 (+1%) | 6mo | $370,000 | $258 | 64 |
| 46577 Sunflower Ln | 0.41mi | 3/3.0 (-1) | 1,464 (+3%) | 3mo | $389,999 | $266 | 64 |
| 46585 Sunflower Ln | 0.42mi | 3/3.0 (-1) | 1,464 (+3%) | 4mo | $383,490 | $262 | 62 |
| 704 Madison Way | 0.16mi | 3/2.0 (-1) | 1,210 (-14%) | 4mo | $410,000 | $339 | 60 |
| 46514 Avery Ln | 0.52mi | 3/3.0 (-1) | 1,311 (-7%) | 1mo | $370,000 | $282 | 54 |
| 47349 Lily Ave | 0.62mi | 3/2.0 (-1) | 1,490 (+5%) | 4mo | $415,000 | $279 | 54 |
| 46534 Avery Ln | 0.52mi | 3/3.0 (-1) | 1,311 (-7%) | 3mo | $359,990 | $275 | 51 |
| 47385 Lily Ave | 0.70mi | 3/2.0 (-1) | 1,490 (+5%) | 4mo | $397,500 | $267 | 50 |
| 46550 Avery Ln | 0.51mi | 3/3.0 (-1) | 1,311 (-7%) | 6mo | $424,999 | $324 | 50 |
Match score weights: distance 35% · size 25% · config 20% · recency 20%. Top-matched comps best support the ARV.
Projected returns pro-forma
10.0% appreciation · 3.0% rent growth · sell at horizon
- IRR
- 24.8%
- Equity multiple
- 2.99×
- Total profit
- $208,543
- Equity at exit
- $337,830
- IRR
- 21.9%
- Equity multiple
- 6.81×
- Total profit
- $610,367
- Equity at exit
- $728,543
Cash invested: $105,000 (down + closing). Projections, not guarantees.
Landlord ↔ Tenant lean methodology
- Overall (STATE)
- 38 Tenant-Leaning
- State Colorado
- 38 Tenant-Leaning · D+4
- County
- — inherits STATE
- City
- — inherits STATE
ZIP-level market 80102
- Home prices YoY
- 3.1%
- Active inventory
- 212
- Price-to-rent
- 10.4×
Monthly cashflow live
- Estimated rent
- $3,000 medium interval (Pro) →
- Mortgage (P&I)
- −$1,967
- Tax from tax record
- −$177 /mo · $2,130/yr
- Insurance
- −$156
- HOA
- −$0
- Vacancy / Maint / Mgmt
- −$630
- Net cashflow
- $70
Break-even live
UW: 25.0% down · 7.5% · 30yr · 1.5% tax · 5.0% vac · 8.0% maint · 8.0% mgmt
Financing live
Cash to close
- Down payment
- $93,750
- Closing costs
- $11,250
- Reserves months
- —
- Total cash needed
- —
Loan-product check · same deal, 3 products live
Conventional
25% down · 7.5% · 30yr
- Down + closing
- —
- Monthly P&I
- —
- Monthly cashflow
- —
- DSCR
- —
- Eligible?
- —
Personal DTI + credit; lowest rate.
DSCR
20% down · 8.5% · 30yr
- Down + closing
- —
- Monthly P&I
- —
- Monthly cashflow
- —
- DSCR
- —
- Eligible?
- —
No personal income docs; deal must DSCR.
Hard money
10% down · 12.0% · 12mo
- Down + closing
- —
- Monthly P&I
- —
- Monthly cashflow
- —
- DSCR
- —
- Eligible?
- —
Short-term bridge; refi at stabilization.
Rent comps 1 comps
| Address | Beds | Baths | Sqft | Rent | $/sqft | DOM | Units | Dist |
|---|---|---|---|---|---|---|---|---|
| 239 Adams St Bennett, CO | 3.0 | 2.5 | 1653 | $3,000 | $1.81 | 24d | 1 | 0.71mi |
Listing history 7 events
-
2026-06-18days on market $375,000 Active 7 DOM
-
2026-06-17days on market $375,000 Active 6 DOM
-
2026-06-16days on market $375,000 Active 5 DOM
-
2026-06-15days on market $375,000 Active 4 DOM
-
2026-06-13days on market $375,000 Active 2 DOM
-
2026-06-13remarks 699-char remark
-
2026-06-13$375,000 Active 1 DOM
ⓘ Source: listings_history table (triggers on properties + properties_extension) + one-shot
backfill from property_details.listing_events for pre-trigger history.
Tax reassessment forecast CO · Resets to sale price
- Current annual tax
- $2,130 · $177/mo
- Projected year-2 tax
- $2,130 · $177/mo
- Expected delta
- $0/yr ($0/mo · 0.0%)
ⓘ Screening estimate from a state-policy table — verify with the county assessor before closing.
Climate risk First Street
- Flood 1/10 Low FEMA zone X (unshaded) · 0% chance over 30 yrs
- Wildfire 5/10 Major
- Heat 3/10 Moderate 6 d/yr ≥92°F today · 15 d/yr by 30 yrs out
- Wind 2/10 Low
- Air quality 2/10 Low 1 unhealthy d/yr today · 2 by 30 yrs out
Nearby sold comps map
Loading sold comps map…
Walkable amenities ~0.75 mi
Loading nearby amenities…
Taxation est. · year 1
- Rental income
- $36,000
- − Mortgage interest
- −$21,006
- − Property taxes
- −$2,130
- − Insurance
- −$1,875
- − Repairs & maintenance
- −$2,880
- − Management
- −$2,880
- − Depreciation
- −$10,909
- Taxable loss
- −$5,679
- Est. tax savings @ 24.0%
- +$1,363
- After-tax cash flow
- $2,200/yr
For passive investors: Depreciation is non-cash, so a rental often shows a tax loss while cash-flowing — sheltering income. Rental losses are passive: they offset passive income freely, and up to $25,000/yr can offset ordinary (W-2) income if you actively participate and your MAGI is under $100k (phasing out to $0 by $150k); unused losses carry forward. On sale, claimed depreciation is recaptured at up to 25%, and gains may owe capital-gains tax (a 1031 exchange can defer both). Figures are a year-1 estimate at your 24.0% rate — not tax advice; consult a CPA.
Schools (NCES district)
- District
- Bennett School District No. 29J
- NCES district ID
- 0802430
- Math proficiency
- 13% ▼ -10.00%
- Reading proficiency
- 31% ▼ -9.00%
- Median HH income
- $69,795
- Composite
- 21.39/100
- National rank
- #8353
- State rank
- #69 of 86 in CO
Livability — Bennett
- Score
- 59/100
- State rank
- #263
- US rank
- #19691
Category grades
Schools grade is shown separately in the Schools card above.
Census & demographics
- Census place
- Bennett, CO
- City population
- 5,994
- Population (ZIP)
- 5,994
Population outlook (Adams County) Hauer SSP2
- Today (2025)
- 598,184 people
- By 2030
- 651,880 · +9.0%
- By 2040
- 759,778 · +27.0%
- By 2050
- 862,889 · +44.3%
- By 2075
- 1,085,994 · +81.5%
- By 2100
- 1,211,318 · +102.5%
Race, ethnicity, and origin ACS 2023
- Neighborhood character
- Predominantly White (72%)
- Race & ethnicity
- White 72% Hispanic / Latino 21% Two or more races 11% Black 2%
- Hispanic origin (detail)
- Mexican 17% Puerto Rican 1%
- Common ancestry
- Serbian 4% Italian 3% Lithuanian 2%
- Foreign-born
- 6% · Canada, China
- Languages at home
- 87% English-only · Spanish 10% German/W. Germanic 1% Chinese 1%
Political lean MEDSL · Adams
- 2024 margin
- Lean D (+9.0) · D 53.2% · R 44.1% · Other 2.7%
- 2008→2024 swing
- -9.3pp toward R · 2008: 18.4pp · 2024: 9.0pp
- All cycles
- 2024: D+9.0 2020: D+16.3 2016: D+7.2 2012: D+15.1 2008: D+18.4
Not yet ingested
- Civics
- —
Market trends
- HPI YoY
- ▲ 14.94%
- Current HPI
- 494.39
- Rent YoY
- —
- Metro
- —
- State GDP YoY
- ▲ 1.95%
- F500 in state
- 14
Industry mix (Fortune 500 HQ in CO)
| Industry | F500 HQs | Revenue |
|---|---|---|
| Technology Distribution | 1 | $31B |
|
||
| Food / Agriculture | 1 | $18B |
|
||
| Packaging | 1 | $14B |
|
||
| Healthcare | 1 | $13B |
|
||
| Energy | 1 | $10B |
|
||
| Technology | 1 | $4B |
|
||
Price history
+504.8% since first listed27 events — show timeline
- 2026-06-11 Listed $375,000 IRES
- 2026-06-11 Listed $375,000 REColorado as Distributed by MLS Grid
- 2023-12-29 Sold (Public Records) $400,000 Public Records
- 2023-12-29 Sold (MLS) $400,000 REColorado as Distributed by MLS Grid
- 2023-12-29 Sold (MLS) $400,000 IRES
- 2023-11-15 Pending — IRES
- 2023-11-15 Pending — REColorado as Distributed by MLS Grid
- 2023-10-24 Price Changed $415,000 REColorado as Distributed by MLS Grid
- 2023-10-24 Price Changed $415,000 IRES
- 2023-10-16 Relisted — REColorado as Distributed by MLS Grid
- 2023-10-16 Relisted — IRES
- 2023-09-20 Pending — REColorado as Distributed by MLS Grid
- 2023-09-20 Pending — IRES
- 2023-08-21 Relisted — REColorado as Distributed by MLS Grid
- 2023-08-21 Relisted — IRES
- 2023-08-03 Listing Removed — REColorado as Distributed by MLS Grid
- 2023-08-03 Listing Removed — IRES
- 2023-07-26 Listed $425,000 REColorado as Distributed by MLS Grid
- 2023-07-26 Listed $425,000 IRES
- 2016-08-22 Sold (Public Records) $243,500 Public Records
- 2016-08-19 Sold (MLS) $243,500 REColorado as Distributed by MLS Grid
- 2016-07-09 Pending — REColorado as Distributed by MLS Grid
- 2016-07-04 Listed $243,500 REColorado as Distributed by MLS Grid
- 2000-09-21 Sold (Public Records) $147,950 Public Records
- 1994-08-02 Sold (Public Records) $81,500 Public Records
- 1985-05-06 Sold (Public Records) $62,000 Public Records
- 1985-05-06 Sold (Public Records) $62,000 Public Records
Property tax history
+4.6%/yrLatest (2025): $2,130 · +7.3% YoY. Source: county tax records.
Cash-flow waterfall
monthlySold comps — $/sqft
last 12 mo · ≤1 miLoading sold comps…