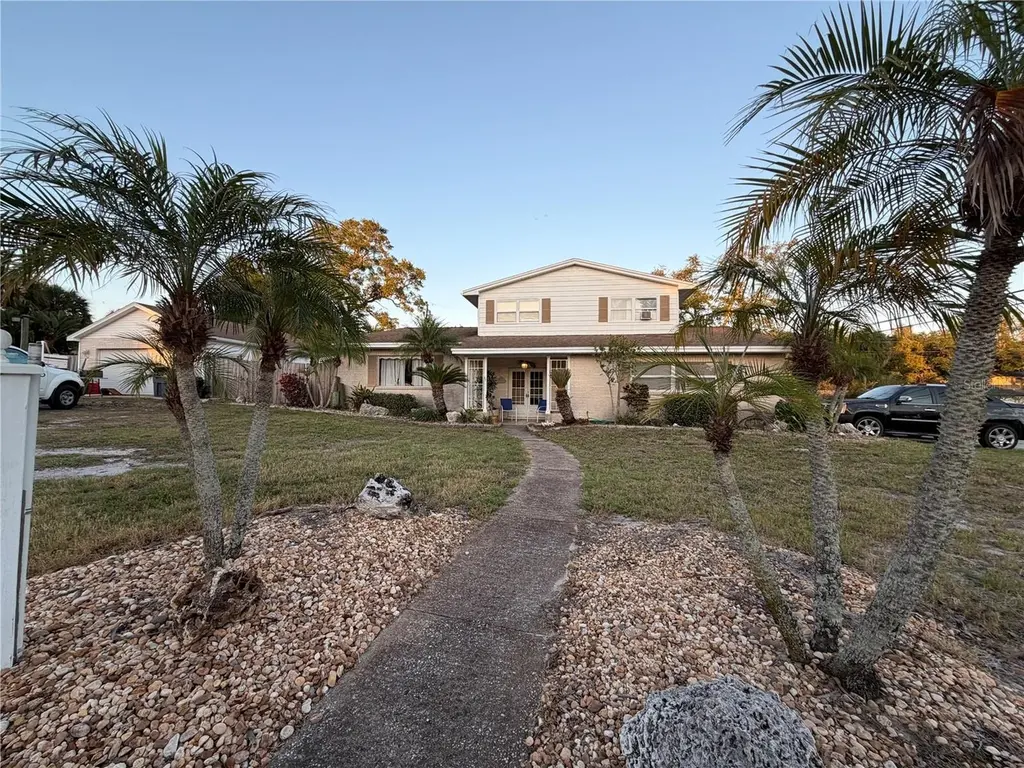
8209 134th St · Seminole, FL
Flood risk 1/10 · Minimal
- FEMA flood zone
- X (unshaded)
- Chance of flooding over 30 yrs
- 0.0%
- Est. flood insurance / yr
- $507 – $1,088
Fire risk 1/10 · Minimal
- Est. fire insurance / yr
- $947 – $1,759
Heat risk 10/10 · Severe
- Hot days now (above 107°F)
- 8 days/yr
- Hot days in 30 yrs
- 28 days/yr
Wind risk 10/10 · Severe
- Chance of severe wind over 30 yrs
- 99.0%
Air-quality risk 3/10 · Minor
- Unhealthy air days now
- 2 days/yr
- Unhealthy air days in 30 yrs
- 2 days/yr
Risk factors via First Street. Map © Google.
Why this score? — see what drove the B- grade
The composite is a weighted blend of 9 inputs, each scored 0–100. Each bar is that input's sub-score; the figure is the points it added to the 100-point composite (weight × sub-score).
- Cash flow +25.3/30.0
- ARV discount +15.0/15.0
- DSCR +8.3/10.0
- 1% rule +5.6/10.0
- Livability +4.4/5.0
- Schools +4.3/10.0
- Rent growth +2.5/5.0
- Condition / age +2.5/5.0
- Appreciation +0.0/10.0
$659,000
🖨 Deal sheet (PDF) 📄 Offer letter ✓ Due diligence
Listing remarks
INVESTORS. .. REDUCED for quick sale. .. .. This seminole home is on 0.30 acre corner lot property; it has 4bedrooms and 3bath and oversized 2car garage with pool and has in law suite. It is in high grounds and No Flood zone, No HOA, No CDD. This property located minutes to Redington beach and many fine restaurants and entertainment. Seller is taking offers till Friday 6/5 12noon.
Key facts
- In law suite
- No flood zone
- Corner lot
Tags
Property features AI
Finance
- Other: Corner lot, in county and unincorporated; Concrete road surface; Total acreage approximately 0.3 (1/4 to less than 1/2 acre); Living area ~2,733 sq ft (per public records); total building area ~3,501 sq ft; Interior in-law suite with private entry; Unfurnished
- HOA & community: No association
Exterior
- Parking: Driveway (oversized); 2-car garage
- Utilities: Public water; Private sewer; Sewer connected; Water connected; Electricity connected; Cable connected; Sprinkler well
- Home design: Single family residence; Residential property; Two levels; Faces east; Fixer condition; Homestead exempt
- Construction: Block, concrete and stucco construction; Shingle roof; Slab foundation; Built with mature landscaping
- Exterior features: Exterior lighting; Wood fencing; In-ground spa; Private pool (gunite)
Interior
- Kitchen: Dishwasher; Range; Refrigerator; Electric water heater
- Bedrooms: 4 bedrooms
- Flooring: Carpet; Ceramic tile
- Bathrooms: 3 full bathrooms
- Heating & cooling: Central heating; Central air conditioning
- Interior features: Ceiling fans; High ceilings; Wood-burning fireplace
- Laundry & utility: Washer hookup; Electric dryer hookup
Neighborhood map
What this means for you Summary
Snapshot
- This is a 4-bed/3.0-bath single-family listed at $659k.
Deal economics
- At list price, monthly cash flow is $2k ($18k/yr) — positive.
- The deal already cash-flows at list — no discount required.
- Meets the 1% rule at list price ($7k rent vs $659k).
- Recommended offer: $639k (3.0% below list) — sets the bar for market timing.
- Cap rate 9.0% vs local median 3.7% in Seminole — top-decile yield for the area; either an underpriced asset or a hidden risk that comps aren't pricing in. Stress-test before assuming the spread holds.
Location & tenants
- Location reads 88/100 on livability (#5 in FL, #174 nationally) — a professional / high-income tenant draw. Strengths: commute A+, housing A+, health & safety A+.
- Pinellas (suburban): math 51% / reading 51% proficiency, ranked #31 of 73 in FL (top 42%) — acceptable for families but not a draw, mixed tenant base, ~2y average lease.
- Market conditions: 146 active listings in the ZIP; 17 comparable units currently listed for rent nearby; rentals at typical pace (median 26d on market — plan ~3-4 weeks tenant-placement turnaround); 2,676 units permitted in Pinellas County in 2024 (1,422 in 5+ unit buildings).
Forward outlook
- Local home prices are declining (-3.0%/yr); year-one equity from $5k of loan paydown is wiped out by about $20k of value loss. Plan a longer hold.
- Pinellas County population projected at +14% by 2050 — modest demand growth; plan on rents tracking national, not racing it.
Negotiation context
- It's been on market 41 days — a 3% lower offer ($639k) is reasonable based on typical stale-listing flexibility.
- 2 sale attempts since 11y ago; this cycle's ask has dropped $60k (8%) from the opening price — seller is motivated, your offer sets the floor, not the list.
- Current owner paid $128k; list at $659k implies a 413% gain — meaningful room to come down on a strong offer.
Risks & watch-outs
- Climate carrying-cost: severe wind risk, 99% chance of damaging wind over 30y; extreme-heat days projected 8→28/yr by 2055 (HVAC capex compounding) — expect insurance premiums to compound above CPI over the hold.
Questions for the listing agent
- It's been on market 41 days. Have you received any prior offers? Is the seller open to a 3% concession, seller financing, or rate buy-down credit?
- Built in 1963 — when were the roof, HVAC, electrical panel, plumbing, and water heater last replaced?
- Is there a deadline driving the sale (1031 exchange, divorce, estate, relocation)? That informs how much negotiation room exists.
- Schools are B-rated — typically a magnet for longer-tenancy family renters. What's the average tenant stay here, and is there a school-zone premium baked into asking?
- What's the average days-on-market for RENTAL listings here right now (not sales)? A rising rental-DOM trend means longer vacancies and softer asking-rent achievability than the comps imply.
- What's the recent tenant-quality profile in this submarket — average credit score on applications, eviction rate, late-payment / NSF rate, and stable-employment percentage? A property-management company in the area should have these aggregated.
- How much new for-sale + rental construction is in the pipeline within 1–3 miles? Heavy new supply typically softens prices + rents 12–24 months out; constrained supply supports both.
Investment metrics
- 1% rule
- 1.06% ✓
- Cap rate
- 9.03%
- Cash-on-cash
- 9.77%
- DSCR
- 1.43
- GRM
- 7.8
CMA / ARV
- ARV (on-the-fly)
- $803,502
- Comps found
- 12
Show comp detail 12 sales within ~0.75 mi
| Address | Dist | Beds/Ba | Sqft | Sold | Price | $/sf | Match |
|---|---|---|---|---|---|---|---|
| 7692 132nd Way | 0.36mi | 5/3.0 (+1) | 2,681 (-2%) | 2mo | $755,000 | $282 | 74 |
| 7796 132nd Way | 0.30mi | 5/3.0 (+1) | 2,622 (-4%) | 7mo | $812,000 | $310 | 68 |
| 13780 76th Ave | 0.53mi | 4/3.5 | 2,692 (-2%) | 6mo | $915,000 | $340 | 66 |
| 13764 86th Ave | 0.38mi | 4/3.0 | 2,420 (-12%) | 1mo | $570,000 | $236 | 63 |
| 13189 87th Ave | 0.37mi | 4/3.0 | 2,418 (-12%) | 1mo | $710,000 | $294 | 62 |
| 13800 77th Ave | 0.46mi | 4/3.5 | 2,908 (+6%) | 5mo | $940,000 | $323 | 61 |
| 7490 Pine Valley Ln | 0.45mi | 4/3.0 | 2,468 (-10%) | 8mo | $858,000 | $348 | 56 |
| 8310 140th St | 0.54mi | 4/3.0 | 2,409 (-12%) | 6mo | $845,000 | $351 | 50 |
| 14265 85th Ave | 0.74mi | 4/3.0 | 2,540 (-7%) | 5mo | $745,000 | $293 | 49 |
| 14176 86th Ave | 0.68mi | 5/3.0 (+1) | 2,582 (-6%) | 9mo | $665,000 | $258 | 46 |
| 12835 74th Ave | 0.69mi | 4/3.0 | 2,505 (-8%) | 9mo | $735,000 | $293 | 46 |
| 8501 141st St | 0.59mi | 4/3.0 | 2,328 (-15%) | 10mo | $541,940 | $233 | 40 |
Match score weights: distance 35% · size 25% · config 20% · recency 20%. Top-matched comps best support the ARV.
Projected returns pro-forma
-3.0% appreciation · 3.0% rent growth · sell at horizon
- IRR
- -1.6%
- Equity multiple
- 0.94×
- Total profit
- $-11,362
- Equity at exit
- $98,259
- IRR
- 8.0%
- Equity multiple
- 1.61×
- Total profit
- $112,387
- Equity at exit
- $56,978
Cash invested: $184,520 (down + closing). Projections, not guarantees.
Landlord ↔ Tenant lean methodology
- Overall (STATE)
- 87 Strongly Landlord-Friendly
- State Florida
- 87 Strongly Landlord-Friendly · R+3
- County
- — inherits STATE
- City
- — inherits STATE
ZIP-level market 33776
- Active inventory
- 146
- Price-to-rent
- 7.8×
Monthly cashflow live
- Estimated rent
- $7,007 high interval (Pro) →
- Mortgage (P&I)
- −$3,456
- Tax from tax record
- −$303 /mo · $3,640/yr
- Insurance
- −$275
- HOA
- −$0
- Vacancy / Maint / Mgmt
- −$1,471
- Net cashflow
- $1,502
Break-even live
Sensitivity live
| Price | -10% $1,875 | -5% $1,688 | +0% $1,502 | +5% $1,315 | +10% $1,129 |
|---|---|---|---|---|---|
| Rent | -10% $948 | -5% $1,225 | +0% $1,502 | +5% $1,778 | +10% $2,055 |
| Rate | -1.0pp $1,833 | -0.5pp $1,669 | base $1,502 | +0.5pp $1,331 | +1.0pp $1,157 |
UW: 25.0% down · 7.5% · 30yr · 1.5% tax · 5.0% vac · 8.0% maint · 8.0% mgmt
Financing live
Cash to close
- Down payment
- $164,750
- Closing costs
- $19,770
- Reserves months
- —
- Total cash needed
- —
Loan-product check · same deal, 3 products live
Conventional
25% down · 7.5% · 30yr
- Down + closing
- —
- Monthly P&I
- —
- Monthly cashflow
- —
- DSCR
- —
- Eligible?
- —
Personal DTI + credit; lowest rate.
DSCR
20% down · 8.5% · 30yr
- Down + closing
- —
- Monthly P&I
- —
- Monthly cashflow
- —
- DSCR
- —
- Eligible?
- —
No personal income docs; deal must DSCR.
Hard money
10% down · 12.0% · 12mo
- Down + closing
- —
- Monthly P&I
- —
- Monthly cashflow
- —
- DSCR
- —
- Eligible?
- —
Short-term bridge; refi at stabilization.
Rent comps 17 comps
| Address | Beds | Baths | Sqft | Rent | $/sqft | DOM | Units | Dist |
|---|---|---|---|---|---|---|---|---|
| 7672 140th St Unit NA Seminole, FL | 4.0 | 3.5 | 2840 | $4,700 | $1.65 | 5d | 1 | 0.63mi |
| 14323 83rd Pl N Unit 1471180P Seminole, FL | 4.0 | 3.0 | 2895 | $13,452 | $4.65 | 23d | 1 | 0.82mi |
| 14414 91st Ave Seminole, FL | 3.0 | 2.5 | 2083 | $8,000 | $3.84 | 25d | 1 | 0.98mi |
| 19138 Whispering Pines Dr Indian Shores, FL | 4.0 | 3.0 | 2424 | $8,000 | $3.30 | 25d | 1 | 1.10mi |
| 8873 Tami St Seminole, FL | 3.0 | 2.0 | 1898 | $2,595 | $1.37 | 8d | 1 | 1.11mi |
| 10075 West Bay St Seminole, FL | 5.0 | 2.5 | 2043 | $8,900 | $4.36 | 25d | 1 | 1.14mi |
| 10285 Barry Dr Largo, FL | 3.0 | 3.0 | 3008 | $8,500 | $2.83 | 25d | 1 | 1.28mi |
| 19505 Gulf Blvd #304 Indian Shores, FL | 4.0 | 2.5 | 2388 | $15,000 | $6.28 | 5d | 1 | 1.28mi |
| 326 176th Avenue Cir Redington Shores, FL | 3.0 | 2.0 | 1980 | $6,500 | $3.28 | 25d | 1 | 1.32mi |
| 17900 Gulf Blvd Unit 16C Redington Shores, FL | 3.0 | 3.0 | 1789 | $3,450 | $1.93 | 8d | 1 | 1.35mi |
| 17900 Gulf Blvd Unit 18-C Redington Shores, FL | 3.0 | 2.5 | 1935 | $4,200 | $2.17 | 25d | 1 | 1.35mi |
| 9614 Tara Cay Ct Seminole, FL | 4.0 | 4.0 | 2100 | $2,850 | $1.36 | 21d | 1 | 1.38mi |
| 9794 Indian Key Trl Unit 90 Seminole, FL | 4.0 | 4.0 | 2174 | $3,650 | $1.68 | 25d | 1 | 1.42mi |
| 17745 Gulf Blvd #303 Redington Shores, FL | 3.0 | 3.5 | 3020 | $5,995 | $1.99 | 5d | 1 | 1.42mi |
| 17735 Gulf Blvd #204 Redington Shores, FL | 3.0 | 3.0 | 1995 | $5,500 | $2.76 | 25d | 1 | 1.45mi |
| 17735 Gulf Blvd #501 Redington Shores, FL | 3.0 | 3.0 | 1995 | $4,995 | $2.50 | 25d | 1 | 1.45mi |
| 17810 Lee Ave Redington Shores, FL | 4.0 | 4.0 | 3160 | $18,000 | $5.70 | 25d | 1 | 1.46mi |
Listing history 15 events
-
2026-06-08statusdays on market $659,000 Pending 41 DOM
-
2026-06-07days on market $659,000 Active 40 DOM
-
2026-06-04days on market $659,000 Active 37 DOM
-
2026-06-03days on market $659,000 Active 36 DOM
-
2026-06-02remarks 383-char remark
-
2026-06-01days on market $659,000 Active 34 DOM
-
2026-06-01status $659,000 Active 33 DOM
-
2026-05-21status Pending
-
2026-05-08price $659,000
-
2026-04-18$719,000 Active
-
2016-07-05historical
-
2015-09-28price $369,900
-
2015-09-09$374,900 Active
-
1995-12-27soldstatus $128,500
-
1981-06-01soldstatus $115,000
ⓘ Source: listings_history table (triggers on properties + properties_extension) + one-shot
backfill from property_details.listing_events for pre-trigger history.
Tax reassessment forecast FL · Resets to sale price
- Current annual tax
- $3,640 · $303/mo
- Projected year-2 tax
- $5,470 · $456/mo
- Expected delta
- +$1,830/yr (+$152/mo · 50.3%)
ⓘ Screening estimate from a state-policy table — verify with the county assessor before closing.
Climate risk First Street
- Flood 1/10 Low FEMA zone X (unshaded) · 0% chance over 30 yrs
- Wildfire 1/10 Low
- Heat 10/10 Extreme 8 d/yr ≥107°F today · 28 d/yr by 30 yrs out
- Wind 10/10 Extreme 99% chance of damaging wind over 30 yrs
- Air quality 3/10 Moderate 2 unhealthy d/yr today · 2 by 30 yrs out
Nearby sold comps map
Loading sold comps map…
Walkable amenities ~0.75 mi
Loading nearby amenities…
Taxation est. · year 1
- Rental income
- $84,082
- − Mortgage interest
- −$36,914
- − Property taxes
- −$3,640
- − Insurance
- −$3,295
- − Repairs & maintenance
- −$6,727
- − Management
- −$6,727
- − Depreciation
- −$19,171
- Taxable income
- $7,609
- Est. tax owed @ 24.0%
- −$1,826
- After-tax cash flow
- $16,193/yr
For passive investors: Depreciation is non-cash, so a rental often shows a tax loss while cash-flowing — sheltering income. Rental losses are passive: they offset passive income freely, and up to $25,000/yr can offset ordinary (W-2) income if you actively participate and your MAGI is under $100k (phasing out to $0 by $150k); unused losses carry forward. On sale, claimed depreciation is recaptured at up to 25%, and gains may owe capital-gains tax (a 1031 exchange can defer both). Figures are a year-1 estimate at your 24.0% rate — not tax advice; consult a CPA.
Schools (NCES district)
- District
- Pinellas
- NCES district ID
- 1201560
- Math proficiency
- 51% ▼ -5.00%
- Reading proficiency
- 51% ▼ -3.00%
- Median HH income
- $46,270
- Composite
- 43.27/100
- National rank
- #3046
- State rank
- #31 of 73 in FL
Livability — Seminole
- Score
- 88/100
- State rank
- #5
- US rank
- #174
Category grades
Schools grade is shown separately in the Schools card above.
Census & demographics
- City population
- 42,315
- Population (ZIP)
- 12,711
Population outlook (Pinellas County) Hauer SSP2
- Today (2025)
- 1,027,532 people
- By 2030
- 1,063,586 · +3.5%
- By 2040
- 1,125,020 · +9.5%
- By 2050
- 1,168,637 · +13.7%
- By 2075
- 1,265,188 · +23.1%
- By 2100
- 1,260,357 · +22.7%
Race, ethnicity, and origin ACS 2023
- Neighborhood character
- Predominantly White (84%)
- Race & ethnicity
- White 84% Hispanic / Latino 7% Two or more races 7% Asian 2% Black 2%
- Hispanic origin (detail)
- Mexican 3%
- Common ancestry
- Romanian 7% Lithuanian 3% Slovak 1%
- Foreign-born
- 9% · Canada, Jamaica
- Languages at home
- 89% English-only · Other Indo-European 4% Russian/Polish/Slavic 3% Spanish 2%
Political lean MEDSL · Pinellas
- 2024 margin
- Lean R (+5.2) · D 46.9% · R 52.1%
- 2008→2024 swing
- -13.5pp toward R · 2008: 8.3pp · 2024: -5.2pp
- All cycles
- 2024: R+5.2 2020: D+0.2 2016: R+1.1 2012: D+5.6 2008: D+8.3
Not yet ingested
- Civics
- —
Market trends
- HPI YoY
- ▼ -455.42%
- Current HPI
- 337.3149
- Rent YoY
- —
- Metro
- —
- State GDP YoY
- ▲ 3.28%
- F500 in state
- 36
Industry mix (Fortune 500 HQ in FL)
| Industry | F500 HQs | Revenue |
|---|---|---|
| Industrial Technology | 2 | $29B |
|
||
| Insurance | 2 | $17B |
|
||
| Retail | 1 | $60B |
|
||
| Technology Distribution | 1 | $58B |
|
||
| Homebuilding | 1 | $35B |
|
||
| Technology Manufacturing | 1 | $35B |
|
||
Price history
+473.0% since first listed8 events — show timeline
- 2026-05-21 Pending — Stellar MLS as Distributed by MLS Grid
- 2026-05-08 Price Changed $659,000 Stellar MLS as Distributed by MLS Grid
- 2026-04-18 Listed $719,000 Stellar MLS as Distributed by MLS Grid
- 2016-07-05 Listing Removed — Stellar MLS as Distributed by MLS Grid
- 2015-09-28 Price Changed $369,900 Stellar MLS as Distributed by MLS Grid
- 2015-09-09 Listed $374,900 Stellar MLS as Distributed by MLS Grid
- 1995-12-27 Sold (Public Records) $128,500 Public Records
- 1981-06-01 Sold (Public Records) $115,000 Public Records
Property tax history
-0.6%/yrLatest (2025): $3,640 · +5.8% YoY. Source: county tax records.
Cash-flow waterfall
monthlySold comps — $/sqft
last 12 mo · ≤1 miLoading sold comps…