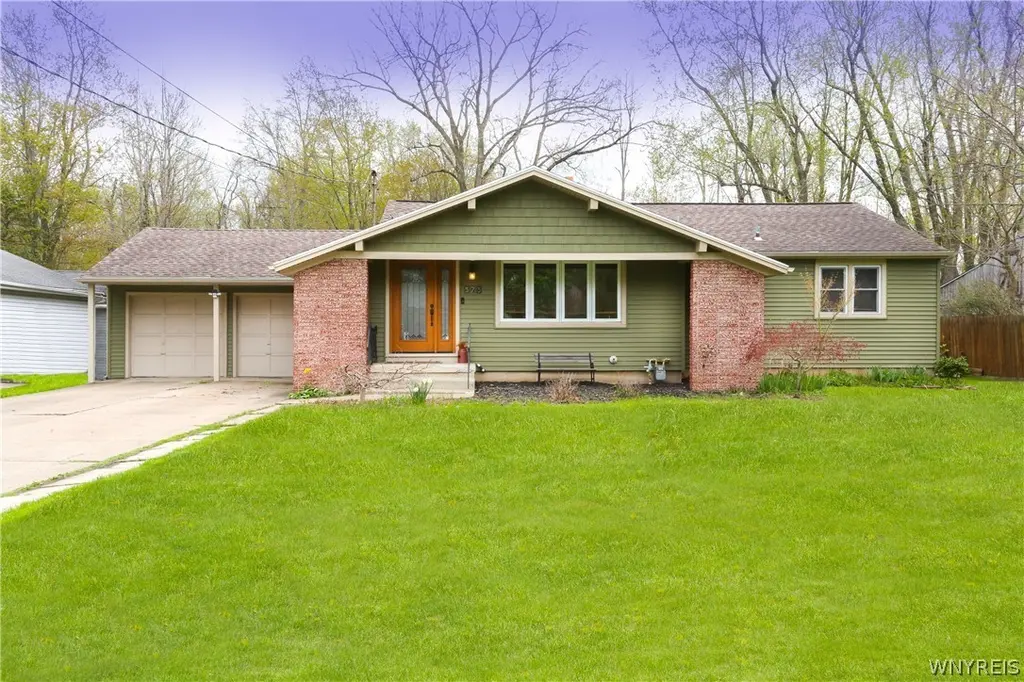
373 Ayer Rd · Williamsville, NY
Flood risk 1/10 · Minimal
- FEMA flood zone
- X (unshaded)
- Chance of flooding over 30 yrs
- 0.0%
- Est. flood insurance / yr
- $473 – $860
Fire risk 1/10 · Minimal
- Est. fire insurance / yr
- $691 – $1,283
Heat risk 2/10 · Minimal
- Hot days now (above 94°F)
- 6 days/yr
- Hot days in 30 yrs
- 13 days/yr
Wind risk 1/10 · Minimal
- Chance of severe wind over 30 yrs
- —
Air-quality risk 2/10 · Minimal
- Unhealthy air days now
- 2 days/yr
- Unhealthy air days in 30 yrs
- 2 days/yr
Risk factors via First Street. Map © Google.
Why this score? — see what drove the D grade
The composite is a weighted blend of 9 inputs, each scored 0–100. Each bar is that input's sub-score; the figure is the points it added to the 100-point composite (weight × sub-score).
- ARV discount +15.0/15.0
- Cash flow +7.5/30.0
- Schools +6.3/10.0
- Livability +4.2/5.0
- Rent growth +3.8/5.0
- 1% rule +2.5/10.0
- Condition / age +2.5/5.0
- DSCR +1.6/10.0
- Appreciation +0.0/10.0
$330,000
🖨 Deal sheet (PDF) 📄 Offer letter ✓ Due diligence
Listing remarks
Welcome to this stand-out gem nestled quaintly in the highly desirable Williamsville School District! Unbeatable location accessible to I-990, I-290, Maple Road, Transit Road, and the Village of Williamsville. Through the welcoming front entry, you’re greeted by a bright and cozy entry space, with very spacious adjacent living area. Off the living space are three nicely sized bedrooms, and an extremely well kept full bath. Past the living/sitting area is a spacious, warm and cozy kitchen area, featuring plenty of counter space, eating space, and full of natural light overlooking the backyard beyond. First floor laundry with additional full bath. Large, full sized basement provides sp
Key facts
- 0.44 acre lot
- 2 garage spots
- Built 1954
Property features AI
Exterior
- Parking: Attached 2-car garage
- Utilities: Public water connected; Sewer connected; Electric service available
- Home design: Single-story home; Resale property; Brick and vinyl siding exterior
- Construction: Built (existing); Poured foundation; Brick and vinyl siding construction; Shingle roof (not explicitly listed; construction materials listed include brick and vinyl siding)
- Exterior features: Concrete driveway; Rectangular residential lot (approx. 0.44 acres, 85 x 225); City street frontage
Interior
- Kitchen: Dishwasher; Gas oven; Gas range; Refrigerator; Eat-in kitchen with breakfast bar
- Bedrooms: 3 main-level bedrooms
- Flooring: Carpet; Hardwood; Tile; Varies
- Bathrooms: 2 full bathrooms (both on the main level)
- Heating & cooling: Gas forced-air heating; Central air conditioning
- Interior features: Breakfast bar; Eat-in kitchen; Family room
- Laundry & utility: Main-level laundry; Gas water heater
Neighborhood map
What this means for you Summary
Snapshot
- This is a 3-bed/1.5-bath single-family listed at $330k.
Deal economics
- At list price, monthly cash flow is $-414 ($-5k/yr) — negative.
- To cash-flow at today's rent, offer at most $257k (22.2% below list).
- To meet the 1% rule (rent ≥ 1% of price), the offer needs to be $246k (25.4% below list).
- Recommended offer: $246k (25.4% below list) — sets the bar for 1% rule.
- Cap rate 4.8% vs local median 3.5% in Williamsville — top-decile yield for the area; either an underpriced asset or a hidden risk that comps aren't pricing in. Stress-test before assuming the spread holds.
Location & tenants
- Location reads 84/100 on livability (#44 in NY, #693 nationally) — a professional / high-income tenant draw. Strengths: schools A+, commute A+, employment A+.
- Williamsville Central School District (suburban): math 64% / reading 77% proficiency, ranked #114 of 590 in NY (top 19%) — strong family-tenant draw, lease renewals of 3-5y typical; only 10% free/reduced lunch — higher-income household profile.
- Market conditions: Rents rising fast (+5.0%/yr); 334 active listings in the ZIP; 5 comparable units currently listed for rent nearby; rentals leasing fast (median 4d on market — plan ~1-2 weeks tenant-placement turnaround); solid renter incomes; 1,244 units permitted in Erie County in 2024 (563 in 5+ unit buildings).
Forward outlook
- Local home prices are declining (-3.0%/yr); year-one equity from $2k of loan paydown is wiped out by about $10k of value loss. Plan a longer hold.
Negotiation context
- Only 11 days on market — expect competitive offers; lowballing is unlikely to land.
- Current owner paid $98k; list at $330k implies a 235% gain — meaningful room to come down on a strong offer.
Risks & watch-outs
- Watch-outs: built in 1954 — expect roof / HVAC / electrical / plumbing capex.
Questions for the listing agent
- What do current leases actually rent for vs. the listed asking? Can we see a recent rent roll and the last 12 months of T-12 income?
- Built in 1954 — when were the roof, HVAC, electrical panel, plumbing, and water heater last replaced?
- Is there a deadline driving the sale (1031 exchange, divorce, estate, relocation)? That informs how much negotiation room exists.
- Schools are A-rated — typically a magnet for longer-tenancy family renters. What's the average tenant stay here, and is there a school-zone premium baked into asking?
- The area grade is low — what's the realistic commute time and amenity access for the typical tenant pool here? Any planned neighborhood developments (good or bad) we should know about?
- What's the average days-on-market for RENTAL listings here right now (not sales)? A rising rental-DOM trend means longer vacancies and softer asking-rent achievability than the comps imply.
- What's the recent tenant-quality profile in this submarket — average credit score on applications, eviction rate, late-payment / NSF rate, and stable-employment percentage? A property-management company in the area should have these aggregated.
- How much new for-sale + rental construction is in the pipeline within 1–3 miles? Heavy new supply typically softens prices + rents 12–24 months out; constrained supply supports both.
Investment metrics
- 1% rule
- 0.75% ✗
- Cap rate
- 4.79%
- Cash-on-cash
- -5.38%
- DSCR
- 0.76
- GRM
- 11.2
CMA / ARV
- ARV (median comp)
- $396,869
- List price
- $330,000
- Delta
- -16.85%
- Verdict
- UNDERPRICED
- Comps
- 20 within 1.0 mi
Show comp detail 12 sales within ~0.75 mi
| Address | Dist | Beds/Ba | Sqft | Sold | Price | $/sf | Match |
|---|---|---|---|---|---|---|---|
| 225 Ayer Rd | 0.29mi | 3/1.0 | 1,376 (-5%) | 10mo | $287,000 | $209 | 68 |
| 47 Brian Ave | 0.31mi | 3/1.5 | 1,542 (+7%) | 10mo | $380,000 | $246 | 66 |
| 336 Fruitwood | 0.62mi | 3/1.5 | 1,427 (-1%) | 5mo | $355,000 | $249 | 65 |
| 15 Culpepper Rd | 0.69mi | 3/1.5 | 1,428 (-1%) | 5mo | $414,500 | $290 | 62 |
| 92 Ayer Rd | 0.54mi | 3/2.0 | 1,474 (+2%) | 14mo | $254,500 | $173 | 57 |
| 284 Ayer Rd | 0.18mi | 2/1.5 (-1) | 1,254 (-13%) | 11mo | $340,000 | $271 | 56 |
| 4 Jack Rd | 0.23mi | 3/2.0 | 1,645 (+14%) | 18mo | $340,000 | $207 | 49 |
| 61 Gatewood Ln | 0.53mi | 3/1.5 | 1,590 (+10%) | 12mo | $393,500 | $247 | 48 |
| 5780 Sheridan Dr | 0.70mi | 3/1.0 | 1,284 (-11%) | 11mo | $246,000 | $192 | 38 |
| 574 Seabrook Dr | 0.55mi | 3/2.5 | 1,595 (+10%) | 20mo | $415,000 | $260 | 36 |
| 489 Sagewood Ter | 0.74mi | 4/2.5 (+1) | 1,594 (+10%) | 12mo | $400,000 | $251 | 30 |
| 1465 Maple Rd | 0.65mi | 3/2.0 | 1,242 (-14%) | 18mo | $310,000 | $250 | 29 |
Match score weights: distance 35% · size 25% · config 20% · recency 20%. Top-matched comps best support the ARV.
Projected returns pro-forma
-3.0% appreciation · 5.01% rent growth · sell at horizon
- IRR
- -23.2%
- Equity multiple
- 0.19×
- Total profit
- $-74,692
- Equity at exit
- $49,204
- IRR
- -13.1%
- Equity multiple
- 0.17×
- Total profit
- $-76,950
- Equity at exit
- $28,532
Cash invested: $92,400 (down + closing). Projections, not guarantees.
Landlord ↔ Tenant lean methodology
- Overall (STATE)
- 15 Strongly Tenant-Friendly
- State New York
- 15 Strongly Tenant-Friendly · D+10
- County
- — inherits STATE
- City
- — inherits STATE
ZIP-level market 14221
- Rents YoY
- 5.0%
- Active inventory
- 334
- Price-to-rent
- 11.2×
Monthly cashflow live
- Estimated rent
- $2,462 high interval (Pro) →
- Mortgage (P&I)
- −$1,731
- Tax from tax record
- −$491 /mo · $5,893/yr
- Insurance
- −$138
- HOA
- −$0
- Vacancy / Maint / Mgmt
- −$517
- Net cashflow
- $-414
Break-even live
Sensitivity live
| Price | -10% $-227 | -5% $-321 | +0% $-414 | +5% $-508 | +10% $-601 |
|---|---|---|---|---|---|
| Rent | -10% $-609 | -5% $-511 | +0% $-414 | +5% $-317 | +10% $-220 |
| Rate | -1.0pp $-248 | -0.5pp $-330 | base $-414 | +0.5pp $-500 | +1.0pp $-587 |
UW: 25.0% down · 7.5% · 30yr · 1.5% tax · 5.0% vac · 8.0% maint · 8.0% mgmt
Financing live
Cash to close
- Down payment
- $82,500
- Closing costs
- $9,900
- Reserves months
- —
- Total cash needed
- —
Loan-product check · same deal, 3 products live
Conventional
25% down · 7.5% · 30yr
- Down + closing
- —
- Monthly P&I
- —
- Monthly cashflow
- —
- DSCR
- —
- Eligible?
- —
Personal DTI + credit; lowest rate.
DSCR
20% down · 8.5% · 30yr
- Down + closing
- —
- Monthly P&I
- —
- Monthly cashflow
- —
- DSCR
- —
- Eligible?
- —
No personal income docs; deal must DSCR.
Hard money
10% down · 12.0% · 12mo
- Down + closing
- —
- Monthly P&I
- —
- Monthly cashflow
- —
- DSCR
- —
- Eligible?
- —
Short-term bridge; refi at stabilization.
Rent comps 5 comps
| Address | Beds | Baths | Sqft | Rent | $/sqft | DOM | Units | Dist |
|---|---|---|---|---|---|---|---|---|
| 23 Northwood Dr Buffalo, NY | 1.0–2.0 | 1.0–2.0 | 800 | $2,145 | $2.68 | 3d | 1 | 0.71mi |
| 10 Arielle Ct Williamsville, NY | 1.0–3.0 | 1.0–2.0 | 1063 | $2,738 | $2.57 | 3d | 10 | 1.19mi |
| 116 Segsbury Rd Buffalo, NY | 3.0 | 2.0 | 1488 | $2,950 | $1.98 | 25d | 1 | 1.21mi |
| 160 Glendon Pl Williamsville, NY | 2.0 | 2.5 | 1470 | $2,310 | $1.57 | 4d | 1 | 1.35mi |
| 540 Mill St Buffalo, NY | 3.0 | 1.5 | 1300 | $2,095 | $1.61 | 3d | 1 | 1.44mi |
Listing history 3 events
-
2026-05-16status Pending 1217-char remark
-
2026-05-05$330,000 Active 1217-char remark
-
1998-08-21soldstatus $98,450
ⓘ Source: listings_history table (triggers on properties + properties_extension) + one-shot
backfill from property_details.listing_events for pre-trigger history.
Tax reassessment forecast NY · Partial reset (capped growth)
- Current annual tax
- $5,893 · $491/mo
- Projected year-2 tax
- $5,893 · $491/mo
- Expected delta
- $0/yr ($0/mo · -0.0%)
ⓘ Screening estimate from a state-policy table — verify with the county assessor before closing.
Climate risk First Street
- Flood 1/10 Low FEMA zone X (unshaded) · 0% chance over 30 yrs
- Wildfire 1/10 Low
- Heat 2/10 Low 6 d/yr ≥94°F today · 13 d/yr by 30 yrs out
- Wind 1/10 Low
- Air quality 2/10 Low 2 unhealthy d/yr today · 2 by 30 yrs out
Nearby sold comps map
Loading sold comps map…
Walkable amenities ~0.75 mi
Loading nearby amenities…
Taxation est. · year 1
- Rental income
- $29,543
- − Mortgage interest
- −$18,485
- − Property taxes
- −$5,893
- − Insurance
- −$1,650
- − Repairs & maintenance
- −$2,363
- − Management
- −$2,363
- − Depreciation
- −$9,600
- Taxable loss
- −$10,812
- Est. tax savings @ 24.0%
- +$2,595
- After-tax cash flow
- $-2,376/yr
For passive investors: Depreciation is non-cash, so a rental often shows a tax loss while cash-flowing — sheltering income. Rental losses are passive: they offset passive income freely, and up to $25,000/yr can offset ordinary (W-2) income if you actively participate and your MAGI is under $100k (phasing out to $0 by $150k); unused losses carry forward. On sale, claimed depreciation is recaptured at up to 25%, and gains may owe capital-gains tax (a 1031 exchange can defer both). Figures are a year-1 estimate at your 24.0% rate — not tax advice; consult a CPA.
Schools (NCES district)
- District
- Williamsville Central School District
- NCES district ID
- 3631470
- Math proficiency
- 64% ▼ -14.00%
- Reading proficiency
- 77% ▲ 6.00%
- Median HH income
- $79,907
- Composite
- 62.59/100
- National rank
- #678
- State rank
- #114 of 590 in NY
Livability — Williamsville
- Score
- 84/100
- State rank
- #44
- US rank
- #693
Category grades
Schools grade is shown separately in the Schools card above.
Census & demographics
- County
- Erie County · 714,559 people
- City population
- 55,255
- Metro
- Buffalo-Cheektowaga, NY
- Population (ZIP)
- 55,255
- Household income
- $101,615
- Rent vs Own
- Severe rent burden
- 1956.0
Population outlook (Erie County) Hauer SSP2
- Today (2025)
- 933,037 people
- By 2030
- 935,181 · +0.2%
- By 2040
- 928,531 · -0.5%
- By 2050
- 905,725 · -2.9%
- By 2075
- 834,037 · -10.6%
- By 2100
- 708,033 · -24.1%
Race, ethnicity, and origin ACS 2023
- Neighborhood character
- Predominantly White (84%)
- Race & ethnicity
- White 84% Asian 8% Two or more races 4% Hispanic / Latino 3% Black 2%
- Common ancestry
- Romanian 15% Lithuanian 2% Slovak 2%
- Foreign-born
- 10% · Canada, China, South Korea
- Languages at home
- 88% English-only · Other Indo-European 3% Other Asian/Pacific 2% Spanish 2%
Political lean MEDSL · Erie
- 2024 margin
- Lean D (+9.7) · D 54.8% · R 45.2%
- 2008→2024 swing
- -7.9pp toward R · 2008: 17.5pp · 2024: 9.7pp
- All cycles
- 2024: D+9.7 2020: D+14.7 2016: D+4.8 2012: D+15.6 2008: D+17.5
Not yet ingested
- Civics
- —
Market trends
- HPI YoY
- ▼ -301.37%
- Current HPI
- 322.6947
- Rent YoY
- ▲ 5.01%
- Metro
- Buffalo-Cheektowaga, NY
- State GDP YoY
- ▲ 2.60%
- F500 in state
- 92
Industry mix (Fortune 500 HQ in NY)
| Industry | F500 HQs | Revenue |
|---|---|---|
| Financial Services | 10 | $950B |
|
||
| Consumer Goods | 9 | $162B |
|
||
| Insurance | 4 | $225B |
|
||
| Telecommunications | 2 | $144B |
|
||
| Pharmaceuticals | 2 | $112B |
|
||
| Media / Entertainment | 2 | $69B |
|
||
Price history
+235.2% since first listed3 events — show timeline
- 2026-05-16 Pending — WNYREIS
- 2026-05-05 Listed $330,000 WNYREIS
- 1998-08-21 Sold (Public Records) $98,450 Public Records
Property tax history
+3.6%/yrLatest (2025): $5,893 · +1.8% YoY. Source: county tax records.
Cash-flow waterfall
monthlySold comps — $/sqft
last 12 mo · ≤1 miLoading sold comps…