 Multi-family
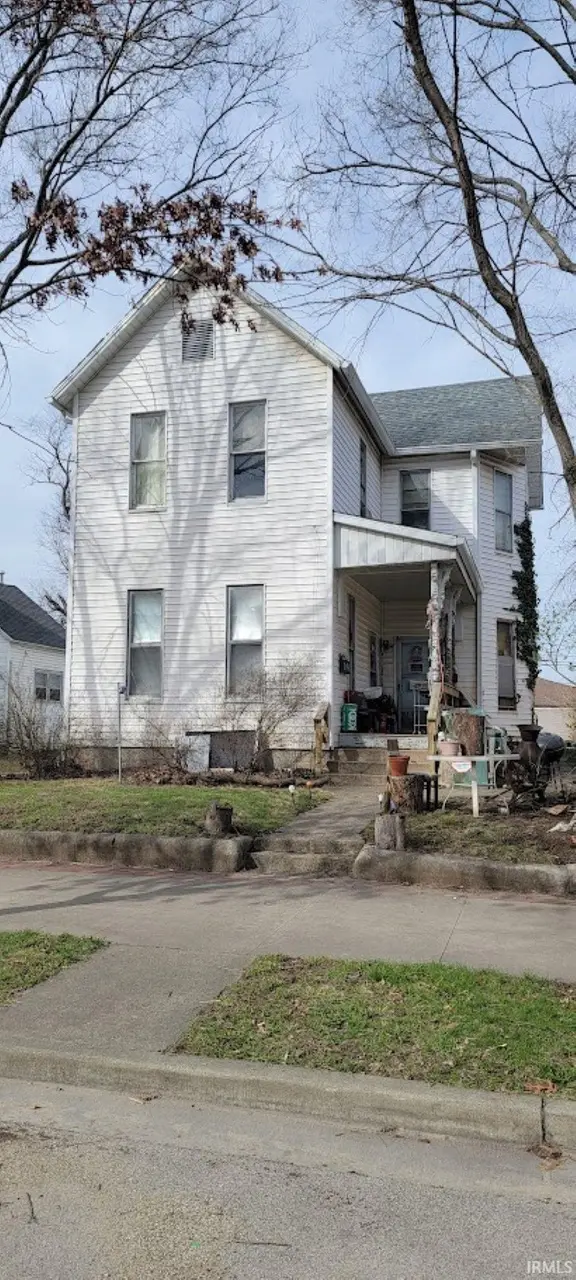
1003 S 4th St · Terre Haute, IN
Flood risk 1/10 · Minimal
- FEMA flood zone
- X (unshaded)
- Chance of flooding over 30 yrs
- 0.0%
- Est. flood insurance / yr
- $473 – $860
Fire risk 2/10 · Minimal
- Est. fire insurance / yr
- $717 – $1,331
Heat risk 5/10 · Moderate
- Hot days now (above 105°F)
- 7 days/yr
- Hot days in 30 yrs
- 19 days/yr
Wind risk 2/10 · Minimal
- Chance of severe wind over 30 yrs
- 1.0%
Air-quality risk 3/10 · Minor
- Unhealthy air days now
- 3 days/yr
- Unhealthy air days in 30 yrs
- 4 days/yr
Risk factors via First Street. Map © Google.
Why this score? — see what drove the B+ grade
The composite is a weighted blend of 9 inputs, each scored 0–100. Each bar is that input's sub-score; the figure is the points it added to the 100-point composite (weight × sub-score).
- Cash flow +30.0/30.0
- 1% rule +10.0/10.0
- DSCR +10.0/10.0
- ARV discount +7.5/15.0
- Appreciation +7.1/10.0
- Livability +3.8/5.0
- Rent growth +3.4/5.0
- Schools +2.9/10.0
- Condition / age +2.5/5.0
$150,000
🖨 Deal sheet (PDF) 📄 Offer letter ✓ Due diligence
Multi-family units
County records classify this as Multi-Family (2-4 Unit). Listing-text estimate: 1 unit. estimate disagrees with records
Listing remarks MLS
Four rental unit Portfolio available for sale in Terre Haute, Indiana near Indiana State University. This portfolio offers awesome stability with tenants being at the property between two years (Newest tenant) and 17 years ( Longest Tenant). . Made up of a 3 unit property and one single family unit. These 2 Cash flowing Assets offer a Gross Monthly Income of $2675.00 giving an Investor lots of Cash Flow Cushion. .. Invest in an asset that will pay you when you sleep.
Key facts
- 5,227 sq ft lot
- 2 parking spots
- Built 1880
Neighborhood map
What this means for you Summary
Snapshot
- This is a 2-bed/3.0-bath multifamily listed at $150k.
Deal economics
- At list price, monthly cash flow is $2k ($18k/yr) — positive.
- The deal already cash-flows at list — no discount required.
- Meets the 1% rule at list price ($3k rent vs $150k).
- Recommended offer: $141k (6.0% below list) — sets the bar for market timing.
- Cap rate 18.5% vs local median 4.7% in Terre Haute — top-decile yield for the area; either an underpriced asset or a hidden risk that comps aren't pricing in. Stress-test before assuming the spread holds.
Location & tenants
- Location reads 75/100 on livability (#63 in IN, #4,186 nationally) — a middle-class / working-renter tenant base. Strengths: cost of living A+, housing A+, health & safety A+; Watch: crime F, employment F.
- Vigo County School Corporation (urban): math 32% / reading 37% proficiency, ranked #202 of 301 in IN (top 67%) — families likely to look elsewhere, expect single-tenant / working-renter base with shorter leases.
- Zoned schools: Farrington Grove Elementary School (math 27% / reading 22%, grade F, #762 of 994 statewide, top 78%, 428 students, 92% FRL); Sarah Scott Middle School (math 8% / reading 18%, grade F, #304 of 330 statewide, top 94%, 397 students, 86% FRL); Terre Haute South Vigo High School (math 37% / reading 72%, grade C-, #79 of 369 statewide, top 26%, 1,610 students, 51% FRL) — zoned schools average 76% FRL vs 47% district-wide (29 pts higher); higher-poverty schools than district average — tighter screening recommended.
- Market conditions: Rents rising (+3.7%/yr); 78 active listings in the ZIP; 4 comparable units currently listed for rent nearby; rentals lingering (median 45d on market — plan ~5-8 weeks vacancy on turnover, expect pricing pressure); 100% of comp listings sitting > 30 days — soft ceiling on asking rent; lower-income renter base — watch delinquency; 60 units permitted in Vigo County in 2024 (0 in 5+ unit buildings).
- At $3,183/mo this rent would consume 155% of the median local household income ($25k/yr) (locally 1836% of renters already pay >50% of income on rent) — very limited rent-growth headroom before tenants either downsize or default.
Forward outlook
- In year one you build about $7k of equity ($1k loan paydown + $6k appreciation (4.1% local appreciation)).
- Vigo County population projected to shrink 5% by 2050 — rents likely to lag national; underwrite the cash flow, not the appreciation.
- At projected returns (4.1% appreciation + 3.7% rent growth), your $42k cash investment doubles in ~2 years — after that, you're playing with house money.
- By year 5, paydown + projected appreciation supports a ~$31k cash-out refi (75% LTV) — recoverable capital for the next deal without selling this one.
Negotiation context
- It's been on market 89 days — a 6% lower offer ($141k) is reasonable based on typical stale-listing flexibility.
Risks & watch-outs
- Watch-outs: built in 1880 — expect roof / HVAC / electrical / plumbing capex.
- Climate carrying-cost: extreme-heat days projected 7→19/yr by 2055 (HVAC capex compounding) — expect insurance premiums to compound above CPI over the hold.
Questions for the listing agent
- It's been on market 89 days. Have you received any prior offers? Is the seller open to a 6% concession, seller financing, or rate buy-down credit?
- Built in 1880 — when were the roof, HVAC, electrical panel, plumbing, and water heater last replaced?
- Why hasn't it sold? Are there any deal-killer items the seller is aware of (foundation, flood, title, zoning, code violations)?
- Is there a deadline driving the sale (1031 exchange, divorce, estate, relocation)? That informs how much negotiation room exists.
- Schools are D-rated, which usually means shorter tenancies and higher turnover. Who's the typical renter profile here, and what's been the actual vacancy rate?
- Crime grade is F in this area — have there been break-ins, vandalism, or insurance claims at this property in the last 3 years? What carrier currently insures it and at what premium?
- What's the average days-on-market for RENTAL listings here right now (not sales)? A rising rental-DOM trend means longer vacancies and softer asking-rent achievability than the comps imply.
- What's the recent tenant-quality profile in this submarket — average credit score on applications, eviction rate, late-payment / NSF rate, and stable-employment percentage? A property-management company in the area should have these aggregated.
- How much new apartment / multifamily construction is in the pipeline within 1–3 miles? Heavy new supply (>2% of stock underway) typically softens rents 12–24 months out; light construction supports rent growth.
Investment metrics
- 1% rule
- 2.12% ✓
- Cap rate
- 18.55%
- Cash-on-cash
- 43.77%
- DSCR
- 2.95
- GRM
- 3.9
CMA / ARV
- ARV (median comp)
- $89,855
- List price
- $150,000
- Delta
- 66.93%
- Verdict
- OVERPRICED
- Comps
- 7 within 1.0 mi
Projected returns pro-forma
4.14% appreciation · 3.74% rent growth · sell at horizon
- IRR
- 51.3%
- Equity multiple
- 4.03×
- Total profit
- $127,318
- Equity at exit
- $77,303
- IRR
- 50.2%
- Equity multiple
- 8.36×
- Total profit
- $309,160
- Equity at exit
- $127,443
Cash invested: $42,000 (down + closing). Projections, not guarantees.
Landlord ↔ Tenant lean methodology
- Overall (STATE)
- 90 Strongly Landlord-Friendly
- State Indiana
- 90 Strongly Landlord-Friendly · R+11
- County
- — inherits STATE
- City
- — inherits STATE
ZIP-level market 47807
- Home prices YoY
- 2.8%
- Rents YoY
- 3.7%
- Active inventory
- 78
- Price-to-rent
- 15.7×
Monthly cashflow live
- Estimated rent
- $3,183 medium interval (Pro) →
- Mortgage (P&I)
- −$787
- Tax from tax record
- −$133 /mo · $1,600/yr
- Insurance
- −$62
- HOA
- −$0
- Vacancy / Maint / Mgmt
- −$668
- Net cashflow
- $1,532
Break-even live
Sensitivity live
| Price | -10% $1,617 | -5% $1,575 | +0% $1,532 | +5% $1,490 | +10% $1,447 |
|---|---|---|---|---|---|
| Rent | -10% $1,281 | -5% $1,406 | +0% $1,532 | +5% $1,658 | +10% $1,784 |
| Rate | -1.0pp $1,608 | -0.5pp $1,570 | base $1,532 | +0.5pp $1,493 | +1.0pp $1,454 |
4-unit breakdown (identical units grouped — click to expand)
| Units | Beds | Baths | Est. rent |
|---|---|---|---|
| 4× units | 2 | 1 | $3,184 |
| #1 | 2 | 1 | $796 |
| #2 | 2 | 1 | $796 |
| #3 | 2 | 1 | $796 |
| #4 | 2 | 1 | $796 |
| Total (4 units) | $3,183 | ||
UW: 25.0% down · 7.5% · 30yr · 1.5% tax · 5.0% vac · 8.0% maint · 8.0% mgmt
Financing live
Cash to close
- Down payment
- $37,500
- Closing costs
- $4,500
- Reserves months
- —
- Total cash needed
- —
Loan-product check · same deal, 3 products live
Conventional
25% down · 7.5% · 30yr
- Down + closing
- —
- Monthly P&I
- —
- Monthly cashflow
- —
- DSCR
- —
- Eligible?
- —
Personal DTI + credit; lowest rate.
DSCR
20% down · 8.5% · 30yr
- Down + closing
- —
- Monthly P&I
- —
- Monthly cashflow
- —
- DSCR
- —
- Eligible?
- —
No personal income docs; deal must DSCR.
Hard money
10% down · 12.0% · 12mo
- Down + closing
- —
- Monthly P&I
- —
- Monthly cashflow
- —
- DSCR
- —
- Eligible?
- —
Short-term bridge; refi at stabilization.
Rent comps 4 comps
| Address | Beds | Baths | Sqft | Rent | $/sqft | DOM | Units | Dist |
|---|---|---|---|---|---|---|---|---|
| 1011 S 4th St Terre Haute, IN | 2.0 | 1.0 | 1268 | $750 | $0.59 | 45d | 1 | 0.02mi |
| 600 S Center St Unit 602 Terre Haute, IN | 3.0 | 1.5 | 1500 | $2,500 | $1.67 | 45d | 1 | 0.41mi |
| 1 Sycamore St Terre Haute, IN | 2.0 | 2.0 | 1311 | $1,510 | $1.15 | 45d | 1 | 1.14mi |
| 1915 Poplar St Unit A Terre Haute, IN | 3.0 | 1.0 | 1412 | $1,200 | $0.85 | 45d | 1 | 1.42mi |
Listing history 19 events
-
2026-06-21days on market $150,000 Active 89 DOM
-
2026-06-19days on market $150,000 Active 87 DOM
-
2026-06-18days on market $150,000 Active 86 DOM
-
2026-06-17days on market $150,000 Active 85 DOM
-
2026-06-16days on market $150,000 Active 84 DOM
-
2026-06-15days on market $150,000 Active 83 DOM
-
2026-06-14days on market $150,000 Active 81 DOM
-
2026-06-13days on market $150,000 Active 80 DOM
-
2026-06-10days on market $150,000 Active 78 DOM
-
2026-06-09pricedays on market $150,000 Active 77 DOM
-
2026-06-08days on market $157,000 Active 76 DOM
-
2026-06-07days on market $157,000 Active 75 DOM
-
2026-06-05days on market $157,000 Active 72 DOM
-
2026-06-02days on market $157,000 Active 70 DOM
-
2026-06-01days on market $157,000 Active 69 DOM
-
2026-05-31days on market $157,000 Active 68 DOM
-
2026-05-30days on market $157,000 Active 67 DOM
-
2026-05-12price $157,000 472-char remark
Show marketing remark (472 chars)
Four rental unit Portfolio available for sale in Terre Haute, Indiana near Indiana State University. This portfolio offers awesome stability with tenants being at the property between two years (Newest tenant) and 17 years ( Longest Tenant). . Made up of a 3 unit property and one single family unit. These 2 Cash flowing Assets offer a Gross Monthly Income of $2675.00 giving an Investor lots of Cash Flow Cushion. .. Invest in an asset that will pay you when you sleep.
-
2026-03-24$175,000 Active 472-char remark
Show marketing remark (472 chars)
Four rental unit Portfolio available for sale in Terre Haute, Indiana near Indiana State University. This portfolio offers awesome stability with tenants being at the property between two years (Newest tenant) and 17 years ( Longest Tenant). . Made up of a 3 unit property and one single family unit. These 2 Cash flowing Assets offer a Gross Monthly Income of $2675.00 giving an Investor lots of Cash Flow Cushion. .. Invest in an asset that will pay you when you sleep.
ⓘ Source: listings_history table (triggers on properties + properties_extension) + one-shot
backfill from property_details.listing_events for pre-trigger history.
Tax reassessment forecast IN · Partial reset (capped growth)
- Current annual tax
- $1,600 · $133/mo
- Projected year-2 tax
- $1,600 · $133/mo
- Expected delta
- $0/yr ($0/mo · 0.0%)
ⓘ Screening estimate from a state-policy table — verify with the county assessor before closing.
Climate risk First Street
- Flood 1/10 Low FEMA zone X (unshaded) · 0% chance over 30 yrs
- Wildfire 2/10 Low
- Heat 5/10 Major 7 d/yr ≥105°F today · 19 d/yr by 30 yrs out
- Wind 2/10 Low 100% chance of damaging wind over 30 yrs
- Air quality 3/10 Moderate 3 unhealthy d/yr today · 4 by 30 yrs out
Nearby sold comps map
Loading sold comps map…
Walkable amenities ~0.75 mi
Loading nearby amenities…
Taxation est. · year 1
- Rental income
- $38,196
- − Mortgage interest
- −$8,402
- − Property taxes
- −$1,600
- − Insurance
- −$750
- − Repairs & maintenance
- −$3,056
- − Management
- −$3,056
- − Depreciation
- −$4,364
- Taxable income
- $16,969
- Est. tax owed @ 24.0%
- −$4,072
- After-tax cash flow
- $14,313/yr
For passive investors: Depreciation is non-cash, so a rental often shows a tax loss while cash-flowing — sheltering income. Rental losses are passive: they offset passive income freely, and up to $25,000/yr can offset ordinary (W-2) income if you actively participate and your MAGI is under $100k (phasing out to $0 by $150k); unused losses carry forward. On sale, claimed depreciation is recaptured at up to 25%, and gains may owe capital-gains tax (a 1031 exchange can defer both). Figures are a year-1 estimate at your 24.0% rate — not tax advice; consult a CPA.
Schools (NCES district)
- District
- Vigo County School Corporation
- NCES district ID
- 1812090
- Math proficiency
- 32% ▼ -10.00%
- Reading proficiency
- 37% ▼ -8.00%
- Median HH income
- $40,100
- Composite
- 28.97/100
- National rank
- #6625
- State rank
- #202 of 301 in IN
Livability — Terre Haute
- Score
- 75/100
- State rank
- #63
- US rank
- #4186
Category grades
Schools grade is shown separately in the Schools card above.
Census & demographics
- Census place
- Terre Haute, IN
- County
- Vigo County · 91,193 people
- City population
- 91,193
- Metro
- Terre Haute, IN
- Population (ZIP)
- 13,140
- Household income
- $24,706
- Rent vs Own
- Severe rent burden
- 1836.0
Population outlook (Vigo County) Hauer SSP2
- Today (2025)
- 106,366 people
- By 2030
- 105,674 · -0.7%
- By 2040
- 103,731 · -2.5%
- By 2050
- 101,200 · -4.9%
- By 2075
- 95,674 · -10.1%
- By 2100
- 85,910 · -19.2%
Race, ethnicity, and origin ACS 2023
- Neighborhood character
- Predominantly White (74%)
- Race & ethnicity
- White 74% Black 14% Two or more races 8% Hispanic / Latino 4%
- Common ancestry
- Slovak 4% Romanian 2% Lithuanian 1%
- Foreign-born
- 3% · Canada
- Languages at home
- 94% English-only · Spanish 4% Arabic 1%
Political lean MEDSL · Vigo
- 2024 margin
- R (+18.1) · D 40.0% · R 58.1% · Other 2.0%
- 2008→2024 swing
- -33.9pp toward R · 2008: 15.8pp · 2024: -18.1pp
- All cycles
- 2024: R+18.1 2020: R+14.7 2016: R+15.2 2012: D+0.8 2008: D+15.8
Not yet ingested
- Civics
- —
Market trends
- HPI YoY
- ▲ 4.14%
- Current HPI
- 152.8073
- Rent YoY
- ▲ 3.74%
- Metro
- Terre Haute, IN
- State GDP YoY
- ▲ 2.90%
- F500 in state
- 18
Industry mix (Fortune 500 HQ in IN)
| Industry | F500 HQs | Revenue |
|---|---|---|
| Industrial Machinery | 2 | $37B |
|
||
| Healthcare | 1 | $177B |
|
||
| Pharmaceuticals | 1 | $45B |
|
||
| Metals / Steel | 1 | $18B |
|
||
| Agriculture | 1 | $17B |
|
||
| Packaging | 1 | $12B |
|
||
Price history
-10.3% since first listed2 events — show timeline
- 2026-05-12 Price Changed $157,000 IRMLS
- 2026-03-24 Listed $175,000 IRMLS
Property tax history
-3.5%/yrLatest (2024): $1,600 · +2.1% YoY. Source: county tax records.
Cash-flow waterfall
monthlySold comps — $/sqft
last 12 mo · ≤1 miLoading sold comps…