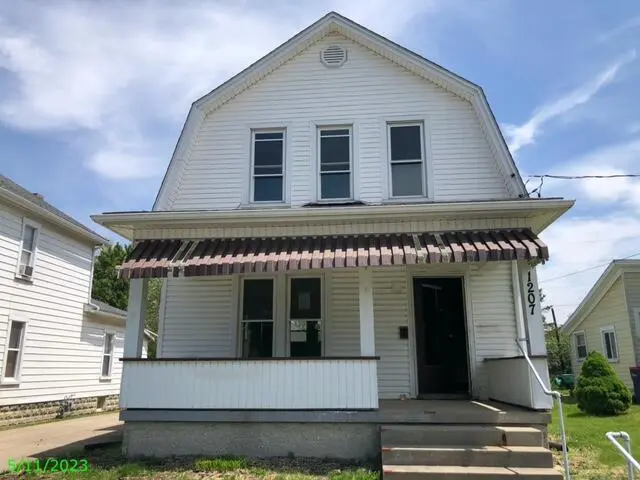
1207 S Roosevelt Ave · Piqua, OH
Flood risk 1/10 · Minimal
- FEMA flood zone
- X (unshaded)
- Chance of flooding over 30 yrs
- 0.0%
- Est. flood insurance / yr
- $473 – $860
Fire risk 1/10 · Minimal
- Est. fire insurance / yr
- $713 – $1,323
Heat risk 3/10 · Minor
- Hot days now (above 100°F)
- 7 days/yr
- Hot days in 30 yrs
- 18 days/yr
Wind risk 2/10 · Minimal
- Chance of severe wind over 30 yrs
- —
Air-quality risk 2/10 · Minimal
- Unhealthy air days now
- 1 days/yr
- Unhealthy air days in 30 yrs
- 2 days/yr
Risk factors via First Street. Map © Google.
Why this score? — see what drove the B+ grade
The composite is a weighted blend of 9 inputs, each scored 0–100. Each bar is that input's sub-score; the figure is the points it added to the 100-point composite (weight × sub-score).
- Cash flow +30.0/30.0
- ARV discount +15.0/15.0
- 1% rule +10.0/10.0
- DSCR +10.0/10.0
- Schools +4.0/10.0
- Livability +3.1/5.0
- Rent growth +2.5/5.0
- Condition / age +2.5/5.0
- Appreciation +0.0/10.0
$78,000
🖨 Deal sheet (PDF) 📄 Offer letter ✓ Due diligence
Listing remarks MLS
Almost in the country, yet convenient to restaurants and shopping with easy access to I75 via 25A, this three bedroom, one bath home with laundry room and basement sits on a deep lot. Enjoy this quiet street from the front porch. Updated, open concept kitchen with concrete counter tops and stainless steel appliances. Beautiful original woodwork throughout. Open staircase and hardwood floors. Oversized two car garage with workshop area and opener. Spacious yard with privacy fence and fire pit. Low maintenance vinyl siding. Updates include: New roof, complete tear off 2019. Newer furnace, water heater, windows and electrical panel. Range, refrigerator, dishwasher, washer and dryer to remain. This beautiful, well-maintained home is move-in ready.
Key facts
- 6,534 sq ft lot
- Garage
- Built 1940
Neighborhood map
What this means for you Summary
Snapshot
- This is a 4-bed/1.0-bath single-family listed at $78k.
Deal economics
- At list price, monthly cash flow is $493 ($6k/yr) — positive.
- The deal already cash-flows at list — no discount required.
- Meets the 1% rule at list price ($1k rent vs $78k).
- Cap rate 13.9% vs local median 4.7% in Piqua — top-decile yield for the area; either an underpriced asset or a hidden risk that comps aren't pricing in. Stress-test before assuming the spread holds.
Location & tenants
- Location reads 62/100 on livability (#887 in OH) — a middle-class / working-renter tenant base. Strengths: cost of living A+, housing A+; Watch: employment D+, crime F, amenities F.
- Piqua City (rural): math 45% / reading 50% proficiency, ranked #482 of 656 in OH (top 74%) — families likely to look elsewhere, expect single-tenant / working-renter base with shorter leases.
- Market conditions: 138 active listings in the ZIP; 4 comparable units currently listed for rent nearby; rentals leasing fast (median 5d on market — plan ~1-2 weeks tenant-placement turnaround); 326 units permitted in Miami County in 2024 (0 in 5+ unit buildings).
Forward outlook
- Local home prices are declining (-3.0%/yr); year-one equity from $539 of loan paydown is wiped out by about $2k of value loss. Plan a longer hold.
- At projected returns (-3.0% appreciation + 3.0% rent growth), your $22k cash investment doubles in ~5 years — after that, you're playing with house money.
Negotiation context
- Only 9 days on market — expect competitive offers; lowballing is unlikely to land.
- 7 sale attempts since 14y ago with the ask held roughly flat each time — persistent listings suggest the price (not the market) is what's stuck; bring a comps-based counter.
Risks & watch-outs
- Watch-outs: property tax is 2.8% of price; built in 1940 — expect roof / HVAC / electrical / plumbing capex.
Questions for the listing agent
- Built in 1940 — when were the roof, HVAC, electrical panel, plumbing, and water heater last replaced?
- Property tax is high relative to price — has the assessment been appealed recently, and will the sale trigger a re-assessment?
- Is there a deadline driving the sale (1031 exchange, divorce, estate, relocation)? That informs how much negotiation room exists.
- Crime grade is F in this area — have there been break-ins, vandalism, or insurance claims at this property in the last 3 years? What carrier currently insures it and at what premium?
- What's the average days-on-market for RENTAL listings here right now (not sales)? A rising rental-DOM trend means longer vacancies and softer asking-rent achievability than the comps imply.
- What's the recent tenant-quality profile in this submarket — average credit score on applications, eviction rate, late-payment / NSF rate, and stable-employment percentage? A property-management company in the area should have these aggregated.
- How much new for-sale + rental construction is in the pipeline within 1–3 miles? Heavy new supply typically softens prices + rents 12–24 months out; constrained supply supports both.
Investment metrics
- 1% rule
- 1.81% ✓
- Cap rate
- 13.89%
- Cash-on-cash
- 27.11%
- DSCR
- 2.21
- GRM
- 4.6
CMA / ARV
- ARV (on-the-fly)
- $115,808
- Comps found
- 12
Show comp detail 12 sales within ~0.75 mi
| Address | Dist | Beds/Ba | Sqft | Sold | Price | $/sf | Match |
|---|---|---|---|---|---|---|---|
| 719 Fisk St | 0.36mi | 3/1.0 (-1) | 1,200 (-3%) | 5mo | $70,000 | $58 | 70 |
| 807 Brook St | 0.27mi | 3/1.0 (-1) | 1,160 (-6%) | 6mo | $65,000 | $56 | 68 |
| 420 Summit St | 0.37mi | 3/2.0 (-1) | 1,200 (-3%) | 7mo | $184,900 | $154 | 63 |
| 708 Brice Ave | 0.64mi | 3/1.0 (-1) | 1,254 (+2%) | 4mo | $68,571 | $55 | 59 |
| 736 S Wayne St | 0.40mi | 3/1.0 (-1) | 1,344 (+9%) | 5mo | $156,000 | $116 | 57 |
| 530 Kitt St | 0.67mi | 3/1.0 (-1) | 1,235 (+0%) | 9mo | $57,500 | $47 | 56 |
| 626 S Gordon St | 0.60mi | 3/2.0 (-1) | 1,313 (+7%) | 2mo | $182,000 | $139 | 51 |
| 605 Boal Ave | 0.61mi | 4/1.0 | 1,342 (+9%) | 7mo | $185,000 | $138 | 50 |
| 312 W Grant St | 0.67mi | 3/1.5 (-1) | 1,260 (+2%) | 11mo | $54,000 | $43 | 49 |
| 709 S Main St | 0.52mi | 3/1.0 (-1) | 1,118 (-9%) | 12mo | $51,500 | $46 | 46 |
| 1005 South St | 0.72mi | 3/1.0 (-1) | 1,378 (+12%) | 6mo | $130,000 | $94 | 36 |
| 431 S Roosevelt Ave | 0.68mi | 3/1.0 (-1) | 1,399 (+14%) | 5mo | $174,900 | $125 | 36 |
Match score weights: distance 35% · size 25% · config 20% · recency 20%. Top-matched comps best support the ARV.
Projected returns pro-forma
-3.0% appreciation · 3.0% rent growth · sell at horizon
- IRR
- 21.1%
- Equity multiple
- 1.86×
- Total profit
- $18,864
- Equity at exit
- $11,630
- IRR
- 29.3%
- Equity multiple
- 3.62×
- Total profit
- $57,195
- Equity at exit
- $6,744
Cash invested: $21,840 (down + closing). Projections, not guarantees.
Landlord ↔ Tenant lean methodology
- Overall (STATE)
- 73 Landlord-Friendly
- State Ohio
- 73 Landlord-Friendly · R+6
- County
- — inherits STATE
- City
- — inherits STATE
ZIP-level market 45356
- Active inventory
- 138
- Price-to-rent
- 4.6×
Monthly cashflow live
- Estimated rent
- $1,413 medium interval (Pro) →
- Mortgage (P&I)
- −$409
- Tax from tax record
- −$182 /mo · $2,178/yr
- Insurance
- −$32
- HOA
- −$0
- Vacancy / Maint / Mgmt
- −$297
- Net cashflow
- $493
Break-even live
Sensitivity live
| Price | -10% $538 | -5% $516 | +0% $493 | +5% $471 | +10% $449 |
|---|---|---|---|---|---|
| Rent | -10% $382 | -5% $438 | +0% $493 | +5% $549 | +10% $605 |
| Rate | -1.0pp $533 | -0.5pp $513 | base $493 | +0.5pp $473 | +1.0pp $453 |
UW: 25.0% down · 7.5% · 30yr · 1.5% tax · 5.0% vac · 8.0% maint · 8.0% mgmt
Financing live
Cash to close
- Down payment
- $19,500
- Closing costs
- $2,340
- Reserves months
- —
- Total cash needed
- —
Loan-product check · same deal, 3 products live
Conventional
25% down · 7.5% · 30yr
- Down + closing
- —
- Monthly P&I
- —
- Monthly cashflow
- —
- DSCR
- —
- Eligible?
- —
Personal DTI + credit; lowest rate.
DSCR
20% down · 8.5% · 30yr
- Down + closing
- —
- Monthly P&I
- —
- Monthly cashflow
- —
- DSCR
- —
- Eligible?
- —
No personal income docs; deal must DSCR.
Hard money
10% down · 12.0% · 12mo
- Down + closing
- —
- Monthly P&I
- —
- Monthly cashflow
- —
- DSCR
- —
- Eligible?
- —
Short-term bridge; refi at stabilization.
Rent comps 4 comps
| Address | Beds | Baths | Sqft | Rent | $/sqft | DOM | Units | Dist |
|---|---|---|---|---|---|---|---|---|
| 764 S Wayne St Piqua, OH | 3.0 | 1.0 | 1203 | $1,300 | $1.08 | 45d | 1 | 0.38mi |
| 717 S Downing St Piqua, OH | 3.0 | 1.0 | 1212 | $1,100 | $0.91 | 3d | 1 | 0.45mi |
| 200 E High St Piqua, OH | 3.0 | 1.0 | 1500 | $1,365 | $0.91 | 4d | 1 | 1.21mi |
| 715 Walker St Piqua, OH | 3.0 | 2.0 | 1100 | $1,650 | $1.50 | 4d | 1 | 1.50mi |
Listing history 25 events
-
2024-06-25soldstatus $135,000
-
2023-07-17soldstatus $89,000
-
2023-05-31historical
-
2023-05-31status Pending
-
2023-05-31status Pending
-
2023-05-22$78,000 Active
-
2023-05-22$78,000 Active
-
2020-12-14soldstatus $99,900
-
2020-12-10soldstatus $99,900 765-char remark
Show marketing remark (765 chars)
Almost in the country, yet convenient to restaurants and shopping with easy access to I75 via 25A, this three bedroom, one bath home with laundry room and basement sits on a deep lot. Enjoy this quiet street from the front porch. Updated, open concept kitchen with concrete counter tops and stainless steel appliances. Beautiful original woodwork throughout. Open staircase and hardwood floors. Oversized two car garage with workshop area and opener. Spacious yard with privacy fence and fire pit. Low maintenance vinyl siding. Updates include: New roof, complete tear off 2019. Newer furnace, water heater, windows and electrical panel. Range, refrigerator, dishwasher, washer and dryer to remain. This beautiful, well-maintained home is move-in ready.
-
2020-11-09$99,900 765-char remark
Show marketing remark (765 chars)
Almost in the country, yet convenient to restaurants and shopping with easy access to I75 via 25A, this three bedroom, one bath home with laundry room and basement sits on a deep lot. Enjoy this quiet street from the front porch. Updated, open concept kitchen with concrete counter tops and stainless steel appliances. Beautiful original woodwork throughout. Open staircase and hardwood floors. Oversized two car garage with workshop area and opener. Spacious yard with privacy fence and fire pit. Low maintenance vinyl siding. Updates include: New roof, complete tear off 2019. Newer furnace, water heater, windows and electrical panel. Range, refrigerator, dishwasher, washer and dryer to remain. This beautiful, well-maintained home is move-in ready.
-
2016-06-27soldstatus $69,000 Sold
-
2016-06-27soldstatus $69,000
-
2016-06-24soldstatus $69,000 Closed
-
2016-06-24soldstatus $69,000
-
2016-04-14status Pending
-
2016-03-31price $73,900
-
2015-10-02$79,900 Active
-
2015-10-01$73,900
-
2012-09-29historical
-
2012-09-28historical
-
2012-03-26$75,000
-
2012-03-26$75,000
-
1992-01-03soldstatus $31,000
-
1988-05-19soldstatus $22,000
-
1985-07-30soldstatus $28,000
ⓘ Source: listings_history table (triggers on properties + properties_extension) + one-shot
backfill from property_details.listing_events for pre-trigger history.
Tax reassessment forecast OH · Partial reset (capped growth)
- Current annual tax
- $2,178 · $182/mo
- Projected year-2 tax
- $2,178 · $182/mo
- Expected delta
- $0/yr ($0/mo · 0.0%)
ⓘ Screening estimate from a state-policy table — verify with the county assessor before closing.
Climate risk First Street
- Flood 1/10 Low FEMA zone X (unshaded) · 0% chance over 30 yrs
- Wildfire 1/10 Low
- Heat 3/10 Moderate 7 d/yr ≥100°F today · 18 d/yr by 30 yrs out
- Wind 2/10 Low
- Air quality 2/10 Low 1 unhealthy d/yr today · 2 by 30 yrs out
Nearby sold comps map
Loading sold comps map…
Walkable amenities ~0.75 mi
Loading nearby amenities…
Taxation est. · year 1
- Rental income
- $16,961
- − Mortgage interest
- −$4,369
- − Property taxes
- −$2,178
- − Insurance
- −$390
- − Repairs & maintenance
- −$1,357
- − Management
- −$1,357
- − Depreciation
- −$2,269
- Taxable income
- $5,040
- Est. tax owed @ 24.0%
- −$1,210
- After-tax cash flow
- $4,712/yr
For passive investors: Depreciation is non-cash, so a rental often shows a tax loss while cash-flowing — sheltering income. Rental losses are passive: they offset passive income freely, and up to $25,000/yr can offset ordinary (W-2) income if you actively participate and your MAGI is under $100k (phasing out to $0 by $150k); unused losses carry forward. On sale, claimed depreciation is recaptured at up to 25%, and gains may owe capital-gains tax (a 1031 exchange can defer both). Figures are a year-1 estimate at your 24.0% rate — not tax advice; consult a CPA.
Schools (NCES district)
- District
- Piqua City
- NCES district ID
- 3904464
- Math proficiency
- 45% ▼ -11.00%
- Reading proficiency
- 50% ▼ -7.00%
- Median HH income
- $41,751
- Composite
- 39.91/100
- National rank
- #3855
- State rank
- #482 of 656 in OH
Livability — Piqua
- Score
- 62/100
- State rank
- #887
- US rank
- #16830
Category grades
Schools grade is shown separately in the Schools card above.
Census & demographics
- Census place
- Piqua, OH
- County
- Miami County · 85,667 people
- City population
- 25,237
- Metro
- Dayton-Kettering, OH
- Population (ZIP)
- 25,237
- Household income
- $69,188
- Rent vs Own
- Severe rent burden
- 748.0
Population outlook (Miami County) Hauer SSP2
- Today (2025)
- 107,816 people
- By 2030
- 108,896 · +1.0%
- By 2040
- 109,581 · +1.6%
- By 2050
- 108,110 · +0.3%
- By 2075
- 101,523 · -5.8%
- By 2100
- 85,787 · -20.4%
Race, ethnicity, and origin ACS 2023
- Neighborhood character
- Predominantly White (92%)
- Race & ethnicity
- White 92% Two or more races 3% Black 2% Hispanic / Latino 1%
- Common ancestry
- Iranian 2% Italian 2% Lithuanian 2%
- Foreign-born
- 1%
- Languages at home
- 99% English-only · Spanish 1% Vietnamese 0%
Political lean MEDSL · Miami
- 2024 margin
- Solid R (+45.1) · D 27.0% · R 72.1%
- 2008→2024 swing
- -16.6pp toward R · 2008: -28.5pp · 2024: -45.1pp
- All cycles
- 2024: R+45.1 2020: R+44.3 2016: R+45.6 2012: R+35.6 2008: R+28.5
Not yet ingested
- Civics
- —
Market trends
- HPI YoY
- ▼ -137.96%
- Current HPI
- 251.435
- Rent YoY
- —
- Metro
- Dayton-Kettering, OH
- State GDP YoY
- ▲ 1.98%
- F500 in state
- 48
Industry mix (Fortune 500 HQ in OH)
| Industry | F500 HQs | Revenue |
|---|---|---|
| Insurance | 3 | $145B |
|
||
| Industrial Machinery | 3 | $49B |
|
||
| Financial Services | 3 | $24B |
|
||
| Consumer Goods | 2 | $93B |
|
||
| Aerospace / Defense | 2 | $47B |
|
||
| Utilities | 2 | $33B |
|
||
Price history
+382.1% since first listed25 events — show timeline
- 2024-06-25 Sold (Public Records) $135,000 Public Records
- 2023-07-17 Sold (Public Records) $89,000 Public Records
- 2023-05-31 Listing Removed — Dayton MLS
- 2023-05-31 Pending — WRIST
- 2023-05-31 Pending — Dayton MLS
- 2023-05-22 Listed $78,000 WRIST
- 2023-05-22 Listed $78,000 Dayton MLS
- 2020-12-14 Sold (Public Records) $99,900 Public Records
- 2020-12-10 Sold (MLS) $99,900 WRIST
- 2020-11-09 Listed $99,900 WRIST
- 2016-06-27 Sold (MLS) $69,000 Dayton MLS
- 2016-06-27 Sold (Public Records) $69,000 Public Records
- 2016-06-24 Sold (MLS) $69,000 WRIST
- 2016-06-24 Sold (MLS) $69,000 Dayton MLS
- 2016-04-14 Pending — Dayton MLS
- 2016-03-31 Price Changed $73,900 Dayton MLS
- 2015-10-02 Listed $79,900 Dayton MLS
- 2015-10-01 Listed $73,900 WRIST
- 2012-09-29 Listing Removed — WRIST
- 2012-09-28 Listing Removed — Dayton MLS
- 2012-03-26 Listed $75,000 WRIST
- 2012-03-26 Listed $75,000 Dayton MLS
- 1992-01-03 Sold (Public Records) $31,000 Public Records
- 1988-05-19 Sold (Public Records) $22,000 Public Records
- 1985-07-30 Sold (Public Records) $28,000 Public Records
Property tax history
+6.3%/yrLatest (2025): $2,178 · +255.4% YoY. Source: county tax records.
Cash-flow waterfall
monthlySold comps — $/sqft
last 12 mo · ≤1 miLoading sold comps…