41 Anna Marie Terr. Plan · Cheektowaga, NY
Flood risk No data
- FEMA flood zone
- —
- Chance of flooding over 30 yrs
- —
- Est. flood insurance / yr
- —
Fire risk No data
- Est. fire insurance / yr
- —
Heat risk No data
- Hot days now (above threshold)
- —
- Hot days in 30 yrs
- —
Wind risk No data
- Chance of severe wind over 30 yrs
- —
Air-quality risk No data
- Unhealthy air days now
- —
- Unhealthy air days in 30 yrs
- —
Risk factors via First Street. Map © Google.
Why this score? — see what drove the B grade
The composite is a weighted blend of 9 inputs, each scored 0–100. Each bar is that input's sub-score; the figure is the points it added to the 100-point composite (weight × sub-score).
- Cash flow +29.0/30.0
- DSCR +10.0/10.0
- 1% rule +8.1/10.0
- ARV discount +7.5/15.0
- Schools +5.2/10.0
- Condition / age +5.0/5.0
- Livability +4.2/5.0
- Rent growth +2.5/5.0
- Appreciation +0.0/10.0
$130,995
🖨 Deal sheet 📄 Offer letter ✓ Due diligence
Listing remarks MLS
Charming 3 bedroom, 2 bathroom home located in Sky Harbor with wooded back yard. Everything is brand new!! Financing available!
Key facts
- Wooded back yard
- Listed 203 days
Tags
Neighborhood map
What this means for you Summary
Snapshot
- This is a 3-bed/2.0-bath manufactured listed at $131k. Condition is rated excellent.
Deal economics
- At list price, monthly cash flow is $449 ($5k/yr) — positive.
- The deal already cash-flows at list — no discount required.
- Meets the 1% rule at list price ($2k rent vs $131k).
- Recommended offer: $115k (12.0% below list) — sets the bar for market timing.
- Cap rate 10.4% vs local median 3.8% in Cheektowaga — top-decile yield for the area; either an underpriced asset or a hidden risk that comps aren't pricing in. Stress-test before assuming the spread holds.
Location & tenants
- Location reads 84/100 on livability (#54 in NY, #811 nationally) — a professional / high-income tenant draw. Strengths: commute A+, housing A+, health & safety A+; Watch: crime C-.
- Lancaster Central School District (suburban): math 57% / reading 61% proficiency, ranked #234 of 590 in NY (top 40%) — acceptable for families but not a draw, mixed tenant base, ~2y average lease; only 14% free/reduced lunch — higher-income household profile.
- Market conditions: 207 active listings in the ZIP; 2 comparable units currently listed for rent nearby; 1,244 units permitted in Erie County in 2024 (563 in 5+ unit buildings).
- This rent runs 31% of the median local income ($67k/yr) — at the standard rent-burdened threshold; future hikes will face affordability resistance.
Forward outlook
- Local home prices are declining (-3.0%/yr); year-one equity from $905 of loan paydown is wiped out by about $4k of value loss. Plan a longer hold.
- At projected returns (-3.0% appreciation + 3.0% rent growth), your $37k cash investment doubles in ~8 years — after that, you're playing with house money.
Negotiation context
- It's been on market 203 days — a 12% lower offer ($115k) is reasonable based on typical stale-listing flexibility.
Questions for the listing agent
- It's been on market 203 days. Have you received any prior offers? Is the seller open to a 12% concession, seller financing, or rate buy-down credit?
- Why hasn't it sold? Are there any deal-killer items the seller is aware of (foundation, flood, title, zoning, code violations)?
- Is there a deadline driving the sale (1031 exchange, divorce, estate, relocation)? That informs how much negotiation room exists.
- Schools are B-rated — typically a magnet for longer-tenancy family renters. What's the average tenant stay here, and is there a school-zone premium baked into asking?
- What's the average days-on-market for RENTAL listings here right now (not sales)? A rising rental-DOM trend means longer vacancies and softer asking-rent achievability than the comps imply.
- What's the recent tenant-quality profile in this submarket — average credit score on applications, eviction rate, late-payment / NSF rate, and stable-employment percentage? A property-management company in the area should have these aggregated.
- How much new for-sale + rental construction is in the pipeline within 1–3 miles? Heavy new supply typically softens prices + rents 12–24 months out; constrained supply supports both.
Investment metrics
- 1% rule
- 1.31% ✓
- Cap rate
- 10.41%
- Cash-on-cash
- 14.69%
- DSCR
- 1.65
- GRM
- 6.4
CMA / ARV
- ARV (median comp)
- $47,099
- List price
- $130,995
- Delta
- 178.12%
- Verdict
- OVERPRICED
- Comps
- 4 within 1.0 mi
Show comp detail 5 sales within ~0.75 mi
| Address | Dist | Beds/Ba | Sqft | Sold | Price | $/sf | Match |
|---|---|---|---|---|---|---|---|
| 1 Laurel Run | 0.33mi | 2/2.0 (-1) | 1,088 (-3%) | 8mo | $67,500 | $62 | 69 |
| 26 Harmony Ln | 0.16mi | 2/1.0 (-1) | 1,152 (+3%) | 18mo | $49,500 | $43 | 64 |
| 38 Harmony Ln | 0.21mi | 2/2.0 (-1) | 980 (-12%) | 5mo | $28,000 | $29 | 60 |
| 69 Melody Ln | 0.39mi | 2/2.0 (-1) | 980 (-12%) | 18mo | $45,000 | $46 | 41 |
| 82 Jenny Ln | 0.33mi | 2/1.0 (-1) | 980 (-12%) | 22mo | $32,500 | $33 | 36 |
Match score weights: distance 35% · size 25% · config 20% · recency 20%. Top-matched comps best support the ARV.
Projected returns pro-forma
-3.0% appreciation · 3.0% rent growth · sell at horizon
- IRR
- 5.2%
- Equity multiple
- 1.20×
- Total profit
- $7,399
- Equity at exit
- $19,532
- IRR
- 14.6%
- Equity multiple
- 2.18×
- Total profit
- $43,376
- Equity at exit
- $11,326
Cash invested: $36,679 (down + closing). Projections, not guarantees.
Landlord ↔ Tenant lean methodology
- Overall (STATE)
- 15 Strongly Tenant-Friendly
- State New York
- 15 Strongly Tenant-Friendly · D+10
- County
- — inherits STATE
- City
- — inherits STATE
ZIP-level market 14225
- Home prices YoY
- -27.3%
- Active inventory
- 207
- Price-to-rent
- 6.4×
Monthly cashflow live
- Estimated rent
- $1,714 medium interval (Pro) →
- Mortgage (P&I)
- −$687
- Tax est. 1.5%
- −$164 /mo · $1,965/yr
- Insurance
- −$55
- HOA
- −$0
- Vacancy / Maint / Mgmt
- −$360
- Net cashflow
- $449
Break-even live
UW: 25.0% down · 7.5% · 30yr · 1.5% tax · 5.0% vac · 8.0% maint · 8.0% mgmt
Financing live
Cash to close
- Down payment
- $32,749
- Closing costs
- $3,930
- Reserves months
- —
- Total cash needed
- —
Loan-product check · same deal, 3 products live
Conventional
25% down · 7.5% · 30yr
- Down + closing
- —
- Monthly P&I
- —
- Monthly cashflow
- —
- DSCR
- —
- Eligible?
- —
Personal DTI + credit; lowest rate.
DSCR
20% down · 8.5% · 30yr
- Down + closing
- —
- Monthly P&I
- —
- Monthly cashflow
- —
- DSCR
- —
- Eligible?
- —
No personal income docs; deal must DSCR.
Hard money
10% down · 12.0% · 12mo
- Down + closing
- —
- Monthly P&I
- —
- Monthly cashflow
- —
- DSCR
- —
- Eligible?
- —
Short-term bridge; refi at stabilization.
Rent comps 2 comps
| Address | Beds | Baths | Sqft | Rent | $/sqft | DOM | Units | Dist |
|---|---|---|---|---|---|---|---|---|
| 4925 Genesee St Cheektowaga, NY | 1.0–2.0 | 1.0 | 680 | $1,399 | $2.06 | 19d | 1 | 0.10mi |
| 6386 Transit Rd Depew, NY | 1.0–2.0 | 1.0–2.0 | 1023 | $2,397 | $2.34 | 1d | 62 | 0.48mi |
Listing history 15 events
-
2026-06-18days on market $130,995 Active 203 DOM
-
2026-06-17days on market $130,995 Active 202 DOM
-
2026-06-16days on market $130,995 Active 201 DOM
-
2026-06-15days on market $130,995 Active 200 DOM
-
2026-06-13days on market $130,995 Active 198 DOM
-
2026-06-13days on market $130,995 Active 197 DOM
-
2026-06-10days on market $130,995 Active 195 DOM
-
2026-06-09days on market $130,995 Active 194 DOM
-
2026-06-08days on market $130,995 Active 193 DOM
-
2026-06-07days on market $130,995 Active 192 DOM
-
2026-06-03days on market $130,995 Active 188 DOM
-
2026-06-02days on market $130,995 Active 187 DOM
-
2026-06-01days on market $130,995 Active 186 DOM
-
2026-05-31days on market $130,995 Active 185 DOM
-
2025-11-27$130,995 Active 127-char remark
Show marketing remark (127 chars)
Charming 3 bedroom, 2 bathroom home located in Sky Harbor with wooded back yard. Everything is brand new!! Financing available!
ⓘ Source: listings_history table (triggers on properties + properties_extension) + one-shot
backfill from property_details.listing_events for pre-trigger history.
Nearby sold comps map
Loading sold comps map…
Walkable amenities ~0.75 mi
Loading nearby amenities…
Taxation est. · year 1
- Rental income
- $20,572
- − Mortgage interest
- −$7,338
- − Property taxes
- −$1,965
- − Insurance
- −$655
- − Repairs & maintenance
- −$1,646
- − Management
- −$1,646
- − Depreciation
- −$3,811
- Taxable income
- $3,512
- Est. tax owed @ 24.0%
- −$843
- After-tax cash flow
- $4,546/yr
For passive investors: Depreciation is non-cash, so a rental often shows a tax loss while cash-flowing — sheltering income. Rental losses are passive: they offset passive income freely, and up to $25,000/yr can offset ordinary (W-2) income if you actively participate and your MAGI is under $100k (phasing out to $0 by $150k); unused losses carry forward. On sale, claimed depreciation is recaptured at up to 25%, and gains may owe capital-gains tax (a 1031 exchange can defer both). Figures are a year-1 estimate at your 24.0% rate — not tax advice; consult a CPA.
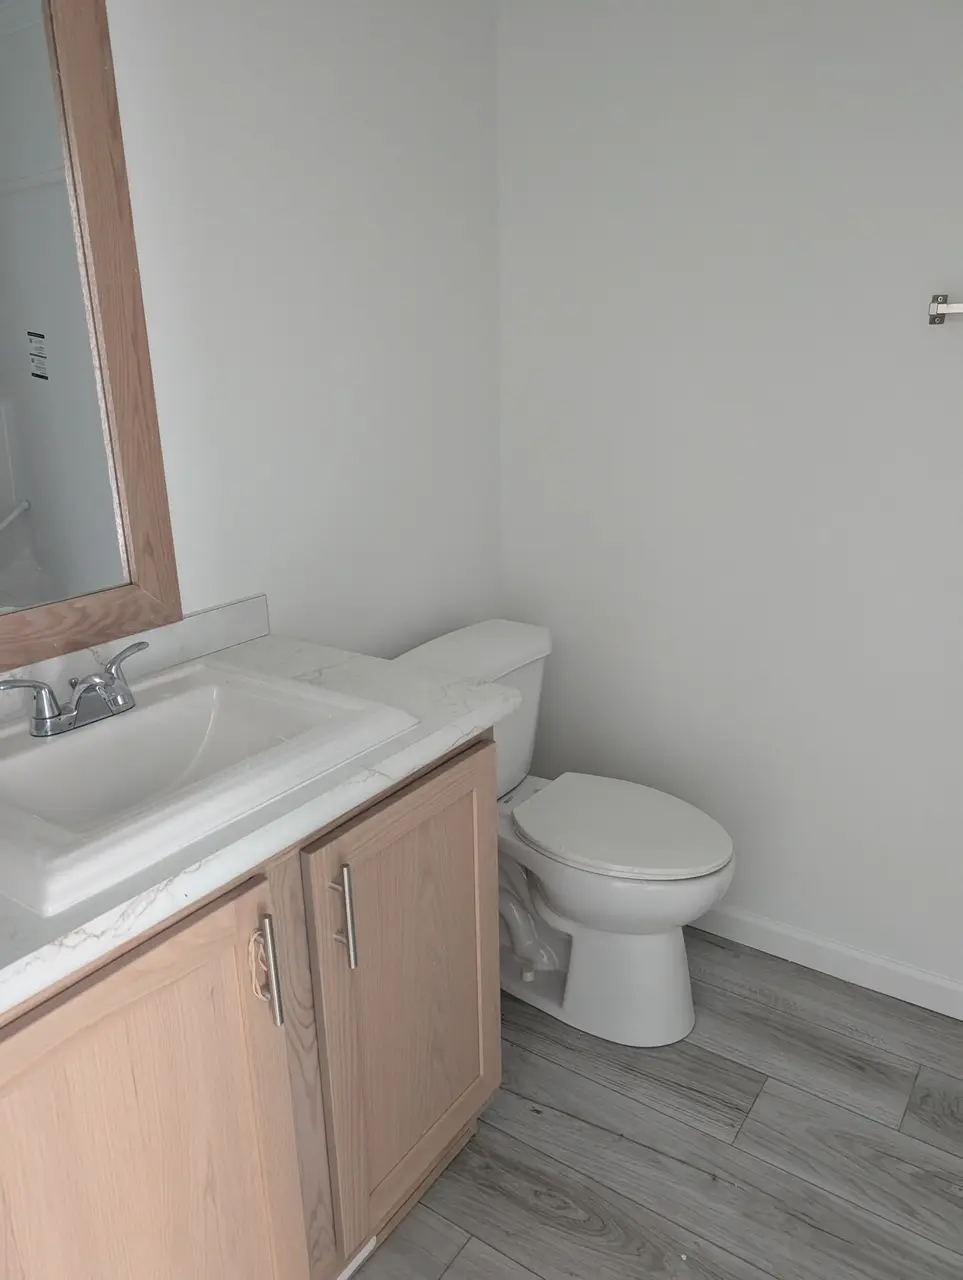
Condition & rehab AI · 3 photos
This manufactured home is in excellent condition with a modern kitchen and bathroom. It is move-in ready and has the potential for minor exterior improvements to further enhance its value.
Value-add opportunities
- Both Painting the exterior — Fresh paint can enhance curb appeal and property value
- Both Landscaping the front yard — A well-maintained front yard can improve curb appeal and attract potential buyers
- Both Adding a small outdoor seating area — This can increase the appeal of the property and provide additional living space
Renovation cost estimate screening
Value-add ROI direction
- Both Painting the exterior — Fresh paint can enhance curb appeal and property value ↑
- Both Landscaping the front yard — A well-maintained front yard can improve curb appeal and attract potential buyers ↑
- Both Adding a small outdoor seating area — This can increase the appeal of the property and provide additional living space ↑
ⓘ Cost ranges are severity-bucket heuristics (US national rule-of-thumb). Get contractor quotes + a written scope before underwriting a rehab budget.
Schools (NCES district)
- District
- Lancaster Central School District
- NCES district ID
- 3616680
- Math proficiency
- 57% ▼ -13.00%
- Reading proficiency
- 61% ▲ 2.00%
- Median HH income
- $64,668
- Composite
- 51.64/100
- National rank
- #1700
- State rank
- #234 of 590 in NY
Livability — Cheektowaga
- Score
- 84/100
- State rank
- #54
- US rank
- #811
Category grades
Schools grade is shown separately in the Schools card above.
Census & demographics
- Census place
- Cheektowaga, NY
- County
- Erie County · 714,559 people
- City population
- 55,470
- Metro
- Buffalo-Cheektowaga, NY
- Population (ZIP)
- 33,620
- Household income
- $67,237
- Rent vs Own
- Severe rent burden
- 991.0
Population outlook (Erie County) Hauer SSP2
- Today (2025)
- 933,037 people
- By 2030
- 935,181 · +0.2%
- By 2040
- 928,531 · -0.5%
- By 2050
- 905,725 · -2.9%
- By 2075
- 834,037 · -10.6%
- By 2100
- 708,033 · -24.1%
Race, ethnicity, and origin ACS 2023
- Neighborhood character
- Predominantly White (74%)
- Race & ethnicity
- White 74% Black 13% Two or more races 7% Hispanic / Latino 4% Asian 3%
- Common ancestry
- Romanian 21% Lithuanian 3% Iranian 1%
- Foreign-born
- 6% · Canada, Vietnam
- Languages at home
- 92% English-only · Other Indo-European 2% Spanish 2% Arabic 1%
Political lean MEDSL · Erie
- 2024 margin
- Lean D (+9.7) · D 54.8% · R 45.2%
- 2008→2024 swing
- -7.9pp toward R · 2008: 17.5pp · 2024: 9.7pp
- All cycles
- 2024: D+9.7 2020: D+14.7 2016: D+4.8 2012: D+15.6 2008: D+17.5
Not yet ingested
- Civics
- —
Market trends
- HPI YoY
- ▼ -120.26%
- Current HPI
- 320.6248
- Rent YoY
- —
- Metro
- Buffalo-Cheektowaga, NY
- State GDP YoY
- ▲ 2.60%
- F500 in state
- 92
Industry mix (Fortune 500 HQ in NY)
| Industry | F500 HQs | Revenue |
|---|---|---|
| Financial Services | 10 | $950B |
|
||
| Consumer Goods | 9 | $162B |
|
||
| Insurance | 4 | $225B |
|
||
| Telecommunications | 2 | $144B |
|
||
| Pharmaceuticals | 2 | $112B |
|
||
| Media / Entertainment | 2 | $69B |
|
||
Price history
1 event — show timeline
- 2025-11-27 Listed $130,995 Zillow
Cash-flow waterfall
monthlySold comps — $/sqft
last 12 mo · ≤1 miLoading sold comps…