 🏗️ New Construction
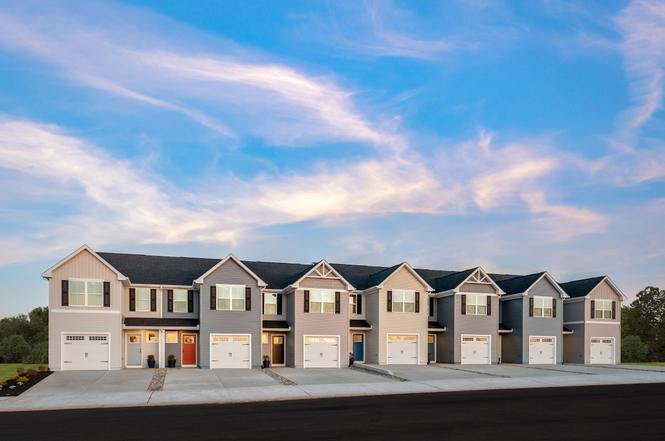
Poplar End Unit Plan · Bolivia, NC
Flood risk No data
- FEMA flood zone
- —
- Chance of flooding over 30 yrs
- —
- Est. flood insurance / yr
- —
Fire risk No data
- Est. fire insurance / yr
- —
Heat risk No data
- Hot days now (above threshold)
- —
- Hot days in 30 yrs
- —
Wind risk No data
- Chance of severe wind over 30 yrs
- —
Air-quality risk No data
- Unhealthy air days now
- —
- Unhealthy air days in 30 yrs
- —
Risk factors via First Street. Map © Google.
Why this score? — see what drove the D grade
The composite is a weighted blend of 9 inputs, each scored 0–100. Each bar is that input's sub-score; the figure is the points it added to the 100-point composite (weight × sub-score).
- Cash flow +10.4/30.0
- ARV discount +7.5/15.0
- Appreciation +5.6/10.0
- Schools +3.9/10.0
- 1% rule +3.1/10.0
- DSCR +3.0/10.0
- Livability +3.0/5.0
- Rent growth +2.5/5.0
- Condition / age +2.5/5.0
$234,990
🖨 Deal sheet (PDF) 📄 Offer letter ✓ Due diligence
Listing remarks
Feel tucked away from the hustle while staying minutes from Wilmington and Leland at Bell Creek Townhomes-where everyday living feels easy, connected, and low-maintenance. Step inside our Poplar End Unit from your covered porch or attached garage and into a welcoming foyer-ideal for a drop zone or organized entry space. The main level opens up to a bright, airy layout where the great room flows effortlessly into the kitchen and dining area, creating a natural space for gathering, entertaining, or relaxed nights at home. An optional island adds extra prep space and storage, making the kitchen as functional as it is inviting. Upstairs, flexibility continues with two spacious secondary bedroom
Key facts
- Gourmet kitchen
- Dual vanity bath
- Parking
Tags
Property features AI
Finance
- Other: Listing status: Active
- Financial info: List price $234,990
Exterior
- Parking: 1 parking space
- Utilities: Central air conditioning
- Home design: End unit, plan named Poplar End Unit; New construction plan
- Exterior features: Living area of approximately 1442 (unit of measure not shown)
Interior
- Bedrooms: 3 bedrooms
- Bathrooms: 2 full bathrooms
- Heating & cooling: Central air conditioning
- Interior features: Central air conditioning
Neighborhood map
What this means for you Summary
Snapshot
- This is a 3-bed/2.0-bath townhouse listed at $235k.
Deal economics
- At list price, monthly cash flow is $-126 ($-2k/yr) — negative.
- To cash-flow at today's rent, offer at most $221k (5.9% below list).
- To meet the 1% rule (rent ≥ 1% of price), the offer needs to be $193k (17.7% below list).
- Recommended offer: $193k (17.7% below list) — sets the bar for 1% rule.
- Cap rate 5.7% vs local median 4.5% in Bolivia — meaningfully above typical; check what's discounted (condition, days-on-market, listing class) to confirm the premium yield is real.
Location & tenants
- Location reads 59/100 on livability (#549 in NC) — a working-class tenant base; expect higher turnover. Strengths: health & safety A+, cost of living B; Watch: amenities F, commute F, employment F.
- Brunswick County Schools (rural): math 45% / reading 47% proficiency, ranked #82 of 178 in NC (top 46%) — families likely to look elsewhere, expect single-tenant / working-renter base with shorter leases.
- Zoned schools: Bolivia Elementary (math 50% / reading 43%, grade D-, #542 of 1,410 statewide, top 39%, 496 students, 99% FRL); South Brunswick Middle (math 41% / reading 49%, grade D, #160 of 475 statewide, top 35%, 572 students, 100% FRL); South Brunswick High (math 62% / reading 57%, grade C+, #216 of 535 statewide, top 43%, 1,172 students, 100% FRL) — zoned schools average 100% FRL vs 53% district-wide (46 pts higher); higher-poverty schools than district average — tighter screening recommended.
- Market conditions: 191 active listings in the ZIP; 6,112 units permitted in Brunswick County in 2024 (990 in 5+ unit buildings).
Forward outlook
- In year one you build about $5k of equity ($2k loan paydown + $3k appreciation (1.2% local appreciation)).
- Brunswick County population projected at +36% by 2050 — long-run rental-demand tailwind backs the buy-and-hold thesis.
- By year 7, paydown + projected appreciation supports a ~$31k cash-out refi (75% LTV) — recoverable capital for the next deal without selling this one.
Negotiation context
- It's been on market 173 days — a 12% lower offer ($207k) is reasonable based on typical stale-listing flexibility.
Questions for the listing agent
- What do current leases actually rent for vs. the listed asking? Can we see a recent rent roll and the last 12 months of T-12 income?
- It's been on market 173 days. Have you received any prior offers? Is the seller open to a 18% concession, seller financing, or rate buy-down credit?
- Why hasn't it sold? Are there any deal-killer items the seller is aware of (foundation, flood, title, zoning, code violations)?
- Is there a deadline driving the sale (1031 exchange, divorce, estate, relocation)? That informs how much negotiation room exists.
- Schools are D-rated, which usually means shorter tenancies and higher turnover. Who's the typical renter profile here, and what's been the actual vacancy rate?
- The area grade is low — what's the realistic commute time and amenity access for the typical tenant pool here? Any planned neighborhood developments (good or bad) we should know about?
- What's the average days-on-market for RENTAL listings here right now (not sales)? A rising rental-DOM trend means longer vacancies and softer asking-rent achievability than the comps imply.
- What's the recent tenant-quality profile in this submarket — average credit score on applications, eviction rate, late-payment / NSF rate, and stable-employment percentage? A property-management company in the area should have these aggregated.
- How much new for-sale + rental construction is in the pipeline within 1–3 miles? Heavy new supply typically softens prices + rents 12–24 months out; constrained supply supports both.
Investment metrics
- 1% rule
- 0.81% ✗
- Cap rate
- 5.66%
- Cash-on-cash
- -2.26%
- DSCR
- 0.90
- GRM
- 10.3
CMA / ARV
- ARV (on-the-fly)
- $239,372
- Comps found
- 12
Show comp detail 12 sales within ~0.75 mi
| Address | Dist | Beds/Ba | Sqft | Sold | Price | $/sf | Match |
|---|---|---|---|---|---|---|---|
| 2028 Lewis Creek Cir NE | 0.06mi | 3/2.0 | 1,442 (0%) | 4mo | $219,990 | $153 | 94 |
| 2033 Lewis Creek Cir NE | 0.05mi | 3/2.0 | 1,442 (0%) | 6mo | $248,550 | $172 | 93 |
| 2044 Lewis Creek Cir NE | 0.05mi | 3/2.0 | 1,442 (0%) | 6mo | $252,295 | $175 | 93 |
| 2049 Lewis Creek Cir NE | 0.06mi | 3/2.0 | 1,442 (0%) | 6mo | $239,560 | $166 | 93 |
| 2053 Lewis Creek Cir NE | 0.07mi | 3/2.5 | 1,442 (0%) | 3mo | $242,990 | $169 | 92 |
| 2041 Lewis Creek Cir NE | 0.03mi | 3/2.5 | 1,442 (0%) | 6mo | $235,000 | $163 | 92 |
| 2036 Lewis Creek Cir NE | 0.07mi | 3/2.5 | 1,442 (0%) | 6mo | $231,470 | $161 | 90 |
| 2040 Lewis Creek Cir NE | 0.08mi | 3/2.0 | 1,442 (0%) | 7mo | $241,517 | $167 | 90 |
| 2045 Lewis Creek Cir NE | 0.09mi | 3/2.5 | 1,442 (0%) | 7mo | $231,065 | $160 | 88 |
| 2024 Lewis Creek Cir NE | 0.08mi | 3/2.5 | 1,442 (0%) | 8mo | $267,450 | $185 | 87 |
| 1581 Dusk Cv NE | 0.56mi | 3/3.0 | 1,652 (+15%) | 12mo | $220,000 | $133 | 36 |
| 1571 Dusk Cv NE | 0.57mi | 3/3.0 | 1,652 (+15%) | 11mo | $230,000 | $139 | 36 |
Match score weights: distance 35% · size 25% · config 20% · recency 20%. Top-matched comps best support the ARV.
Projected returns pro-forma
1.23% appreciation · 3.0% rent growth · sell at horizon
- IRR
- -0.2%
- Equity multiple
- 0.99×
- Total profit
- $-786
- Equity at exit
- $84,636
- IRR
- 4.5%
- Equity multiple
- 1.56×
- Total profit
- $37,449
- Equity at exit
- $114,765
Cash invested: $67,024 (down + closing). Projections, not guarantees.
Landlord ↔ Tenant lean methodology
- Overall (STATE)
- 85 Strongly Landlord-Friendly
- State North Carolina
- 85 Strongly Landlord-Friendly · R+3
- County
- — inherits STATE
- City
- — inherits STATE
ZIP-level market 28479
- Home prices YoY
- 0.8%
- Active inventory
- 191
- Price-to-rent
- 10.1×
Monthly cashflow live
- Estimated rent
- $1,934 medium interval (Pro) →
- Mortgage (P&I)
- −$1,255
- Tax est. 1.5%
- −$299 /mo · $3,591/yr
- Insurance
- −$100
- HOA
- −$0
- Vacancy / Maint / Mgmt
- −$406
- Net cashflow
- $-126
Break-even live
Sensitivity live
| Price | -10% $39 | -5% $-43 | +0% $-126 | +5% $-209 | +10% $-292 |
|---|---|---|---|---|---|
| Rent | -10% $-279 | -5% $-203 | +0% $-126 | +5% $-50 | +10% $27 |
| Rate | -1.0pp $-6 | -0.5pp $-65 | base $-126 | +0.5pp $-188 | +1.0pp $-251 |
UW: 25.0% down · 7.5% · 30yr · 1.5% tax · 5.0% vac · 8.0% maint · 8.0% mgmt
Financing live
Cash to close
- Down payment
- $59,843
- Closing costs
- $7,181
- Reserves months
- —
- Total cash needed
- —
Loan-product check · same deal, 3 products live
Conventional
25% down · 7.5% · 30yr
- Down + closing
- —
- Monthly P&I
- —
- Monthly cashflow
- —
- DSCR
- —
- Eligible?
- —
Personal DTI + credit; lowest rate.
DSCR
20% down · 8.5% · 30yr
- Down + closing
- —
- Monthly P&I
- —
- Monthly cashflow
- —
- DSCR
- —
- Eligible?
- —
No personal income docs; deal must DSCR.
Hard money
10% down · 12.0% · 12mo
- Down + closing
- —
- Monthly P&I
- —
- Monthly cashflow
- —
- DSCR
- —
- Eligible?
- —
Short-term bridge; refi at stabilization.
Listing history 16 events
-
2026-06-22days on market $234,990 Active 173 DOM
-
2026-06-18days on market $234,990 Active 170 DOM
-
2026-06-17days on market $234,990 Active 169 DOM
-
2026-06-16days on market $234,990 Active 168 DOM
-
2026-06-15days on market $234,990 Active 167 DOM
-
2026-06-14days on market $234,990 Active 165 DOM
-
2026-06-13days on market $234,990 Active 164 DOM
-
2026-06-10days on market $234,990 Active 162 DOM
-
2026-06-09days on market $234,990 Active 161 DOM
-
2026-06-08days on market $234,990 Active 160 DOM
-
2026-06-07days on market $234,990 Active 159 DOM
-
2026-06-05days on market $234,990 Active 156 DOM
-
2026-06-02days on market $234,990 Active 154 DOM
-
2026-06-01days on market $234,990 Active 153 DOM
-
2026-05-31days on market $234,990 Active 152 DOM
-
2026-05-30days on market $234,990 Active 151 DOM
ⓘ Source: listings_history table (triggers on properties + properties_extension) + one-shot
backfill from property_details.listing_events for pre-trigger history.
Nearby sold comps map
Loading sold comps map…
Walkable amenities ~0.75 mi
Loading nearby amenities…
Taxation est. · year 1
- Rental income
- $23,211
- − Mortgage interest
- −$13,409
- − Property taxes
- −$3,591
- − Insurance
- −$1,197
- − Repairs & maintenance
- −$1,857
- − Management
- −$1,857
- − Depreciation
- −$6,964
- Taxable loss
- −$5,662
- Est. tax savings @ 24.0%
- +$1,359
- After-tax cash flow
- $-155/yr
For passive investors: Depreciation is non-cash, so a rental often shows a tax loss while cash-flowing — sheltering income. Rental losses are passive: they offset passive income freely, and up to $25,000/yr can offset ordinary (W-2) income if you actively participate and your MAGI is under $100k (phasing out to $0 by $150k); unused losses carry forward. On sale, claimed depreciation is recaptured at up to 25%, and gains may owe capital-gains tax (a 1031 exchange can defer both). Figures are a year-1 estimate at your 24.0% rate — not tax advice; consult a CPA.
Schools (NCES district)
- District
- Brunswick County Schools
- NCES district ID
- 3700420
- Math proficiency
- 45% ▲ 4.00%
- Reading proficiency
- 47% ▲ 4.00%
- Median HH income
- $47,494
- Composite
- 39.23/100
- National rank
- #4011
- State rank
- #82 of 178 in NC
Livability — Bolivia
- Score
- 59/100
- State rank
- #549
- US rank
- #20206
Category grades
Schools grade is shown separately in the Schools card above.
Census & demographics
- City population
- 10,059
- Population (ZIP)
- 6,971
Population outlook (Brunswick County) Hauer SSP2
- Today (2025)
- 152,111 people
- By 2030
- 165,705 · +8.9%
- By 2040
- 188,494 · +23.9%
- By 2050
- 206,228 · +35.6%
- By 2075
- 237,876 · +56.4%
- By 2100
- 251,451 · +65.3%
Race, ethnicity, and origin ACS 2023
- Neighborhood character
- Predominantly White (72%)
- Race & ethnicity
- White 72% Black 13% Two or more races 13% Hispanic / Latino 3%
- Common ancestry
- Serbian 2% Slovak 2% Italian 2%
- Foreign-born
- 0%
- Languages at home
- 97% English-only · Spanish 3%
Political lean MEDSL · Brunswick
- 2024 margin
- Strong R (+24.9) · D 37.2% · R 62.0%
- 2008→2024 swing
- -6.9pp toward R · 2008: -17.9pp · 2024: -24.9pp
- All cycles
- 2024: R+24.9 2020: R+25.0 2016: R+28.7 2012: R+22.2 2008: R+17.9
Not yet ingested
- Civics
- —
Market trends
- HPI YoY
- ▲ 1.23%
- Current HPI
- 159.4516
- Rent YoY
- —
- Metro
- —
- State GDP YoY
- ▲ 3.28%
- F500 in state
- 26
Industry mix (Fortune 500 HQ in NC)
| Industry | F500 HQs | Revenue |
|---|---|---|
| Financial Services | 2 | $213B |
|
||
| Retail | 2 | $95B |
|
||
| Industrial Conglomerate | 1 | $38B |
|
||
| Metals / Steel | 1 | $35B |
|
||
| Utilities | 1 | $30B |
|
||
| Industrial Machinery | 1 | $19B |
|
||
Cash-flow waterfall
monthlySold comps — $/sqft
last 12 mo · ≤1 miLoading sold comps…