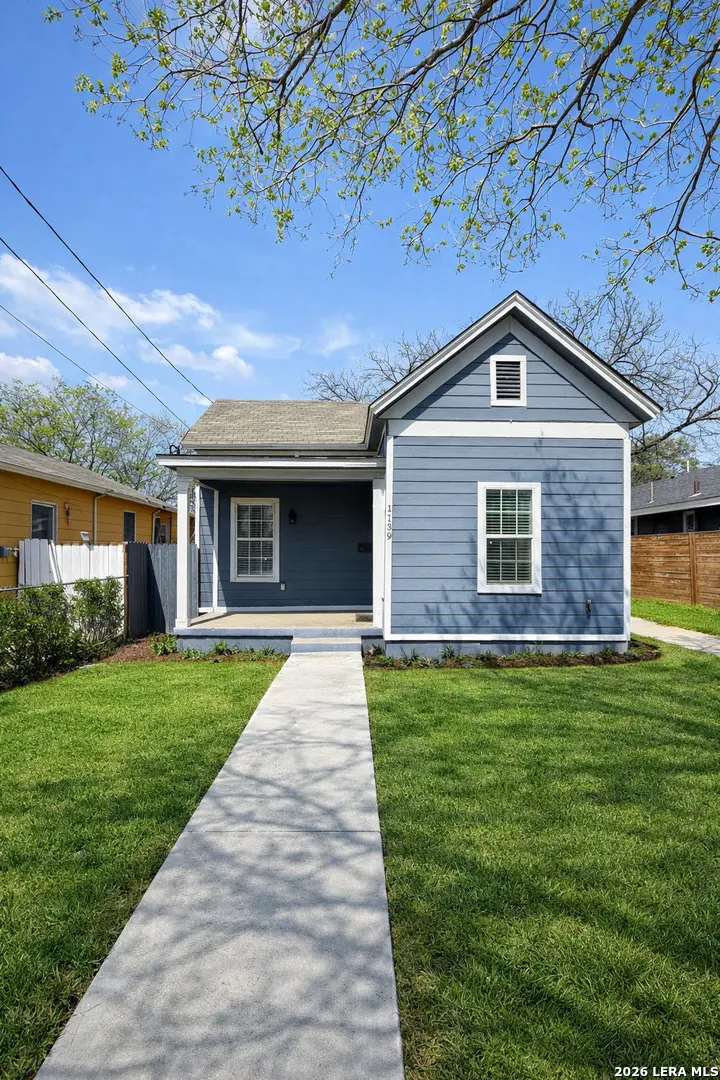
1139 Morales · San Antonio, TX
Flood risk 1/10 · Minimal
- FEMA flood zone
- X (unshaded)
- Chance of flooding over 30 yrs
- 0.0%
- Est. flood insurance / yr
- $507 – $1,088
Fire risk 1/10 · Minimal
- Est. fire insurance / yr
- $1,222 – $2,270
Heat risk 8/10 · Major
- Hot days now (above 108°F)
- 7 days/yr
- Hot days in 30 yrs
- 21 days/yr
Wind risk 6/10 · Moderate
- Chance of severe wind over 30 yrs
- 77.0%
Air-quality risk 2/10 · Minimal
- Unhealthy air days now
- 1 days/yr
- Unhealthy air days in 30 yrs
- 2 days/yr
Risk factors via First Street. Map © Google.
Why this score? — see what drove the D grade
The composite is a weighted blend of 9 inputs, each scored 0–100. Each bar is that input's sub-score; the figure is the points it added to the 100-point composite (weight × sub-score).
- Appreciation +10.0/10.0
- ARV discount +9.8/15.0
- Cash flow +7.3/30.0
- Rent growth +4.4/5.0
- Livability +4.0/5.0
- 1% rule +2.6/10.0
- Condition / age +2.5/5.0
- DSCR +1.5/10.0
- Schools +1.4/10.0
$198,800
🖨 Deal sheet (PDF) 📄 Offer letter ✓ Due diligence
Listing remarks MLS
OWNER FINANCING or LEASE OPTION, this dual-living property offers a rare chance to acquire a versatile home while bypassing traditional bank requirements. The main residence is a functional 972 sqft three-bedroom, one-bathroom home, perfectly paired with a private 600 sqft accessory dwelling unit (ADU) in the rear that includes its own bedroom and bathroom. Whether you are looking for a multi-generational living solution or a property with a built-in rental stream to offset monthly costs, this dual-unit setup provides maximum flexibility and accessibility through tailored, creative terms.
Key facts
- 4,094 sq ft lot
- Built 1925
- Listed 93 days
Neighborhood map
What this means for you Summary
Snapshot
- This is a 4-bed/2.0-bath single-family listed at $199k.
Deal economics
- At list price, monthly cash flow is $-265 ($-3k/yr) — negative.
- To cash-flow at today's rent, offer at most $152k (23.6% below list).
- To meet the 1% rule (rent ≥ 1% of price), the offer needs to be $152k (23.7% below list).
- Recommended offer: $152k (23.7% below list) — sets the bar for 1% rule.
- Cap rate 4.7% vs local median 3.8% in San Antonio — meaningfully above typical; check what's discounted (condition, days-on-market, listing class) to confirm the premium yield is real.
Location & tenants
- Location reads 80/100 on livability (#31 in TX, #1,616 nationally) — a professional / high-income tenant draw. Strengths: amenities A+, commute A+, cost of living A+; Watch: crime F.
- San Antonio ISD (urban): math 12% / reading 22% proficiency, ranked #805 of 826 in TX (top 98%) — low school quality limits family demand, transient renter base, plan for 1-2y turnover; 80% free/reduced lunch — lower-income household profile, screen leases tightly.
- Zoned schools: Margil El (math 10% / reading 15%, grade F, #4,167 of 4,322 statewide, top 97%, 436 students, 97% FRL); Lanier H S (math 9% / reading 15%, grade F, #1,554 of 1,632 statewide, top 95%, 1,547 students, 97% FRL) — zoned schools average 97% FRL vs 80% district-wide (17 pts higher); higher-poverty schools than district average — tighter screening recommended.
- Market conditions: Rents rising fast (+7.7%/yr); 164 active listings in the ZIP; 20 comparable units currently listed for rent nearby; rentals leasing fast (median 7d on market — plan ~1-2 weeks tenant-placement turnaround); lower-income renter base — watch delinquency; 8,308 units permitted in Bexar County in 2024 (2,506 in 5+ unit buildings).
- At $1,516/mo this rent would consume 56% of the median local household income ($32k/yr) (locally 2789% of renters already pay >50% of income on rent) — very limited rent-growth headroom before tenants either downsize or default.
Forward outlook
- In year one you build about $21k of equity ($1k loan paydown + $20k appreciation (10.0% local appreciation)).
- Bexar County population projected at +50% by 2050 — long-run rental-demand tailwind backs the buy-and-hold thesis.
- By year 2, paydown + projected appreciation supports a ~$34k cash-out refi (75% LTV) — recoverable capital for the next deal without selling this one.
Negotiation context
- It's been on market 93 days — a 9% lower offer ($181k) is reasonable based on typical stale-listing flexibility.
- 13 sale attempts since 21y ago with the ask held roughly flat each time — persistent listings suggest the price (not the market) is what's stuck; bring a comps-based counter.
Risks & watch-outs
- Watch-outs: built in 1925 — expect roof / HVAC / electrical / plumbing capex.
- Climate carrying-cost: major wind risk, 77% chance of damaging wind over 30y; extreme-heat days projected 7→21/yr by 2055 (HVAC capex compounding) — expect insurance premiums to compound above CPI over the hold.
Questions for the listing agent
- What do current leases actually rent for vs. the listed asking? Can we see a recent rent roll and the last 12 months of T-12 income?
- It's been on market 93 days. Have you received any prior offers? Is the seller open to a 24% concession, seller financing, or rate buy-down credit?
- Built in 1925 — when were the roof, HVAC, electrical panel, plumbing, and water heater last replaced?
- Why hasn't it sold? Are there any deal-killer items the seller is aware of (foundation, flood, title, zoning, code violations)?
- Is there a deadline driving the sale (1031 exchange, divorce, estate, relocation)? That informs how much negotiation room exists.
- Crime grade is F in this area — have there been break-ins, vandalism, or insurance claims at this property in the last 3 years? What carrier currently insures it and at what premium?
- The area grade is low — what's the realistic commute time and amenity access for the typical tenant pool here? Any planned neighborhood developments (good or bad) we should know about?
- What's the average days-on-market for RENTAL listings here right now (not sales)? A rising rental-DOM trend means longer vacancies and softer asking-rent achievability than the comps imply.
- What's the recent tenant-quality profile in this submarket — average credit score on applications, eviction rate, late-payment / NSF rate, and stable-employment percentage? A property-management company in the area should have these aggregated.
- How much new for-sale + rental construction is in the pipeline within 1–3 miles? Heavy new supply typically softens prices + rents 12–24 months out; constrained supply supports both.
Investment metrics
- 1% rule
- 0.76% ✗
- Cap rate
- 4.69%
- Cash-on-cash
- -5.72%
- DSCR
- 0.75
- GRM
- 10.9
CMA / ARV
- ARV (median comp)
- $209,441
- List price
- $198,800
- Delta
- -5.08%
- Verdict
- FAIR
- Comps
- 20 within 1.0 mi
Show comp detail 6 sales within ~0.75 mi
| Address | Dist | Beds/Ba | Sqft | Sold | Price | $/sf | Match |
|---|---|---|---|---|---|---|---|
| 146 Eddie Wessley | 0.03mi | 3/1.0 (-1) | 1,041 (+7%) | 12mo | $157,900 | $152 | 68 |
| 1129 N Smith St | 0.43mi | 3/1.0 (-1) | 1,036 (+7%) | 10mo | $170,000 | $164 | 52 |
| 823 N Trinity St | 0.38mi | 3/1.0 (-1) | 1,064 (+10%) | 8mo | $129,000 | $121 | 51 |
| 945 Delgado | 0.69mi | 3/1.0 (-1) | 987 (+2%) | 7mo | $50,000 | $51 | 51 |
| 109 Rounds St | 0.49mi | 3/2.0 (-1) | 1,031 (+6%) | 16mo | $120,000 | $116 | 48 |
| 1215 Perez St | 0.31mi | 3/2.0 (-1) | 1,068 (+10%) | 20mo | $195,000 | $183 | 48 |
Match score weights: distance 35% · size 25% · config 20% · recency 20%. Top-matched comps best support the ARV.
Projected returns pro-forma
10.0% appreciation · 7.73% rent growth · sell at horizon
- IRR
- 21.7%
- Equity multiple
- 2.78×
- Total profit
- $99,012
- Equity at exit
- $179,095
- IRR
- 20.7%
- Equity multiple
- 6.81×
- Total profit
- $323,543
- Equity at exit
- $386,225
Cash invested: $55,664 (down + closing). Projections, not guarantees.
Landlord ↔ Tenant lean methodology
- Overall (STATE)
- 87 Strongly Landlord-Friendly
- State Texas
- 87 Strongly Landlord-Friendly · R+5
- County
- — inherits STATE
- City
- — inherits STATE
ZIP-level market 78207
- Home prices YoY
- 15.2%
- Rents YoY
- 7.7%
- Active inventory
- 164
- Price-to-rent
- 10.9×
Monthly cashflow live
- Estimated rent
- $1,516 high interval (Pro) →
- Mortgage (P&I)
- −$1,043
- Tax from tax record
- −$337 /mo · $4,049/yr
- Insurance
- −$83
- HOA
- −$0
- Vacancy / Maint / Mgmt
- −$318
- Net cashflow
- $-265
Break-even live
Sensitivity live
| Price | -10% $-153 | -5% $-209 | +0% $-265 | +5% $-322 | +10% $-378 |
|---|---|---|---|---|---|
| Rent | -10% $-385 | -5% $-325 | +0% $-265 | +5% $-205 | +10% $-146 |
| Rate | -1.0pp $-165 | -0.5pp $-215 | base $-265 | +0.5pp $-317 | +1.0pp $-369 |
UW: 25.0% down · 7.5% · 30yr · 1.5% tax · 5.0% vac · 8.0% maint · 8.0% mgmt
Financing live
Cash to close
- Down payment
- $49,700
- Closing costs
- $5,964
- Reserves months
- —
- Total cash needed
- —
Loan-product check · same deal, 3 products live
Conventional
25% down · 7.5% · 30yr
- Down + closing
- —
- Monthly P&I
- —
- Monthly cashflow
- —
- DSCR
- —
- Eligible?
- —
Personal DTI + credit; lowest rate.
DSCR
20% down · 8.5% · 30yr
- Down + closing
- —
- Monthly P&I
- —
- Monthly cashflow
- —
- DSCR
- —
- Eligible?
- —
No personal income docs; deal must DSCR.
Hard money
10% down · 12.0% · 12mo
- Down + closing
- —
- Monthly P&I
- —
- Monthly cashflow
- —
- DSCR
- —
- Eligible?
- —
Short-term bridge; refi at stabilization.
Rent comps 20 comps
| Address | Beds | Baths | Sqft | Rent | $/sqft | DOM | Units | Dist |
|---|---|---|---|---|---|---|---|---|
| 717 N Colorado St San Antonio, TX | 3.0 | 1.0 | 1100 | $1,199 | $1.09 | 45d | 1 | 0.14mi |
| 614 N Sabinas St San Antonio, TX | 3.0 | 2.0 | 930 | $1,249 | $1.34 | 6d | 1 | 0.42mi |
| 542 Rivas St Unit B San Antonio, TX | 3.0 | 2.0 | 876 | $985 | $1.12 | 0d | 1 | 0.45mi |
| 215 S Brazos St San Antonio, TX | 3.0 | 1.0 | 900 | $1,350 | $1.50 | 6d | 1 | 0.48mi |
| 1711 W Cesar E Chavez Blvd Unit 1 San Antonio, TX | 3.0 | 1.0 | 800 | $1,275 | $1.59 | 45d | 1 | 0.68mi |
| 509 S Trinity St San Antonio, TX | 3.0 | 1.0 | 921 | $1,300 | $1.41 | 6d | 1 | 0.76mi |
| 2619 W Houston St San Antonio, TX | 3.0 | 1.0 | 776 | $1,800 | $2.32 | 45d | 1 | 0.76mi |
| 1102 El Paso St San Antonio, TX | 1.0–3.0 | 1.0–2.0 | 888 | $1,437 | $1.62 | 5d | 1 | 0.89mi |
| 100 N Santa Rosa San Antonio, TX | 3.0 | 1.0–3.0 | 1299 | $3,845 | $2.96 | 0d | 37 | 0.96mi |
| 206 Roberts St Unit 201 San Antonio, TX | 3.0 | 2.0 | 1100 | $1,350 | $1.23 | 26d | 1 | 1.12mi |
| 1011 S Frio St San Antonio, TX | 3.0 | 1.0–3.0 | 1121 | $2,195 | $1.96 | 0d | 31 | 1.13mi |
| 300 N Main Ave San Antonio, TX | 3.0 | 1.0–2.5 | 1153 | $10,437 | $9.05 | 0d | 98 | 1.14mi |
| 614 Chihuahua St San Antonio, TX | 3.0 | 2.0 | 1082 | $1,400 | $1.29 | 45d | 1 | 1.19mi |
| 214 Aztec St San Antonio, TX | 3.0 | 2.0 | 973 | $1,275 | $1.31 | 17d | 1 | 1.19mi |
| 1231 Rivas St Unit 102 San Antonio, TX | 3.0 | 2.0 | 1120 | $1,299 | $1.16 | 45d | 1 | 1.19mi |
| 1415 N Main Ave San Antonio, TX | 3.0 | 1.0–3.0 | 906 | $2,150 | $2.37 | 5d | 12 | 1.27mi |
| 1415 N Main Ave San Antonio, TX | 1.0–3.0 | 1.0–3.0 | 818 | $1,899 | $2.32 | 0d | 33 | 1.27mi |
| 1415 N Main Ave San Antonio, TX | 1.0–3.0 | 1.0–3.0 | 980 | $2,715 | $2.77 | 12d | 15 | 1.27mi |
| 143 E Commerce St San Antonio, TX | 1.0–3.0 | 1.0–3.5 | 1442 | $9,885 | $6.85 | 0d | 15 | 1.30mi |
| 2406 S Laredo St San Antonio, TX | 3.0 | 1.0 | 944 | $1,200 | $1.27 | 17d | 1 | 1.44mi |
Listing history 50 events
-
2026-06-21days on market $198,800 Active 93 DOM
-
2026-06-18days on market $198,800 Active 90 DOM
-
2026-06-17days on market $198,800 Active 89 DOM
-
2026-06-16days on market $198,800 Active 88 DOM
-
2026-06-15days on market $198,800 Active 87 DOM
-
2026-06-13days on market $198,800 Active 85 DOM
-
2026-06-09days on market $198,800 Active 81 DOM
-
2026-06-08days on market $198,800 Active 80 DOM
-
2026-06-07days on market $198,800 Active 79 DOM
-
2026-06-04days on market $198,800 Active 76 DOM
-
2026-06-03days on market $198,800 Active 75 DOM
-
2026-06-02days on market $198,800 Active 74 DOM
-
2026-06-01days on market $198,800 Active 73 DOM
-
2026-05-31days on market $198,800 Active 72 DOM
-
2026-04-17price $198,800 595-char remark
Show marketing remark (595 chars)
OWNER FINANCING or LEASE OPTION, this dual-living property offers a rare chance to acquire a versatile home while bypassing traditional bank requirements. The main residence is a functional 972 sqft three-bedroom, one-bathroom home, perfectly paired with a private 600 sqft accessory dwelling unit (ADU) in the rear that includes its own bedroom and bathroom. Whether you are looking for a multi-generational living solution or a property with a built-in rental stream to offset monthly costs, this dual-unit setup provides maximum flexibility and accessibility through tailored, creative terms.
-
2026-03-20$199,800 New 595-char remark
Show marketing remark (595 chars)
OWNER FINANCING or LEASE OPTION, this dual-living property offers a rare chance to acquire a versatile home while bypassing traditional bank requirements. The main residence is a functional 972 sqft three-bedroom, one-bathroom home, perfectly paired with a private 600 sqft accessory dwelling unit (ADU) in the rear that includes its own bedroom and bathroom. Whether you are looking for a multi-generational living solution or a property with a built-in rental stream to offset monthly costs, this dual-unit setup provides maximum flexibility and accessibility through tailored, creative terms.
-
2026-03-02historical $800
-
2026-03-02historical $800
-
2026-02-06$800
-
2026-02-06$1,500
-
2025-08-25historical
-
2025-08-06$199,900 New
-
2025-08-02historical
-
2025-07-16price $235,000
-
2025-07-03price $239,990
-
2025-05-08price $240,000
-
2025-03-08$245,000 New
-
2022-07-11soldstatus Sold
-
2022-07-11soldstatus
-
2022-06-22status Pending
-
2022-06-11historical Active Option
-
2022-06-04$199,999 New
-
2022-02-10historical
-
2022-01-21status Back on Market
-
2022-01-18historical Active Option
-
2022-01-14$199,999 New
-
2021-09-29soldstatus
-
2021-09-24soldstatus Sold
-
2021-08-23status Pending
-
2021-08-19historical Active Option
-
2021-08-16price $118,000
-
2021-08-15status Back on Market
-
2021-08-10historical Active Option
-
2021-07-26$134,000 New
-
2019-08-07soldstatus Sold
-
2019-08-05soldstatus
-
2019-07-29status Pending
-
2019-07-14$140,000 New
-
2018-10-18soldstatus Sold
-
2018-09-29status Pending
ⓘ Source: listings_history table (triggers on properties + properties_extension) + one-shot
backfill from property_details.listing_events for pre-trigger history.
Tax reassessment forecast TX · Resets to sale price
- Current annual tax
- $4,049 · $337/mo
- Projected year-2 tax
- $4,049 · $337/mo
- Expected delta
- $0/yr ($0/mo · 0.0%)
ⓘ Screening estimate from a state-policy table — verify with the county assessor before closing.
Climate risk First Street
- Flood 1/10 Low FEMA zone X (unshaded) · 0% chance over 30 yrs
- Wildfire 1/10 Low
- Heat 8/10 Severe 7 d/yr ≥108°F today · 21 d/yr by 30 yrs out
- Wind 6/10 Major 77% chance of damaging wind over 30 yrs
- Air quality 2/10 Low 1 unhealthy d/yr today · 2 by 30 yrs out
Nearby sold comps map
Loading sold comps map…
Walkable amenities ~0.75 mi
Loading nearby amenities…
Taxation est. · year 1
- Rental income
- $18,190
- − Mortgage interest
- −$11,136
- − Property taxes
- −$4,049
- − Insurance
- −$994
- − Repairs & maintenance
- −$1,455
- − Management
- −$1,455
- − Depreciation
- −$5,783
- Taxable loss
- −$6,683
- Est. tax savings @ 24.0%
- +$1,604
- After-tax cash flow
- $-1,580/yr
For passive investors: Depreciation is non-cash, so a rental often shows a tax loss while cash-flowing — sheltering income. Rental losses are passive: they offset passive income freely, and up to $25,000/yr can offset ordinary (W-2) income if you actively participate and your MAGI is under $100k (phasing out to $0 by $150k); unused losses carry forward. On sale, claimed depreciation is recaptured at up to 25%, and gains may owe capital-gains tax (a 1031 exchange can defer both). Figures are a year-1 estimate at your 24.0% rate — not tax advice; consult a CPA.
Schools (NCES district)
- District
- San Antonio ISD
- NCES district ID
- 4838730
- Math proficiency
- 12% ▼ -21.00%
- Reading proficiency
- 22% ▼ -7.00%
- Median HH income
- $30,952
- Composite
- 13.57/100
- National rank
- #9512
- State rank
- #805 of 826 in TX
Livability — San Antonio
- Score
- 80/100
- State rank
- #31
- US rank
- #1616
Category grades
Schools grade is shown separately in the Schools card above.
Census & demographics
- Census place
- San Antonio, TX
- County
- Bexar County · 1,990,555 people
- City population
- 1,806,925
- Metro
- San Antonio-New Braunfels, TX
- Population (ZIP)
- 55,474
- Household income
- $32,472
- Rent vs Own
- Severe rent burden
- 2789.0
Population outlook (Bexar County) Hauer SSP2
- Today (2025)
- 2,336,851 people
- By 2030
- 2,560,728 · +9.6%
- By 2040
- 3,020,569 · +29.3%
- By 2050
- 3,493,522 · +49.5%
- By 2075
- 4,668,459 · +99.8%
- By 2100
- 5,533,242 · +136.8%
Race, ethnicity, and origin ACS 2023
- Neighborhood character
- Predominantly Hispanic (88%)
- Race & ethnicity
- Hispanic / Latino 88% Two or more races 41% White 6% Black 5% Native American 2%
- Hispanic origin (detail)
- Mexican 79%
- Foreign-born
- 19% · Canada
- Languages at home
- 39% English-only · Spanish 60%
Political lean MEDSL · Bexar
- 2024 margin
- Lean D (+9.8) · D 54.3% · R 44.6% · Other 1.1%
- 2008→2024 swing
- +4.2pp toward D · 2008: 5.6pp · 2024: 9.8pp
- All cycles
- 2024: D+9.8 2020: D+18.2 2016: D+13.5 2012: D+4.6 2008: D+5.6
Not yet ingested
- Civics
- —
Market trends
- HPI YoY
- ▲ 34.92%
- Current HPI
- 264.7559
- Rent YoY
- ▲ 7.73%
- Metro
- San Antonio-New Braunfels, TX
- State GDP YoY
- ▲ 3.95%
- F500 in state
- 110
Industry mix (Fortune 500 HQ in TX)
| Industry | F500 HQs | Revenue |
|---|---|---|
| Energy | 16 | $1,198B |
|
||
| Technology | 5 | $198B |
|
||
| Engineering / Construction | 4 | $72B |
|
||
| Energy Services | 3 | $60B |
|
||
| Utilities | 3 | $41B |
|
||
| Healthcare | 2 | $330B |
|
||
Price history
+899.0% since first listed43 events — show timeline
- 2026-04-17 Price Changed $198,800 LERA
- 2026-03-20 Listed $199,800 LERA
- 2026-03-02 Rental Removed $800 SABOR
- 2026-03-02 Rental Removed $800 SABOR
- 2026-02-06 Listed for Rent $800 SABOR
- 2026-02-06 Listed for Rent $1,500 SABOR
- 2025-08-25 Listing Removed — LERA
- 2025-08-06 Listed $199,900 LERA
- 2025-08-02 Listing Removed — LERA
- 2025-07-16 Price Changed $235,000 LERA
- 2025-07-03 Price Changed $239,990 LERA
- 2025-05-08 Price Changed $240,000 LERA
- 2025-03-08 Listed $245,000 LERA
- 2022-07-11 Sold (MLS) — LERA
- 2022-07-11 Sold (Public Records) — Public Records
- 2022-06-22 Pending — LERA
- 2022-06-11 Contingent — LERA
- 2022-06-04 Listed $199,999 LERA
- 2022-02-10 Listing Removed — LERA
- 2022-01-21 Relisted — LERA
- 2022-01-18 Contingent — LERA
- 2022-01-14 Listed $199,999 LERA
- 2021-09-29 Sold (Public Records) — Public Records
- 2021-09-24 Sold (MLS) — LERA
- 2021-08-23 Pending — LERA
- 2021-08-19 Contingent — LERA
- 2021-08-16 Price Changed $118,000 LERA
- 2021-08-15 Relisted — LERA
- 2021-08-10 Contingent — LERA
- 2021-07-26 Listed $134,000 LERA
- 2019-08-07 Sold (MLS) — LERA
- 2019-08-05 Sold (Public Records) — Public Records
- 2019-07-29 Pending — LERA
- 2019-07-14 Listed $140,000 LERA
- 2018-10-18 Sold (MLS) — LERA
- 2018-09-29 Pending — LERA
- 2018-09-18 Price Changed $54,900 LERA
- 2018-08-13 Listed $59,900 LERA
- 2006-06-06 Sold (Public Records) — Public Records
- 2005-12-15 Sold (Public Records) — Public Records
- 2005-12-09 Sold (MLS) — LERA
- 2005-11-11 Listed $19,900 LERA
- 1998-12-28 Sold (Public Records) — Public Records
Property tax history
+11.7%/yrLatest (2025): $4,049 · +0.0% YoY. Source: county tax records.
Cash-flow waterfall
monthlySold comps — $/sqft
last 12 mo · ≤1 miLoading sold comps…