323 W Academy St · Charles Town, WV
Flood risk 1/10 · Minimal
- FEMA flood zone
- X (unshaded)
- Chance of flooding over 30 yrs
- 0.0%
- Est. flood insurance / yr
- $473 – $860
Fire risk 1/10 · Minimal
- Est. fire insurance / yr
- $787 – $1,461
Heat risk 6/10 · Moderate
- Hot days now (above 102°F)
- 7 days/yr
- Hot days in 30 yrs
- 16 days/yr
Wind risk 2/10 · Minimal
- Chance of severe wind over 30 yrs
- 2.0%
Air-quality risk 2/10 · Minimal
- Unhealthy air days now
- 1 days/yr
- Unhealthy air days in 30 yrs
- 1 days/yr
Risk factors via First Street. Map © Google.
Why this score? — see what drove the B+ grade
The composite is a weighted blend of 9 inputs, each scored 0–100. Each bar is that input's sub-score; the figure is the points it added to the 100-point composite (weight × sub-score).
- Cash flow +30.0/30.0
- 1% rule +10.0/10.0
- DSCR +10.0/10.0
- ARV discount +7.5/15.0
- Appreciation +6.3/10.0
- Livability +3.8/5.0
- Rent growth +3.6/5.0
- Schools +3.4/10.0
- Condition / age +2.5/5.0
$125,000
🖨 Deal sheet 📄 Offer letter ✓ Due diligence
Listing remarks
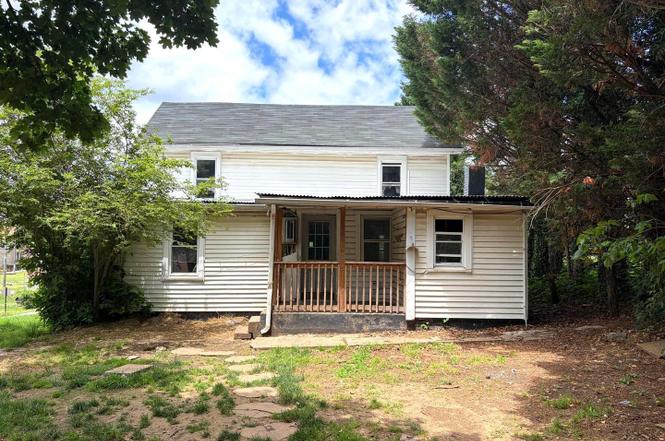
INVESTOR SPECIAL!! This home in the heart of Charles Town is waiting for someone to bring it to life. Lots of potential and a great investment opportunity whether it be a flip or a rental property.
Key facts
- 9,679 sq ft lot
- Built 1920
Property features AI
Exterior
- Parking: Driveway
- Utilities: Public water; Public sewer; Electric service
- Home design: Detached structure
- Construction: Vinyl siding; Block foundation; Above-grade and below-grade structures
- Exterior features: Located within city limits; No tidal water on the lot
Interior
- Bedrooms: Three bedrooms on the first upper level
- Bathrooms: One full bathroom
- Heating & cooling: Baseboard electric heating; Window air conditioning units; Electric hot water
- Interior features: Partial basement; Two or more access exits
Neighborhood map
What this means for you Summary
Snapshot
- This is a 3-bed/1.0-bath single-family listed at $125k.
Deal economics
- At list price, monthly cash flow is $750 ($9k/yr) — positive.
- The deal already cash-flows at list — no discount required.
- Meets the 1% rule at list price ($2k rent vs $125k).
- Cap rate 13.5% vs local median 3.4% in Charles Town — top-decile yield for the area; either an underpriced asset or a hidden risk that comps aren't pricing in. Stress-test before assuming the spread holds.
Location & tenants
- Location reads 76/100 on livability (#22 in WV, #3,460 nationally) — a middle-class / working-renter tenant base. Strengths: crime A+, housing A+, health & safety A+; Watch: schools D+, amenities D+, commute F.
- Jefferson County Schools (rural): math 29% / reading 46% proficiency, ranked #6 of 55 in WV (top 11%) — families likely to look elsewhere, expect single-tenant / working-renter base with shorter leases.
- Market conditions: Rents rising fast (+4.3%/yr); 382 active listings in the ZIP; 2 comparable units currently listed for rent nearby; solid renter incomes; 1,162 units permitted in Jefferson County in 2024 (360 in 5+ unit buildings).
Forward outlook
- In year one you build about $4k of equity ($864 loan paydown + $3k appreciation (2.7% local appreciation)).
- Jefferson County population projected at +13% by 2050 — modest demand growth; plan on rents tracking national, not racing it.
- At projected returns (2.7% appreciation + 4.3% rent growth), your $35k cash investment doubles in ~3 years — after that, you're playing with house money.
- By year 8, paydown + projected appreciation supports a ~$31k cash-out refi (75% LTV) — recoverable capital for the next deal without selling this one.
Negotiation context
- Only 2 days on market — expect competitive offers; lowballing is unlikely to land.
- Current owner paid $54k; list at $125k implies a 134% gain — meaningful room to come down on a strong offer.
Risks & watch-outs
- Watch-outs: built in 1920 — expect roof / HVAC / electrical / plumbing capex.
- Climate carrying-cost: extreme-heat days projected 7→16/yr by 2055 (HVAC capex compounding) — expect insurance premiums to compound above CPI over the hold.
Questions for the listing agent
- Built in 1920 — when were the roof, HVAC, electrical panel, plumbing, and water heater last replaced?
- Is there a deadline driving the sale (1031 exchange, divorce, estate, relocation)? That informs how much negotiation room exists.
- Schools are D-rated, which usually means shorter tenancies and higher turnover. Who's the typical renter profile here, and what's been the actual vacancy rate?
- What's the average days-on-market for RENTAL listings here right now (not sales)? A rising rental-DOM trend means longer vacancies and softer asking-rent achievability than the comps imply.
- What's the recent tenant-quality profile in this submarket — average credit score on applications, eviction rate, late-payment / NSF rate, and stable-employment percentage? A property-management company in the area should have these aggregated.
- How much new for-sale + rental construction is in the pipeline within 1–3 miles? Heavy new supply typically softens prices + rents 12–24 months out; constrained supply supports both.
Investment metrics
- 1% rule
- 1.73% ✓
- Cap rate
- 13.50%
- Cash-on-cash
- 25.73%
- DSCR
- 2.14
- GRM
- 4.8
CMA / ARV
- ARV (on-the-fly)
- $321,997
- Comps found
- 12
Show comp detail 12 sales within ~0.75 mi
| Address | Dist | Beds/Ba | Sqft | Sold | Price | $/sf | Match |
|---|---|---|---|---|---|---|---|
| 102 Weirick Row | 0.05mi | 3/2.0 | 1,556 (+7%) | 1mo | $343,700 | $221 | 82 |
| 418 S Charles St | 0.13mi | 3/2.5 | 1,478 (+1%) | 6mo | $313,500 | $212 | 80 |
| 106 Weiricks Row | 0.06mi | 3/2.0 | 1,556 (+7%) | 9mo | $354,900 | $228 | 75 |
| 522 S Church St | 0.43mi | 3/1.5 | 1,502 (+3%) | 6mo | $310,000 | $206 | 67 |
| 13 Onyx Ln | 0.35mi | 3/2.5 | 1,538 (+6%) | 3mo | $350,000 | $228 | 66 |
| 7 Onyx Ln | 0.35mi | 3/2.5 | 1,538 (+6%) | 4mo | $349,900 | $228 | 65 |
| 329 N Mildred St | 0.53mi | 3/1.0 | 1,560 (+7%) | 2mo | $325,000 | $208 | 62 |
| 19 Onyx Ln | 0.34mi | 3/2.5 | 1,538 (+6%) | 9mo | $415,500 | $270 | 61 |
| 99 Nathaniel Dr | 0.57mi | 3/2.5 | 1,552 (+6%) | 4mo | $355,000 | $229 | 53 |
| 631 Eagle Ave | 0.46mi | 2/1.0 (-1) | 1,299 (-11%) | 5mo | $204,000 | $157 | 52 |
| 203 S George St | 0.66mi | 3/1.0 | 1,312 (-10%) | 2mo | $225,000 | $171 | 50 |
| 306 W 6th Ave | 0.75mi | 3/1.5 | 1,576 (+8%) | 6mo | $240,000 | $152 | 44 |
Match score weights: distance 35% · size 25% · config 20% · recency 20%. Top-matched comps best support the ARV.
Projected returns pro-forma
2.67% appreciation · 4.35% rent growth · sell at horizon
- IRR
- 32.3%
- Equity multiple
- 2.82×
- Total profit
- $63,790
- Equity at exit
- $53,931
- IRR
- 33.7%
- Equity multiple
- 5.79×
- Total profit
- $167,496
- Equity at exit
- $81,387
Cash invested: $35,000 (down + closing). Projections, not guarantees.
Landlord ↔ Tenant lean methodology
- Overall (STATE)
- 83 Strongly Landlord-Friendly
- State West Virginia
- 83 Strongly Landlord-Friendly · R+22
- County
- — inherits STATE
- City
- — inherits STATE
ZIP-level market 25414
- Home prices YoY
- 0.9%
- Rents YoY
- 4.3%
- Active inventory
- 382
- Price-to-rent
- 4.8×
Monthly cashflow live
- Estimated rent
- $2,165 medium interval (Pro) →
- Mortgage (P&I)
- −$656
- Tax from tax record
- −$253 /mo · $3,030/yr
- Insurance
- −$52
- HOA
- −$0
- Vacancy / Maint / Mgmt
- −$455
- Net cashflow
- $750
Break-even live
UW: 25.0% down · 7.5% · 30yr · 1.5% tax · 5.0% vac · 8.0% maint · 8.0% mgmt
Financing live
Cash to close
- Down payment
- $31,250
- Closing costs
- $3,750
- Reserves months
- —
- Total cash needed
- —
Loan-product check · same deal, 3 products live
Conventional
25% down · 7.5% · 30yr
- Down + closing
- —
- Monthly P&I
- —
- Monthly cashflow
- —
- DSCR
- —
- Eligible?
- —
Personal DTI + credit; lowest rate.
DSCR
20% down · 8.5% · 30yr
- Down + closing
- —
- Monthly P&I
- —
- Monthly cashflow
- —
- DSCR
- —
- Eligible?
- —
No personal income docs; deal must DSCR.
Hard money
10% down · 12.0% · 12mo
- Down + closing
- —
- Monthly P&I
- —
- Monthly cashflow
- —
- DSCR
- —
- Eligible?
- —
Short-term bridge; refi at stabilization.
Rent comps 2 comps
| Address | Beds | Baths | Sqft | Rent | $/sqft | DOM | Units | Dist |
|---|---|---|---|---|---|---|---|---|
| 302 N Mildred St Apt 200 Charles Town, WV | 2.0 | 1.0 | 927 | $1,800 | $1.94 | 24d | 1 | 0.50mi |
| 603 N Fairfax Blvd Ranson, WV | 3.0 | 2.0 | 1040 | $1,850 | $1.78 | 13d | 1 | 1.36mi |
Listing history 3 events
-
2026-06-18days on market $125,000 Active 2 DOM
-
2026-06-17remarks 197-char remark
-
2026-06-17$125,000 Active 1 DOM
ⓘ Source: listings_history table (triggers on properties + properties_extension) + one-shot
backfill from property_details.listing_events for pre-trigger history.
Tax reassessment forecast WV · Resets to sale price
- Current annual tax
- $3,030 · $253/mo
- Projected year-2 tax
- $3,030 · $253/mo
- Expected delta
- $0/yr ($0/mo · 0.0%)
ⓘ Screening estimate from a state-policy table — verify with the county assessor before closing.
Climate risk First Street
- Flood 1/10 Low FEMA zone X (unshaded) · 0% chance over 30 yrs
- Wildfire 1/10 Low
- Heat 6/10 Major 7 d/yr ≥102°F today · 16 d/yr by 30 yrs out
- Wind 2/10 Low 2% chance of damaging wind over 30 yrs
- Air quality 2/10 Low 1 unhealthy d/yr today · 1 by 30 yrs out
Nearby sold comps map
Loading sold comps map…
Walkable amenities ~0.75 mi
Loading nearby amenities…
Taxation est. · year 1
- Rental income
- $25,984
- − Mortgage interest
- −$7,002
- − Property taxes
- −$3,030
- − Insurance
- −$625
- − Repairs & maintenance
- −$2,079
- − Management
- −$2,079
- − Depreciation
- −$3,636
- Taxable income
- $7,533
- Est. tax owed @ 24.0%
- −$1,808
- After-tax cash flow
- $7,198/yr
For passive investors: Depreciation is non-cash, so a rental often shows a tax loss while cash-flowing — sheltering income. Rental losses are passive: they offset passive income freely, and up to $25,000/yr can offset ordinary (W-2) income if you actively participate and your MAGI is under $100k (phasing out to $0 by $150k); unused losses carry forward. On sale, claimed depreciation is recaptured at up to 25%, and gains may owe capital-gains tax (a 1031 exchange can defer both). Figures are a year-1 estimate at your 24.0% rate — not tax advice; consult a CPA.
Schools (NCES district)
- District
- Jefferson County Schools
- NCES district ID
- 5400570
- Math proficiency
- 29% ▼ -13.00%
- Reading proficiency
- 46% ▼ -7.00%
- Median HH income
- $67,038
- Composite
- 33.98/100
- National rank
- #5322
- State rank
- #6 of 55 in WV
Livability — Charles Town
- Score
- 76/100
- State rank
- #22
- US rank
- #3460
Category grades
Schools grade is shown separately in the Schools card above.
Census & demographics
- Census place
- Charles Town, WV
- County
- Jefferson County · 28,403 people
- City population
- 21,073
- Metro
- Washington-Arlington-Alexandria, DC-VA-MD-WV
- Population (ZIP)
- 21,073
- Household income
- $105,500
- Rent vs Own
- Severe rent burden
- 290.0
Population outlook (Jefferson County) Hauer SSP2
- Today (2025)
- 61,715 people
- By 2030
- 64,052 · +3.8%
- By 2040
- 67,713 · +9.7%
- By 2050
- 69,843 · +13.2%
- By 2075
- 72,679 · +17.8%
- By 2100
- 71,872 · +16.5%
Race, ethnicity, and origin ACS 2023
- Neighborhood character
- Predominantly White (78%)
- Race & ethnicity
- White 78% Two or more races 10% Black 7% Hispanic / Latino 7% Asian 1%
- Hispanic origin (detail)
- Mexican 2% Puerto Rican 1%
- Common ancestry
- Romanian 3% Slovak 2% Lithuanian 2%
- Foreign-born
- 5% · Canada, Jamaica
- Languages at home
- 93% English-only · Spanish 5% Other Indo-European 1%
Political lean MEDSL · Jefferson
- 2024 margin
- R (+15.8) · D 41.0% · R 56.8% · Other 2.1%
- 2008→2024 swing
- -20.6pp toward R · 2008: 4.8pp · 2024: -15.8pp
- All cycles
- 2024: R+15.8 2020: R+10.5 2016: R+15.3 2012: R+4.0 2008: D+4.8
Not yet ingested
- Civics
- —
Market trends
- HPI YoY
- ▲ 2.67%
- Current HPI
- 296.8007
- Rent YoY
- ▲ 4.35%
- Metro
- Washington-Arlington-Alexandria, DC-VA-MD-WV
- State GDP YoY
- —
- F500 in state
- 0
Price history
+133.6% since first listed2 events — show timeline
- 2026-06-16 Listed $125,000 BRIGHT MLS
- 1998-10-09 Sold (Public Records) $53,500 Public Records
Property tax history
+8.2%/yrLatest (2025): $3,030 · +9.9% YoY. Source: county tax records.
Cash-flow waterfall
monthlySold comps — $/sqft
last 12 mo · ≤1 miLoading sold comps…