 Multi-family
20058 Pacific Coast Hwy #1 · Malibu, CA
Flood risk 10/10 · Severe
- FEMA flood zone
- VE
- Chance of flooding over 30 yrs
- 0.99%
- Est. flood insurance / yr
- $5,013 – $11,043
Fire risk 6/10 · Moderate
- Est. fire insurance / yr
- $659 – $1,223
Heat risk 5/10 · Moderate
- Hot days now (above 82°F)
- 7 days/yr
- Hot days in 30 yrs
- 19 days/yr
Wind risk 1/10 · Minimal
- Chance of severe wind over 30 yrs
- —
Air-quality risk 4/10 · Minor
- Unhealthy air days now
- 6 days/yr
- Unhealthy air days in 30 yrs
- 6 days/yr
Risk factors via First Street. Map © Google.
Why this score? — see what drove the C grade
The composite is a weighted blend of 9 inputs, each scored 0–100. Each bar is that input's sub-score; the figure is the points it added to the 100-point composite (weight × sub-score).
- Cash flow +21.7/30.0
- ARV discount +7.5/15.0
- DSCR +6.9/10.0
- Schools +6.2/10.0
- Appreciation +5.3/10.0
- 1% rule +4.9/10.0
- Livability +2.7/5.0
- Condition / age +2.5/5.0
- Rent growth +1.7/5.0
$2,500,000
🖨 Deal sheet 📄 Offer letter ✓ Due diligence
Multi-family units
County records classify this as Multi-Family (2-4 Unit). Listing-text estimate: 1 unit. estimate disagrees with records
Listing remarks MLS
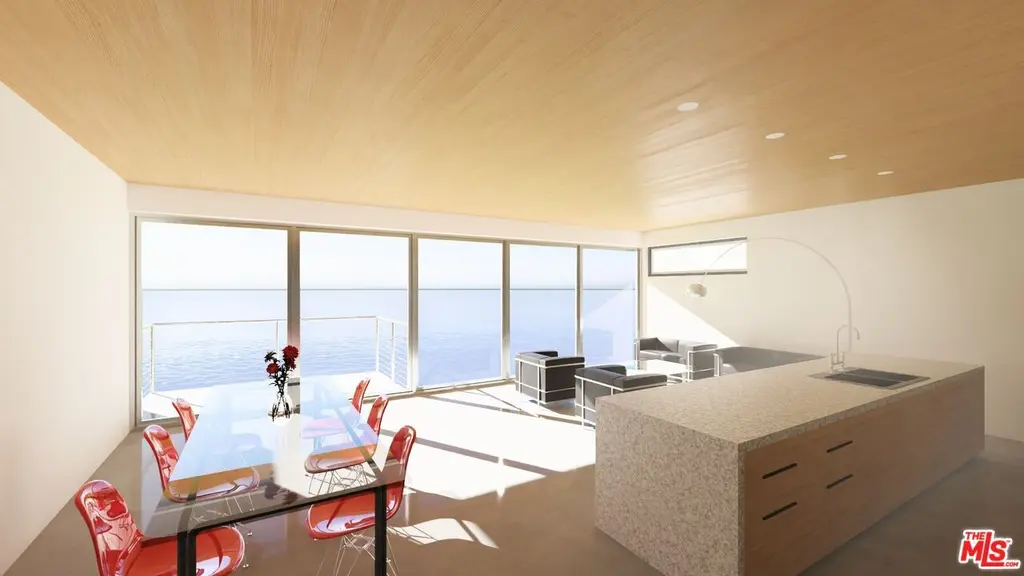
This property held a three story 4 br 3 ba duplex of 2,732 sq. ft that was built in 1957, until the Palisades fire destroyed in in January of 2025. The Seller have come to the conclusion that their insurance is insufficient to replace the Duplex that was destroyed with the necessary code upgrades. The Fire replacement code allows what was there before plus 10% so the new structure totals 2,975 sq feet plus a 440 sq. ft. garage. The design also includes 735 sq. ft. of decks. The design can either be used as a duplex or a single family dwelling by opening a connecting door. No Coastal Permit is required because of the Governor's order regarding rebuilds. Please make an appointment to look at the plans by Vitus Matare & Assoc. Photos are actually Architectural renderings of the proposed house.
Key facts
- 2,231 sq ft lot
- Listed 110 days
Neighborhood map
What this means for you Summary
Snapshot
- This is a 4-bed/3.0-bath multifamily listed at $2.50M.
Deal economics
- At list price, monthly cash flow is $3k ($38k/yr) — positive.
- The deal already cash-flows at list — no discount required.
- To meet the 1% rule (rent ≥ 1% of price), the offer needs to be $2.48M (0.9% below list).
- Recommended offer: $2.27M (9.0% below list) — sets the bar for market timing.
- Cap rate 8.1% vs local median 0.7% in Malibu — top-decile yield for the area; either an underpriced asset or a hidden risk that comps aren't pricing in. Stress-test before assuming the spread holds.
Location & tenants
- Location reads 53/100 on livability (#979 in CA) — a working-class tenant base; expect higher turnover. Strengths: employment A+, schools B; Watch: housing C-, crime F, amenities F.
- Santa Monica-Malibu Unified (urban): math 61% / reading 74% proficiency, ranked #123 of 1,400 in CA (top 9%) — acceptable for families but not a draw, mixed tenant base, ~2y average lease.
- Market conditions: Rents falling (-3.4%/yr); 627 active listings in the ZIP; 8 comparable units currently listed for rent nearby; rentals lingering (median 44d on market — plan ~5-8 weeks vacancy on turnover, expect pricing pressure); 62% of comp listings sitting > 30 days — soft ceiling on asking rent; high-income renter base; 19,697 units permitted in Los Angeles County in 2024 (9,426 in 5+ unit buildings).
- At $24,778/mo this rent would consume 151% of the median local household income ($197k/yr) (locally 420% of renters already pay >50% of income on rent) — very limited rent-growth headroom before tenants either downsize or default.
Forward outlook
- In year one you build about $33k of equity ($17k loan paydown + $15k appreciation (0.6% local appreciation)).
- Los Angeles County population projected at +9% by 2050 — modest demand growth; plan on rents tracking national, not racing it.
- At projected returns (0.6% appreciation + 0.0% rent growth), your $700k cash investment doubles in ~10 years — after that, you're playing with house money.
- By year 5, paydown + projected appreciation supports a ~$160k cash-out refi (75% LTV) — recoverable capital for the next deal without selling this one.
Negotiation context
- It's been on market 111 days — a 9% lower offer ($2.27M) is reasonable based on typical stale-listing flexibility.
- Current owner paid $550k; list at $2.50M implies a 355% gain — meaningful room to come down on a strong offer.
Risks & watch-outs
- Watch-outs: flood insurance adds $669/mo; built in 1959 — expect roof / HVAC / electrical / plumbing capex.
- Climate carrying-cost: in FEMA flood zone VE (mandatory federal flood insurance); major wildfire risk; extreme-heat days projected 7→19/yr by 2055 (HVAC capex compounding) — expect insurance premiums to compound above CPI over the hold.
Questions for the listing agent
- It's been on market 111 days. Have you received any prior offers? Is the seller open to a 9% concession, seller financing, or rate buy-down credit?
- Built in 1959 — when were the roof, HVAC, electrical panel, plumbing, and water heater last replaced?
- What's the actual annual flood-insurance premium (NFIP or private), and is the property in a SFHA with mandatory coverage?
- Why hasn't it sold? Are there any deal-killer items the seller is aware of (foundation, flood, title, zoning, code violations)?
- Is there a deadline driving the sale (1031 exchange, divorce, estate, relocation)? That informs how much negotiation room exists.
- Schools are B-rated — typically a magnet for longer-tenancy family renters. What's the average tenant stay here, and is there a school-zone premium baked into asking?
- Crime grade is F in this area — have there been break-ins, vandalism, or insurance claims at this property in the last 3 years? What carrier currently insures it and at what premium?
- What's the average days-on-market for RENTAL listings here right now (not sales)? A rising rental-DOM trend means longer vacancies and softer asking-rent achievability than the comps imply.
- What's the recent tenant-quality profile in this submarket — average credit score on applications, eviction rate, late-payment / NSF rate, and stable-employment percentage? A property-management company in the area should have these aggregated.
- How much new apartment / multifamily construction is in the pipeline within 1–3 miles? Heavy new supply (>2% of stock underway) typically softens rents 12–24 months out; light construction supports rent growth.
Investment metrics
- 1% rule
- 0.99% ✗
- Cap rate
- 8.14%
- Cash-on-cash
- 6.60%
- DSCR
- 1.29
- GRM
- 8.4
CMA / ARV
- ARV (median comp)
- $5,136,897
- List price
- $2,500,000
- Delta
- -51.33%
- Verdict
- UNDERPRICED
- Comps
- 1 within 2.0 mi
Projected returns pro-forma
0.62% appreciation · 0.0% rent growth · sell at horizon
- IRR
- 3.8%
- Equity multiple
- 1.19×
- Total profit
- $130,010
- Equity at exit
- $804,121
- IRR
- 6.7%
- Equity multiple
- 1.72×
- Total profit
- $505,828
- Equity at exit
- $1,031,436
Cash invested: $700,000 (down + closing). Projections, not guarantees.
Landlord ↔ Tenant lean methodology
- Overall (STATE)
- 18 Strongly Tenant-Friendly
- State California
- 18 Strongly Tenant-Friendly · D+13
- County
- — inherits STATE
- City
- — inherits STATE
ZIP-level market 90265
- Home prices YoY
- 0.1%
- Rents YoY
- -3.4%
- Active inventory
- 627
- Price-to-rent
- 25.2×
Monthly cashflow live
- Estimated rent
- $24,778 medium interval (Pro) →
- Mortgage (P&I)
- −$13,110
- Tax from tax record
- −$1,576 /mo · $18,906/yr
- Insurance
- −$1,042
- Flood insurance flood zone
- −$669 /mo · $8,028/yr
- HOA
- −$0
- Vacancy / Maint / Mgmt
- −$5,203
- Net cashflow
- $3,178
Break-even live
3-unit breakdown (identical units grouped — click to expand)
| Units | Beds | Baths | Est. rent |
|---|---|---|---|
| 3× units | 2 | 2 | $24,777 |
| #1 | 2 | 2 | $8,259 |
| #2 | 2 | 2 | $8,259 |
| #3 | 2 | 2 | $8,259 |
| Total (3 units) | $24,778 | ||
UW: 25.0% down · 7.5% · 30yr · 1.5% tax · 5.0% vac · 8.0% maint · 8.0% mgmt
Financing live
Cash to close
- Down payment
- $625,000
- Closing costs
- $75,000
- Reserves months
- —
- Total cash needed
- —
Loan-product check · same deal, 3 products live
Conventional
25% down · 7.5% · 30yr
- Down + closing
- —
- Monthly P&I
- —
- Monthly cashflow
- —
- DSCR
- —
- Eligible?
- —
Personal DTI + credit; lowest rate.
DSCR
20% down · 8.5% · 30yr
- Down + closing
- —
- Monthly P&I
- —
- Monthly cashflow
- —
- DSCR
- —
- Eligible?
- —
No personal income docs; deal must DSCR.
Hard money
10% down · 12.0% · 12mo
- Down + closing
- —
- Monthly P&I
- —
- Monthly cashflow
- —
- DSCR
- —
- Eligible?
- —
Short-term bridge; refi at stabilization.
Rent comps 8 comps
| Address | Beds | Baths | Sqft | Rent | $/sqft | DOM | Units | Dist |
|---|---|---|---|---|---|---|---|---|
| 20448 Pacific Coast Hwy Malibu, CA | 3.0 | 3.0 | 1647 | $22,500 | $13.66 | 4d | 1 | 0.48mi |
| 20537 Little Rock Way Unit A Malibu, CA | 4.0 | 2.0 | 1892 | $11,000 | $5.81 | 43d | 1 | 0.62mi |
| 20537 Little Rock Way Malibu, CA | 5.0 | 3.0 | 2292 | $13,000 | $5.67 | 43d | 1 | 0.62mi |
| 20647 Seaboard Rd Malibu, CA | 3.0 | 2.0 | 2092 | $27,000 | $12.91 | 43d | 1 | 0.69mi |
| 20645 Seaboard Rd Malibu, CA | 3.0 | 2.0 | 1564 | $12,500 | $7.99 | 4d | 1 | 0.70mi |
| 20755 Seaboard Rd Malibu, CA | 5.0 | 3.0 | 2568 | $55,000 | $21.42 | 22d | 1 | 0.81mi |
| 3966 Las Flores Canyon Rd Malibu, CA | 3.0 | 2.0 | 1450 | $10,995 | $7.58 | 43d | 1 | 1.37mi |
| 3908 Las Flores Canyon Rd Malibu, CA | 3.0 | 2.0 | 1250 | $9,995 | $8.00 | 43d | 1 | 1.44mi |
Listing history 16 events
-
2026-06-18days on market $2,500,000 Active 111 DOM
-
2026-06-17days on market $2,500,000 Active 110 DOM
-
2026-06-16days on market $2,500,000 Active 109 DOM
-
2026-06-15days on market $2,500,000 Active 108 DOM
-
2026-06-13days on market $2,500,000 Active 106 DOM
-
2026-06-13days on market $2,500,000 Active 105 DOM
-
2026-06-09days on market $2,500,000 Active 102 DOM
-
2026-06-08days on market $2,500,000 Active 101 DOM
-
2026-06-07days on market $2,500,000 Active 100 DOM
-
2026-06-04days on market $2,500,000 Active 97 DOM
-
2026-06-03days on market $2,500,000 Active 96 DOM
-
2026-06-02days on market $2,500,000 Active 95 DOM
-
2026-06-01days on market $2,500,000 Active 94 DOM
-
2026-05-31days on market $2,500,000 Active 93 DOM
-
2026-02-11$2,500,000 Active 809-char remark
Show marketing remark (809 chars)
This property held a three story 4 br 3 ba duplex of 2,732 sq. ft that was built in 1957, until the Palisades fire destroyed in in January of 2025. The Seller have come to the conclusion that their insurance is insufficient to replace the Duplex that was destroyed with the necessary code upgrades. The Fire replacement code allows what was there before plus 10% so the new structure totals 2,975 sq feet plus a 440 sq. ft. garage. The design also includes 735 sq. ft. of decks. The design can either be used as a duplex or a single family dwelling by opening a connecting door. No Coastal Permit is required because of the Governor's order regarding rebuilds. Please make an appointment to look at the plans by Vitus Matare & Assoc. Photos are actually Architectural renderings of the proposed house.
-
1981-07-28soldstatus $550,000
ⓘ Source: listings_history table (triggers on properties + properties_extension) + one-shot
backfill from property_details.listing_events for pre-trigger history.
Tax reassessment forecast CA · Resets to sale price
- Current annual tax
- $18,906 · $1,576/mo
- Projected year-2 tax
- $19,000 · $1,583/mo
- Expected delta
- +$94/yr (+$8/mo · 0.5%)
ⓘ Screening estimate from a state-policy table — verify with the county assessor before closing.
Climate risk First Street
- Flood 10/10 Extreme FEMA zone VE · 99% chance over 30 yrs
- Wildfire 6/10 Major
- Heat 5/10 Major 7 d/yr ≥82°F today · 19 d/yr by 30 yrs out
- Wind 1/10 Low
- Air quality 4/10 Moderate 6 unhealthy d/yr today · 6 by 30 yrs out
Nearby sold comps map
Loading sold comps map…
Walkable amenities ~0.75 mi
Loading nearby amenities…
Taxation est. · year 1
- Rental income
- $297,336
- − Mortgage interest
- −$140,039
- − Property taxes
- −$18,906
- − Insurance
- −$20,528
- − Repairs & maintenance
- −$23,787
- − Management
- −$23,787
- − Depreciation
- −$72,727
- Taxable loss
- −$2,438
- Est. tax savings @ 24.0%
- +$585
- After-tax cash flow
- $38,723/yr
For passive investors: Depreciation is non-cash, so a rental often shows a tax loss while cash-flowing — sheltering income. Rental losses are passive: they offset passive income freely, and up to $25,000/yr can offset ordinary (W-2) income if you actively participate and your MAGI is under $100k (phasing out to $0 by $150k); unused losses carry forward. On sale, claimed depreciation is recaptured at up to 25%, and gains may owe capital-gains tax (a 1031 exchange can defer both). Figures are a year-1 estimate at your 24.0% rate — not tax advice; consult a CPA.
Schools (NCES district)
- District
- Santa Monica-Malibu Unified
- NCES district ID
- 0635700
- Math proficiency
- 61% ▬ 0.00%
- Reading proficiency
- 74% ▬ 0.00%
- Median HH income
- $81,489
- Composite
- 61.58/100
- National rank
- #1535
- State rank
- #123 of 1400 in CA
Livability — Malibu
- Score
- 53/100
- State rank
- #979
- US rank
- #24630
Category grades
Schools grade is shown separately in the Schools card above.
Census & demographics
- Census place
- Malibu, CA
- County
- Los Angeles County · 9,444,647 people
- City population
- 15,918
- Metro
- Los Angeles-Long Beach-Anaheim, CA
- Population (ZIP)
- 15,918
- Household income
- $196,742
- Rent vs Own
- Severe rent burden
- 420.0
Population outlook (Los Angeles County) Hauer SSP2
- Today (2025)
- 10,940,515 people
- By 2030
- 11,256,481 · +2.9%
- By 2040
- 11,729,929 · +7.2%
- By 2050
- 11,948,407 · +9.2%
- By 2075
- 11,818,114 · +8.0%
- By 2100
- 10,842,928 · -0.9%
Race, ethnicity, and origin ACS 2023
- Neighborhood character
- Predominantly White (77%)
- Race & ethnicity
- White 77% Two or more races 10% Hispanic / Latino 9% Asian 5% Black 1%
- Hispanic origin (detail)
- Mexican 6%
- Common ancestry
- Italian 8% Scotch-Irish 3% Romanian 3%
- Foreign-born
- 16% · Canada, South Korea, China
- Languages at home
- 82% English-only · Spanish 6% Other Indo-European 6% French/Haitian/Cajun 2%
Political lean MEDSL · Los Angeles
- 2024 margin
- Solid D (+32.9) · D 64.8% · R 31.9% · Other 3.3%
- 2008→2024 swing
- -7.4pp toward R · 2008: 40.4pp · 2024: 32.9pp
- All cycles
- 2024: D+32.9 2020: D+44.2 2016: D+48.0 2012: D+40.0 2008: D+40.4
Not yet ingested
- Civics
- —
Market trends
- HPI YoY
- ▲ 0.62%
- Current HPI
- 498.5117
- Rent YoY
- ▼ -3.39%
- Metro
- Los Angeles-Long Beach-Anaheim, CA
- State GDP YoY
- ▲ 3.21%
- F500 in state
- 116
Industry mix (Fortune 500 HQ in CA)
| Industry | F500 HQs | Revenue |
|---|---|---|
| Technology | 27 | $1,492B |
|
||
| Financial Services | 3 | $174B |
|
||
| Retail | 3 | $44B |
|
||
| Insurance | 3 | $26B |
|
||
| Media / Entertainment | 2 | $115B |
|
||
| Pharmaceuticals / Biotech | 2 | $62B |
|
||
Price history
+354.5% since first listed2 events — show timeline
- 2026-02-11 Listed $2,500,000 TheMLS
- 1981-07-28 Sold (Public Records) $550,000 Public Records
Property tax history
+2.2%/yrLatest (2025): $18,906 · +7.3% YoY. Source: county tax records.
Cash-flow waterfall
monthlySold comps — $/sqft
last 12 mo · ≤1 miLoading sold comps…