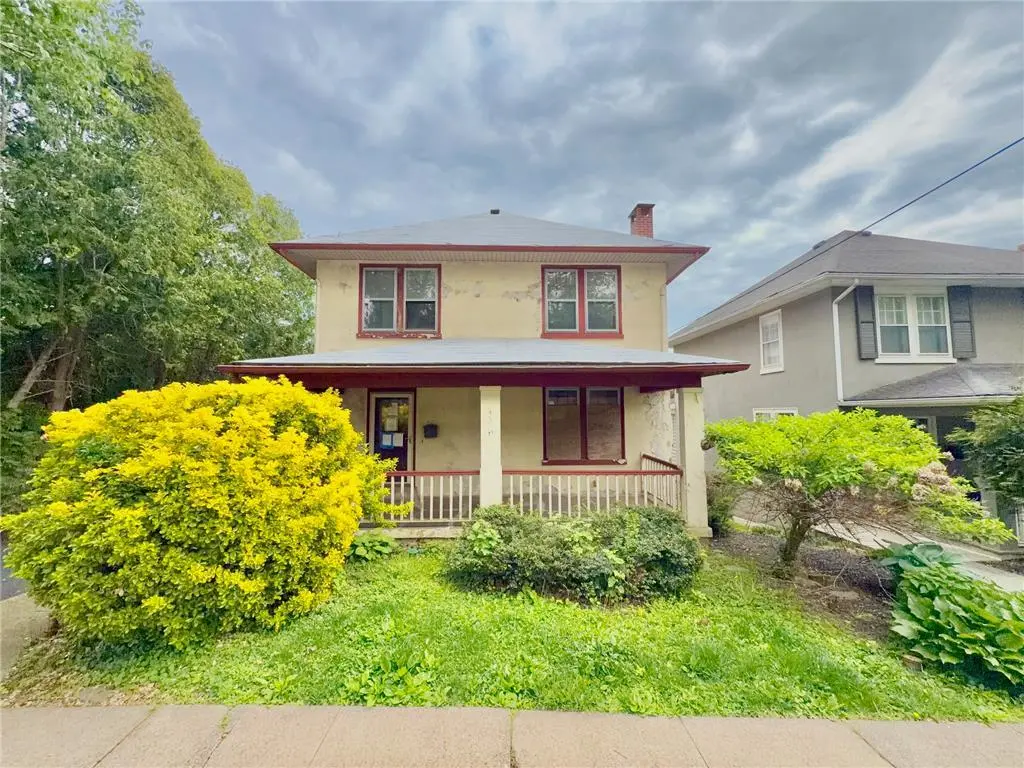
720 Lafayette St · Easton, PA
Flood risk 1/10 · Minimal
- FEMA flood zone
- X (unshaded)
- Chance of flooding over 30 yrs
- 0.0%
- Est. flood insurance / yr
- $473 – $860
Fire risk 1/10 · Minimal
- Est. fire insurance / yr
- $511 – $949
Heat risk 5/10 · Moderate
- Hot days now (above 100°F)
- 7 days/yr
- Hot days in 30 yrs
- 15 days/yr
Wind risk 4/10 · Minor
- Chance of severe wind over 30 yrs
- 16.0%
Air-quality risk 3/10 · Minor
- Unhealthy air days now
- 3 days/yr
- Unhealthy air days in 30 yrs
- 5 days/yr
Risk factors via First Street. Map © Google.
Why this score? — see what drove the C- grade
The composite is a weighted blend of 9 inputs, each scored 0–100. Each bar is that input's sub-score; the figure is the points it added to the 100-point composite (weight × sub-score).
- ARV discount +15.0/15.0
- Cash flow +12.8/30.0
- 1% rule +4.7/10.0
- Livability +4.2/5.0
- DSCR +3.8/10.0
- Rent growth +3.7/5.0
- Schools +3.3/10.0
- Condition / age +2.5/5.0
- Appreciation +0.0/10.0
$224,950
🖨 Deal sheet 📄 Offer letter ✓ Due diligence
Listing remarks
Opportunity awaits in the highly sought-after College Hill section of Lafayette College! This 2-story colonial offers 3 bedrooms, 1 full bathroom, and the chance to restore a classic home in one of the area’s most desirable locations. The property is in need of full renovation and updating throughout, including a roof replacement, but appears to offer solid bones and tremendous potential for investors, contractors, or buyers looking to customize a home to their own style and needs. A small fenced rear yard provides outdoor space and may offer the possibility for future off-street parking, subject to any required zoning and municipal approvals. Conveniently located near shopping, dinin
Key facts
- Full renovation
- Roof replacement
- Fenced rear yard
Tags
Property features AI
Exterior
- Parking: On-street parking
- Utilities: Public water service; Public sewer service
- Home design: Two-story residence; Tile roof; Aluminum and wood siding; About 1,456 above-grade finished area
- Construction: Built with aluminum and wood siding; Tile roof
- Exterior features: Public sewer; Public water
Interior
- Kitchen: Kitchen on the first floor (approx. 8 x 7)
- Bedrooms: Three bedrooms on the second floor (approx. 10 x 11, 10 x 12, 10 x 11)
- Bathrooms: One full bathroom (located on the second floor, approx. 8 x 7)
- Heating & cooling: Baseboard heating; Central air conditioning
- Interior features: Dining area
- Laundry & utility: Electric water heater
Neighborhood map
What this means for you Summary
Snapshot
- This is a 4-bed/1.0-bath single-family listed at $225k.
Deal economics
- At list price, monthly cash flow is $-22 ($-263/yr) — negative.
- To cash-flow at today's rent, offer at most $221k (1.7% below list).
- To meet the 1% rule (rent ≥ 1% of price), the offer needs to be $219k (2.6% below list).
- Recommended offer: $219k (2.6% below list) — sets the bar for 1% rule.
- Cap rate 6.2% vs local median 4.2% in Easton — top-decile yield for the area; either an underpriced asset or a hidden risk that comps aren't pricing in. Stress-test before assuming the spread holds.
Location & tenants
- Location reads 84/100 on livability (#92 in PA, #667 nationally) — a professional / high-income tenant draw. Strengths: amenities A+, cost of living A+, housing A+; Watch: schools C-.
- Easton Area SD (suburban): math 31% / reading 44% proficiency, ranked #364 of 539 in PA (top 68%) — families likely to look elsewhere, expect single-tenant / working-renter base with shorter leases.
- Market conditions: Rents rising fast (+4.9%/yr); 185 active listings in the ZIP; 18 comparable units currently listed for rent nearby; rentals at typical pace (median 24d on market — plan ~3-4 weeks tenant-placement turnaround); solid renter incomes; 567 units permitted in Northampton County in 2024 (151 in 5+ unit buildings).
- This rent runs 34% of the median local income ($78k/yr) — at the standard rent-burdened threshold; future hikes will face affordability resistance.
Forward outlook
- Local home prices are declining (-3.0%/yr); year-one equity from $2k of loan paydown is wiped out by about $7k of value loss. Plan a longer hold.
Negotiation context
- Only 11 days on market — expect competitive offers; lowballing is unlikely to land.
- 2 sale attempts since 24y ago with the ask held roughly flat each time — persistent listings suggest the price (not the market) is what's stuck; bring a comps-based counter.
- Current owner paid $122k; list at $225k implies a 85% gain — meaningful room to come down on a strong offer.
Risks & watch-outs
- Watch-outs: property tax is 2.6% of price; built in 1935 — expect roof / HVAC / electrical / plumbing capex.
- Climate carrying-cost: extreme-heat days projected 7→15/yr by 2055 (HVAC capex compounding) — expect insurance premiums to compound above CPI over the hold.
Questions for the listing agent
- What do current leases actually rent for vs. the listed asking? Can we see a recent rent roll and the last 12 months of T-12 income?
- Built in 1935 — when were the roof, HVAC, electrical panel, plumbing, and water heater last replaced?
- Property tax is high relative to price — has the assessment been appealed recently, and will the sale trigger a re-assessment?
- Is there a deadline driving the sale (1031 exchange, divorce, estate, relocation)? That informs how much negotiation room exists.
- What's the average days-on-market for RENTAL listings here right now (not sales)? A rising rental-DOM trend means longer vacancies and softer asking-rent achievability than the comps imply.
- What's the recent tenant-quality profile in this submarket — average credit score on applications, eviction rate, late-payment / NSF rate, and stable-employment percentage? A property-management company in the area should have these aggregated.
- How much new for-sale + rental construction is in the pipeline within 1–3 miles? Heavy new supply typically softens prices + rents 12–24 months out; constrained supply supports both.
Investment metrics
- 1% rule
- 0.97% ✗
- Cap rate
- 6.18%
- Cash-on-cash
- -0.42%
- DSCR
- 0.98
- GRM
- 8.6
CMA / ARV
- ARV (on-the-fly)
- $340,704
- Comps found
- 10
Show comp detail 10 sales within ~0.75 mi
| Address | Dist | Beds/Ba | Sqft | Sold | Price | $/sf | Match |
|---|---|---|---|---|---|---|---|
| 815 Wilbur St | 0.08mi | 3/1.5 (-1) | 1,408 (-3%) | 0mo | $290,000 | $206 | 83 |
| 626 Lafayette St | 0.07mi | 3/1.5 (-1) | 1,412 (-3%) | 2mo | $404,000 | $286 | 83 |
| 728 Coleman St | 0.04mi | 4/1.0 | 1,373 (-6%) | 11mo | $321,000 | $234 | 80 |
| 827 Wilbur St | 0.09mi | 3/1.5 (-1) | 1,408 (-3%) | 9mo | $335,000 | $238 | 76 |
| 613 Raub St | 0.17mi | 3/1.5 (-1) | 1,586 (+9%) | 8mo | $355,000 | $224 | 64 |
| 1333 Ridge Trl | 0.65mi | 3/1.0 (-1) | 1,434 (-2%) | 4mo | $330,000 | $230 | 59 |
| 901 W Fairfield Ave | 0.20mi | 3/1.5 (-1) | 1,524 (+5%) | 21mo | $415,000 | $272 | 59 |
| 800 W Burke St | 0.08mi | 3/2.0 (-1) | 1,658 (+14%) | 13mo | $480,000 | $290 | 53 |
| 201 Frost Hollow Rd | 0.65mi | 3/2.0 (-1) | 1,544 (+6%) | 8mo | $360,000 | $233 | 44 |
| 207 W Monroe St | 0.38mi | 3/1.0 (-1) | 1,614 (+11%) | 18mo | $255,000 | $158 | 44 |
Match score weights: distance 35% · size 25% · config 20% · recency 20%. Top-matched comps best support the ARV.
Projected returns pro-forma
-3.0% appreciation · 4.94% rent growth · sell at horizon
- IRR
- -14.5%
- Equity multiple
- 0.47×
- Total profit
- $-33,334
- Equity at exit
- $33,541
- IRR
- -2.5%
- Equity multiple
- 0.82×
- Total profit
- $-11,580
- Equity at exit
- $19,450
Cash invested: $62,986 (down + closing). Projections, not guarantees.
Landlord ↔ Tenant lean methodology
- Overall (STATE)
- 62 Landlord-Friendly
- State Pennsylvania
- 62 Landlord-Friendly · EVEN
- County
- — inherits STATE
- City
- — inherits STATE
ZIP-level market 18042
- Rents YoY
- 4.9%
- Active inventory
- 185
- Price-to-rent
- 8.6×
Monthly cashflow live
- Estimated rent
- $2,191 high interval (Pro) →
- Mortgage (P&I)
- −$1,180
- Tax from tax record
- −$480 /mo · $5,757/yr
- Insurance
- −$94
- HOA
- −$0
- Vacancy / Maint / Mgmt
- −$460
- Net cashflow
- $-22
Break-even live
UW: 25.0% down · 7.5% · 30yr · 1.5% tax · 5.0% vac · 8.0% maint · 8.0% mgmt
Financing live
Cash to close
- Down payment
- $56,238
- Closing costs
- $6,748
- Reserves months
- —
- Total cash needed
- —
Loan-product check · same deal, 3 products live
Conventional
25% down · 7.5% · 30yr
- Down + closing
- —
- Monthly P&I
- —
- Monthly cashflow
- —
- DSCR
- —
- Eligible?
- —
Personal DTI + credit; lowest rate.
DSCR
20% down · 8.5% · 30yr
- Down + closing
- —
- Monthly P&I
- —
- Monthly cashflow
- —
- DSCR
- —
- Eligible?
- —
No personal income docs; deal must DSCR.
Hard money
10% down · 12.0% · 12mo
- Down + closing
- —
- Monthly P&I
- —
- Monthly cashflow
- —
- DSCR
- —
- Eligible?
- —
Short-term bridge; refi at stabilization.
Rent comps 18 comps
| Address | Beds | Baths | Sqft | Rent | $/sqft | DOM | Units | Dist |
|---|---|---|---|---|---|---|---|---|
| 700 Hamilton St Unit 2 Easton, PA | 4.0 | 2.0 | 1050 | $2,000 | $1.90 | 3d | 1 | 0.04mi |
| 715 Cattell St Unit 2 Easton, PA | 3.0 | 1.0 | 1700 | $2,000 | $1.18 | 21d | 1 | 0.17mi |
| 513 Cattell St Easton, PA | 3.0 | 1.5 | 1536 | $2,300 | $1.50 | 44d | 1 | 0.23mi |
| 1065 Bushkill Dr Easton, PA | 3.0 | 1.5 | 1250 | $2,500 | $2.00 | 44d | 1 | 0.46mi |
| 909 Jackson St Unit 2 Easton, PA | 3.0 | 1.0 | 1300 | $2,350 | $1.81 | 44d | 1 | 0.86mi |
| 35 N 7th St Easton, PA | 3.0 | 1.0 | 1088 | $1,750 | $1.61 | 14d | 1 | 0.93mi |
| 204 N 9th St Easton, PA | 3.0 | 1.0 | 1450 | $1,900 | $1.31 | 3d | 1 | 0.93mi |
| 912 Spring Garden St Easton, PA | 4.0 | 2.0 | 1534 | $2,400 | $1.56 | 44d | 1 | 0.98mi |
| 35 N 9th St Easton, PA | 4.0 | 2.0 | 1512 | $2,250 | $1.49 | 3d | 1 | 1.00mi |
| 43-45 S Main St Unit 3 Phillipsburg, NJ | 3.0 | 2.0 | 1200 | $2,200 | $1.83 | 23d | 1 | 1.02mi |
| 810 Pine St Easton, PA | 3.0 | 1.0 | 1120 | $1,800 | $1.61 | 23d | 1 | 1.08mi |
| 810 Pine St Easton, PA | 3.0 | 1.0 | 1120 | $1,800 | $1.61 | 44d | 1 | 1.08mi |
| 142 S Union St Easton, PA | 3.0 | 2.0 | 1300 | $1,895 | $1.46 | 44d | 1 | 1.10mi |
| 210 Washington St Phillipsburg, NJ | 4.0 | 1.5 | 1000 | $2,300 | $2.30 | 3d | 1 | 1.25mi |
| 122 N 13th St Easton, PA | 4.0 | 3.0 | 1736 | $2,300 | $1.32 | 3d | 1 | 1.25mi |
| 510 Zucksville Rd Easton, PA | 3.0 | 2.0 | 1452 | $2,500 | $1.72 | 23d | 1 | 1.29mi |
| 1051 Washington St Easton, PA | 3.0 | 1.0 | 900 | $1,550 | $1.72 | 14d | 1 | 1.36mi |
| 1108 Butler St Unit 7 Easton, PA | 3.0 | 1.0 | 1146 | $1,575 | $1.37 | 44d | 1 | 1.45mi |
Listing history 12 events
-
2026-06-05status $224,950 Pending 11 DOM
-
2026-06-03days on market $224,950 Active 11 DOM
-
2026-06-02days on market $224,950 Active 10 DOM
-
2026-06-01days on market $224,950 Active 9 DOM
-
2026-05-31days on market $224,950 Active 8 DOM
-
2026-05-31days on market $224,950 Active 7 DOM
-
2026-05-14$224,950 Active
-
2002-05-02soldstatus $121,500
-
2002-04-26soldstatus $121,500
-
2002-03-05$119,000
-
1993-08-01soldstatus $87,900
-
1982-10-01soldstatus $45,000
ⓘ Source: listings_history table (triggers on properties + properties_extension) + one-shot
backfill from property_details.listing_events for pre-trigger history.
Tax reassessment forecast PA · Partial reset (capped growth)
- Current annual tax
- $5,757 · $480/mo
- Projected year-2 tax
- $5,757 · $480/mo
- Expected delta
- $0/yr ($0/mo · 0.0%)
ⓘ Screening estimate from a state-policy table — verify with the county assessor before closing.
Climate risk First Street
- Flood 1/10 Low FEMA zone X (unshaded) · 0% chance over 30 yrs
- Wildfire 1/10 Low
- Heat 5/10 Major 7 d/yr ≥100°F today · 15 d/yr by 30 yrs out
- Wind 4/10 Moderate 16% chance of damaging wind over 30 yrs
- Air quality 3/10 Moderate 3 unhealthy d/yr today · 5 by 30 yrs out
Nearby sold comps map
Loading sold comps map…
Walkable amenities ~0.75 mi
Loading nearby amenities…
Taxation est. · year 1
- Rental income
- $26,297
- − Mortgage interest
- −$12,601
- − Property taxes
- −$5,757
- − Insurance
- −$1,125
- − Repairs & maintenance
- −$2,104
- − Management
- −$2,104
- − Depreciation
- −$6,544
- Taxable loss
- −$3,937
- Est. tax savings @ 24.0%
- +$945
- After-tax cash flow
- $682/yr
For passive investors: Depreciation is non-cash, so a rental often shows a tax loss while cash-flowing — sheltering income. Rental losses are passive: they offset passive income freely, and up to $25,000/yr can offset ordinary (W-2) income if you actively participate and your MAGI is under $100k (phasing out to $0 by $150k); unused losses carry forward. On sale, claimed depreciation is recaptured at up to 25%, and gains may owe capital-gains tax (a 1031 exchange can defer both). Figures are a year-1 estimate at your 24.0% rate — not tax advice; consult a CPA.
Schools (NCES district)
- District
- Easton Area SD
- NCES district ID
- 4208850
- Math proficiency
- 31% ▼ -2.00%
- Reading proficiency
- 44% ▼ -11.00%
- Median HH income
- $61,390
- Composite
- 33.46/100
- National rank
- #5457
- State rank
- #364 of 539 in PA
Livability — Easton
- Score
- 84/100
- State rank
- #92
- US rank
- #667
Category grades
Schools grade is shown separately in the Schools card above.
Census & demographics
- Census place
- Easton, PA
- County
- Northampton County · 236,814 people
- City population
- 75,961
- Metro
- Allentown-Bethlehem-Easton, PA-NJ
- Population (ZIP)
- 45,532
- Household income
- $77,556
- Rent vs Own
- Severe rent burden
- 1590.0
Population outlook (Northampton County) Hauer SSP2
- Today (2025)
- 312,227 people
- By 2030
- 314,769 · +0.8%
- By 2040
- 316,914 · +1.5%
- By 2050
- 318,037 · +1.9%
- By 2075
- 334,003 · +7.0%
- By 2100
- 344,696 · +10.4%
Race, ethnicity, and origin ACS 2023
- Neighborhood character
- Diverse neighborhood (Simpson 0.61)
- Race & ethnicity
- White 57% Hispanic / Latino 21% Black 12% Two or more races 12% Asian 3%
- Hispanic origin (detail)
- Mexican 3% Puerto Rican 7% Dominican 3%
- Common ancestry
- Romanian 3% Polish 2% Iranian 1%
- Foreign-born
- 13% · Canada, China, Jamaica
- Languages at home
- 80% English-only · Spanish 15% Other Indo-European 1% Arabic 1%
Political lean MEDSL · Northampton
- 2024 margin
- Toss-up / Even · D 48.6% · R 50.4%
- 2008→2024 swing
- -14.1pp toward R · 2008: 12.3pp · 2024: -1.8pp
- All cycles
- 2024: R+1.8 2020: D+0.7 2016: R+3.8 2012: D+4.6 2008: D+12.3
Not yet ingested
- Civics
- —
Market trends
- HPI YoY
- ▼ -460.52%
- Current HPI
- 254.8776
- Rent YoY
- ▲ 4.94%
- Metro
- Allentown-Bethlehem-Easton, PA-NJ
- State GDP YoY
- ▲ 1.68%
- F500 in state
- 34
Industry mix (Fortune 500 HQ in PA)
| Industry | F500 HQs | Revenue |
|---|---|---|
| Healthcare | 2 | $309B |
|
||
| Insurance | 2 | $27B |
|
||
| Telecommunications / Media | 1 | $124B |
|
||
| Industrial Distribution | 1 | $22B |
|
||
| Financial Services | 1 | $20B |
|
||
| Chemicals / Materials | 1 | $18B |
|
||
Price history
+399.9% since first listed6 events — show timeline
- 2026-05-14 Listed $224,950 GLVRMLS
- 2002-05-02 Sold (Public Records) $121,500 Public Records
- 2002-04-26 Sold (MLS) $121,500 GLVRMLS
- 2002-03-05 Listed $119,000 GLVRMLS
- 1993-08-01 Sold (Public Records) $87,900 Public Records
- 1982-10-01 Sold (Public Records) $45,000 Public Records
Property tax history
+1.3%/yrLatest (2026): $5,757 · +2.3% YoY. Source: county tax records.
Cash-flow waterfall
monthlySold comps — $/sqft
last 12 mo · ≤1 miLoading sold comps…