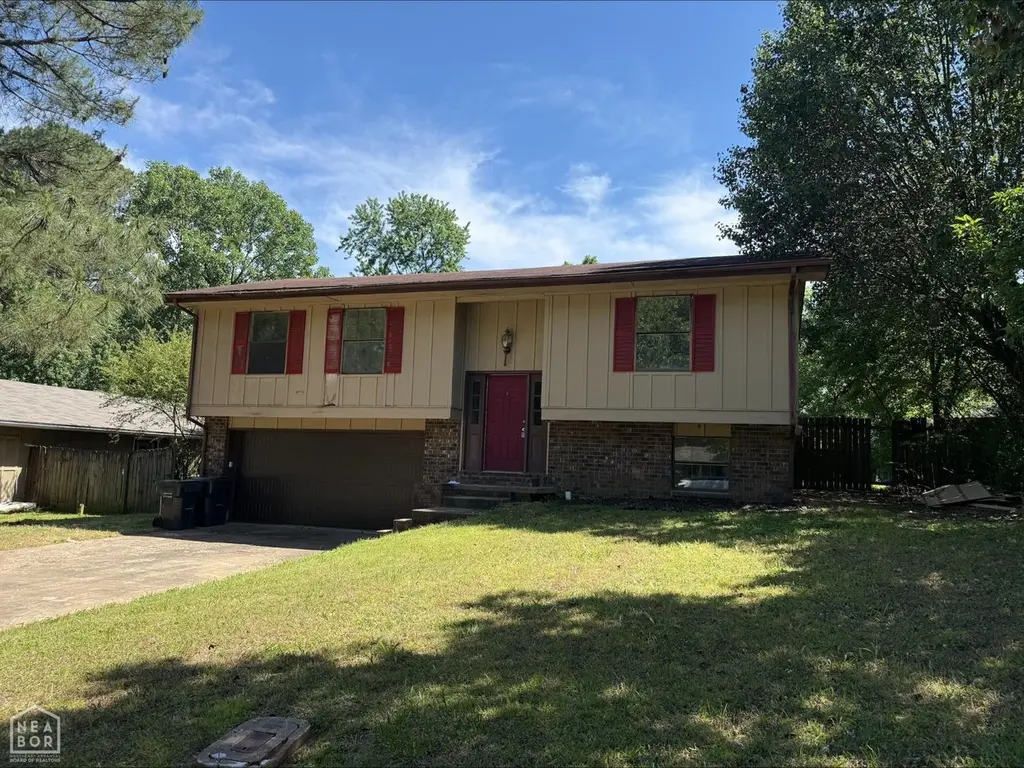
2009 Timberridge Dr · Jonesboro, AR
Flood risk 1/10 · Minimal
- FEMA flood zone
- X
- Chance of flooding over 30 yrs
- 0.0%
- Est. flood insurance / yr
- $507 – $1,088
Fire risk 3/10 · Minor
- Est. fire insurance / yr
- $1,499 – $2,785
Heat risk 5/10 · Moderate
- Hot days now (above 109°F)
- 7 days/yr
- Hot days in 30 yrs
- 20 days/yr
Wind risk 3/10 · Minor
- Chance of severe wind over 30 yrs
- 7.0%
Air-quality risk 1/10 · Minimal
- Unhealthy air days now
- 0 days/yr
- Unhealthy air days in 30 yrs
- 0 days/yr
Risk factors via First Street. Map © Google.
Why this score? — see what drove the C- grade
The composite is a weighted blend of 9 inputs, each scored 0–100. Each bar is that input's sub-score; the figure is the points it added to the 100-point composite (weight × sub-score).
- Cash flow +20.1/30.0
- ARV discount +11.6/15.0
- DSCR +6.4/10.0
- 1% rule +4.0/10.0
- Rent growth +3.4/5.0
- Livability +3.2/5.0
- Condition / age +2.5/5.0
- Schools +2.3/10.0
- Appreciation +0.0/10.0
$159,900
🖨 Deal sheet 📄 Offer letter ✓ Due diligence
Listing remarks
Three Bedroom Two bath home near annie camp school, New garage door, new carpet and fresh paint. Would me a great first home or investment. Split level with all bedrooms on main level, Second living area could be possible 4th bedroom. 2 car garage.
Key facts
- Fresh paint
- New carpet
- Second living area
Tags
Property features AI
Exterior
- Parking: Two-car garage
- Utilities: Public water; Public sewer
- Home design: Single-family residence; Residential property; Located in the Scenic Hills subdivision
- Construction: Wood siding
- Exterior features: Deck
Interior
- Flooring: Carpet; Vinyl
- Bathrooms: Two full bathrooms
- Heating & cooling: Central heating; Central air; Ceiling fans
- Interior features: Carpet and vinyl flooring; Living room fireplace; Partial, partially finished basement
Neighborhood map
What this means for you Summary
Snapshot
- This is a 3-bed/2.0-bath single-family listed at $160k.
Deal economics
- At list price, monthly cash flow is $199 ($2k/yr) — positive.
- The deal already cash-flows at list — no discount required.
- To meet the 1% rule (rent ≥ 1% of price), the offer needs to be $144k (9.9% below list).
- Recommended offer: $144k (9.9% below list) — sets the bar for 1% rule.
- Cap rate 7.8% vs local median 4.4% in Jonesboro — top-decile yield for the area; either an underpriced asset or a hidden risk that comps aren't pricing in. Stress-test before assuming the spread holds.
Location & tenants
- Location reads 65/100 on livability (#145 in AR) — a middle-class / working-renter tenant base. Strengths: cost of living A+, housing A+, health & safety A+; Watch: crime F, amenities F, commute F.
- Jonesboro School District (urban): math 28% / reading 28% proficiency, ranked #169 of 238 in AR (top 71%) — low school quality limits family demand, transient renter base, plan for 1-2y turnover; 67% free/reduced lunch — lower-income household profile, screen leases tightly.
- Zoned schools: Annie Camp Jr. High School (math 22% / reading 34%, grade F, #150 of 201 statewide, top 76%, 784 students, 100% FRL); The Academies At Jonesboro High School (math 16% / reading 27%, grade F, #225 of 292 statewide, top 78%, 1,386 students, 100% FRL) — zoned schools average 100% FRL vs 67% district-wide (33 pts higher); higher-poverty schools than district average — tighter screening recommended.
- Market conditions: Rents rising (+3.6%/yr); 295 active listings in the ZIP; 926 units permitted in Craighead County in 2024 (69 in 5+ unit buildings).
- This rent runs 38% of the median local income ($45k/yr) — at the standard rent-burdened threshold; future hikes will face affordability resistance.
Forward outlook
- Local home prices are declining (-3.0%/yr); year-one equity from $1k of loan paydown is wiped out by about $5k of value loss. Plan a longer hold.
- Craighead County population projected at +38% by 2050 — long-run rental-demand tailwind backs the buy-and-hold thesis.
Negotiation context
- It's been on market 23 days — a 2% lower offer ($158k) is reasonable based on typical stale-listing flexibility.
- 2 sale attempts since 8y ago with the ask held roughly flat each time — persistent listings suggest the price (not the market) is what's stuck; bring a comps-based counter.
- Current owner paid $89k; list at $160k implies a 80% gain — meaningful room to come down on a strong offer.
Risks & watch-outs
- Climate carrying-cost: extreme-heat days projected 7→20/yr by 2055 (HVAC capex compounding) — expect insurance premiums to compound above CPI over the hold.
Questions for the listing agent
- Is there a deadline driving the sale (1031 exchange, divorce, estate, relocation)? That informs how much negotiation room exists.
- Schools are D-rated, which usually means shorter tenancies and higher turnover. Who's the typical renter profile here, and what's been the actual vacancy rate?
- Crime grade is F in this area — have there been break-ins, vandalism, or insurance claims at this property in the last 3 years? What carrier currently insures it and at what premium?
- What's the average days-on-market for RENTAL listings here right now (not sales)? A rising rental-DOM trend means longer vacancies and softer asking-rent achievability than the comps imply.
- What's the recent tenant-quality profile in this submarket — average credit score on applications, eviction rate, late-payment / NSF rate, and stable-employment percentage? A property-management company in the area should have these aggregated.
- How much new for-sale + rental construction is in the pipeline within 1–3 miles? Heavy new supply typically softens prices + rents 12–24 months out; constrained supply supports both.
Investment metrics
- 1% rule
- 0.90% ✗
- Cap rate
- 7.78%
- Cash-on-cash
- 5.33%
- DSCR
- 1.24
- GRM
- 9.2
CMA / ARV
- ARV (on-the-fly)
- $176,040
- Comps found
- 12
Show comp detail 12 sales within ~0.75 mi
| Address | Dist | Beds/Ba | Sqft | Sold | Price | $/sf | Match |
|---|---|---|---|---|---|---|---|
| 1208 Stonemill Dr | 0.10mi | 3/2.0 | 1,688 (+4%) | 9mo | $191,900 | $114 | 82 |
| 2101 Tanglewood Dr | 0.28mi | 3/2.0 | 1,694 (+4%) | 1mo | $160,000 | $94 | 79 |
| 2011 Timberridge Dr | 0.01mi | 3/2.0 | 1,397 (-14%) | 2mo | $172,000 | $123 | 74 |
| 2009 Mount Vernon Dr | 0.14mi | 4/2.0 (+1) | 1,554 (-5%) | 8mo | $174,925 | $113 | 74 |
| 2009 Munos Ln | 0.41mi | 4/2.0 (+1) | 1,674 (+3%) | 3mo | $199,900 | $119 | 69 |
| 1305 Holly St | 0.66mi | 3/2.0 | 1,618 (-1%) | 1mo | $164,900 | $102 | 67 |
| 1703 W Oak Ave | 0.40mi | 3/2.0 | 1,696 (+4%) | 11mo | $115,000 | $68 | 65 |
| 2010 Emerald Cv | 0.30mi | 3/2.0 | 1,404 (-14%) | 4mo | $150,000 | $107 | 60 |
| 2617 W Matthews Ave | 0.65mi | 3/2.5 | 1,702 (+4%) | 4mo | $168,000 | $99 | 57 |
| 1507 Dupwe Dr | 0.26mi | 4/2.0 (+1) | 1,818 (+12%) | 10mo | $215,000 | $118 | 55 |
| 1712 Merrill Cv | 0.47mi | 3/2.0 | 1,806 (+11%) | 6mo | $185,000 | $102 | 55 |
| 1209 Hester | 0.47mi | 3/2.0 | 1,404 (-14%) | 8mo | $152,000 | $108 | 48 |
Match score weights: distance 35% · size 25% · config 20% · recency 20%. Top-matched comps best support the ARV.
Projected returns pro-forma
-3.0% appreciation · 3.64% rent growth · sell at horizon
- IRR
- -7.5%
- Equity multiple
- 0.72×
- Total profit
- $-12,400
- Equity at exit
- $23,842
- IRR
- 2.8%
- Equity multiple
- 1.20×
- Total profit
- $9,059
- Equity at exit
- $13,825
Cash invested: $44,772 (down + closing). Projections, not guarantees.
Landlord ↔ Tenant lean methodology
- Overall (STATE)
- 92 Strongly Landlord-Friendly
- State Arkansas
- 92 Strongly Landlord-Friendly · R+14
- County
- — inherits STATE
- City
- — inherits STATE
ZIP-level market 72401
- Home prices YoY
- -34.2%
- Rents YoY
- 3.6%
- Active inventory
- 295
- Price-to-rent
- 9.2×
Monthly cashflow live
- Estimated rent
- $1,441 medium interval (Pro) →
- Mortgage (P&I)
- −$839
- Tax from tax record
- −$35 /mo · $416/yr
- Insurance
- −$67
- HOA
- −$0
- Vacancy / Maint / Mgmt
- −$303
- Net cashflow
- $199
Break-even live
UW: 25.0% down · 7.5% · 30yr · 1.5% tax · 5.0% vac · 8.0% maint · 8.0% mgmt
Financing live
Cash to close
- Down payment
- $39,975
- Closing costs
- $4,797
- Reserves months
- —
- Total cash needed
- —
Loan-product check · same deal, 3 products live
Conventional
25% down · 7.5% · 30yr
- Down + closing
- —
- Monthly P&I
- —
- Monthly cashflow
- —
- DSCR
- —
- Eligible?
- —
Personal DTI + credit; lowest rate.
DSCR
20% down · 8.5% · 30yr
- Down + closing
- —
- Monthly P&I
- —
- Monthly cashflow
- —
- DSCR
- —
- Eligible?
- —
No personal income docs; deal must DSCR.
Hard money
10% down · 12.0% · 12mo
- Down + closing
- —
- Monthly P&I
- —
- Monthly cashflow
- —
- DSCR
- —
- Eligible?
- —
Short-term bridge; refi at stabilization.
Listing history 20 events
-
2026-06-19days on market $159,900 Active 23 DOM
-
2026-06-18days on market $159,900 Active 22 DOM
-
2026-06-17days on market $159,900 Active 21 DOM
-
2026-06-16days on market $159,900 Active 20 DOM
-
2026-06-15days on market $159,900 Active 19 DOM
-
2026-06-14days on market $159,900 Active 17 DOM
-
2026-06-13days on market $159,900 Active 16 DOM
-
2026-06-10days on market $159,900 Active 14 DOM
-
2026-06-09days on market $159,900 Active 13 DOM
-
2026-06-08days on market $159,900 Active 12 DOM
-
2026-06-07days on market $159,900 Active 11 DOM
-
2026-06-05days on market $159,900 Active 8 DOM
-
2026-06-02days on market $159,900 Active 6 DOM
-
2026-06-01days on market $159,900 Active 5 DOM
-
2026-05-31days on market $159,900 Active 4 DOM
-
2026-05-30days on market $159,900 Active 3 DOM
-
2026-05-27$159,900 Active
-
2018-01-11$106,900
-
2010-06-21soldstatus $89,000
-
1995-02-28soldstatus $39,000
ⓘ Source: listings_history table (triggers on properties + properties_extension) + one-shot
backfill from property_details.listing_events for pre-trigger history.
Tax reassessment forecast AR · Resets to sale price
- Current annual tax
- $416 · $35/mo
- Projected year-2 tax
- $1,023 · $85/mo
- Expected delta
- +$608/yr (+$51/mo · 146.2%)
ⓘ Screening estimate from a state-policy table — verify with the county assessor before closing.
Climate risk First Street
- Flood 1/10 Low FEMA zone X · 0% chance over 30 yrs
- Wildfire 3/10 Moderate
- Heat 5/10 Major 7 d/yr ≥109°F today · 20 d/yr by 30 yrs out
- Wind 3/10 Moderate 7% chance of damaging wind over 30 yrs
- Air quality 1/10 Low 0 unhealthy d/yr today · 0 by 30 yrs out
Nearby sold comps map
Loading sold comps map…
Walkable amenities ~0.75 mi
Loading nearby amenities…
Taxation est. · year 1
- Rental income
- $17,294
- − Mortgage interest
- −$8,957
- − Property taxes
- −$416
- − Insurance
- −$800
- − Repairs & maintenance
- −$1,384
- − Management
- −$1,384
- − Depreciation
- −$4,652
- Taxable loss
- −$297
- Est. tax savings @ 24.0%
- +$71
- After-tax cash flow
- $2,456/yr
For passive investors: Depreciation is non-cash, so a rental often shows a tax loss while cash-flowing — sheltering income. Rental losses are passive: they offset passive income freely, and up to $25,000/yr can offset ordinary (W-2) income if you actively participate and your MAGI is under $100k (phasing out to $0 by $150k); unused losses carry forward. On sale, claimed depreciation is recaptured at up to 25%, and gains may owe capital-gains tax (a 1031 exchange can defer both). Figures are a year-1 estimate at your 24.0% rate — not tax advice; consult a CPA.
Schools (NCES district)
- District
- Jonesboro School District
- NCES district ID
- 0508280
- Math proficiency
- 28% ▼ -9.00%
- Reading proficiency
- 28% ▼ -8.00%
- Median HH income
- $34,347
- Composite
- 23.06/100
- National rank
- #7967
- State rank
- #169 of 238 in AR
Livability — Jonesboro
- Score
- 65/100
- State rank
- #145
- US rank
- #12692
Category grades
Schools grade is shown separately in the Schools card above.
Census & demographics
- Census place
- Jonesboro, AR
- County
- Craighead County · 97,185 people
- City population
- 91,245
- Metro
- Jonesboro, AR
- Population (ZIP)
- 42,602
- Household income
- $45,329
- Rent vs Own
- Severe rent burden
- 2606.0
Population outlook (Craighead County) Hauer SSP2
- Today (2025)
- 122,235 people
- By 2030
- 131,338 · +7.4%
- By 2040
- 149,862 · +22.6%
- By 2050
- 168,034 · +37.5%
- By 2075
- 208,094 · +70.2%
- By 2100
- 233,251 · +90.8%
Race, ethnicity, and origin ACS 2023
- Neighborhood character
- Diverse neighborhood (Simpson 0.56)
- Race & ethnicity
- White 60% Black 26% Hispanic / Latino 9% Two or more races 7%
- Hispanic origin (detail)
- Mexican 8%
- Common ancestry
- Slovak 2% Italian 1% Lithuanian 1%
- Foreign-born
- 4% · Canada
- Languages at home
- 92% English-only · Spanish 7%
Political lean MEDSL · Craighead
- 2024 margin
- Solid R (+37.4) · D 30.1% · R 67.5% · Other 2.4%
- 2008→2024 swing
- -12.9pp toward R · 2008: -24.5pp · 2024: -37.4pp
- All cycles
- 2024: R+37.4 2020: R+35.4 2016: R+35.2 2012: R+31.1 2008: R+24.5
Not yet ingested
- Civics
- —
Market trends
- HPI YoY
- ▼ -108.25%
- Current HPI
- 208.2079
- Rent YoY
- ▲ 3.64%
- Metro
- Jonesboro, AR
- State GDP YoY
- ▲ 3.80%
- F500 in state
- 10
Industry mix (Fortune 500 HQ in AR)
| Industry | F500 HQs | Revenue |
|---|---|---|
| Retail | 1 | $681B |
|
||
| Food / Agriculture | 1 | $53B |
|
||
| Retail / Energy | 1 | $22B |
|
||
| Transportation / Logistics | 1 | $12B |
|
||
| Energy | 1 | $4B |
|
||
Price history
+310.0% since first listed4 events — show timeline
- 2026-05-27 Listed $159,900 NEABOR MLS
- 2018-01-11 Listed $106,900 NEABOR MLS
- 2010-06-21 Sold (Public Records) $89,000 Public Records
- 1995-02-28 Sold (Public Records) $39,000 Public Records
Property tax history
-1.7%/yrLatest (2025): $416 · -12.2% YoY. Source: county tax records.
Cash-flow waterfall
monthlySold comps — $/sqft
last 12 mo · ≤1 miLoading sold comps…