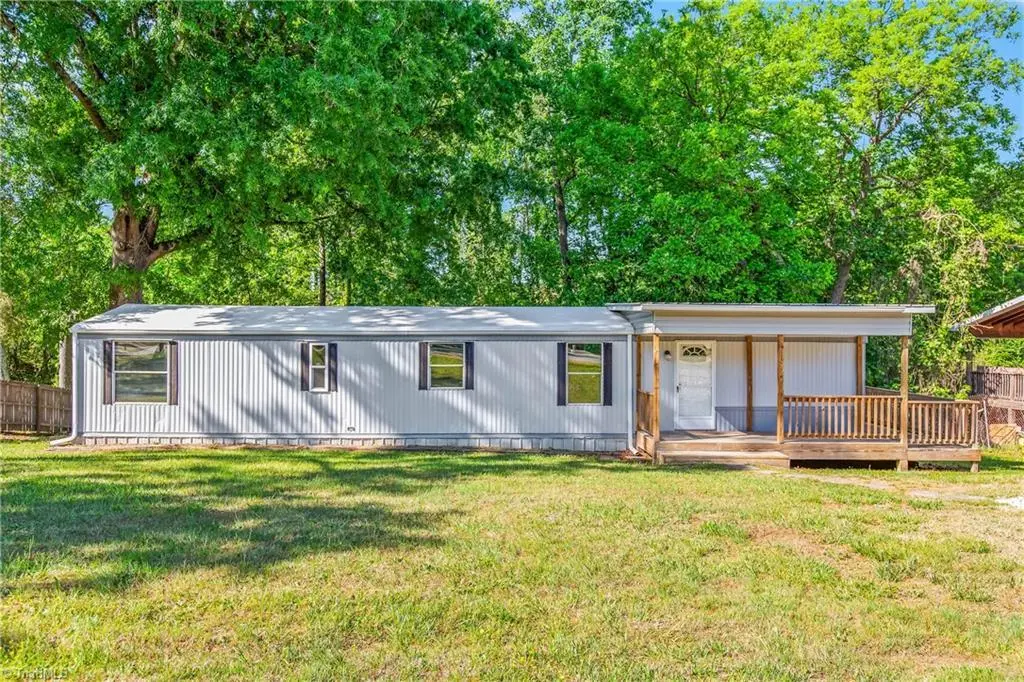
189 Sunset Dr · High Point, NC
Flood risk 1/10 · Minimal
- FEMA flood zone
- X (unshaded)
- Chance of flooding over 30 yrs
- 0.0%
- Est. flood insurance / yr
- $507 – $1,088
Fire risk 3/10 · Minor
- Est. fire insurance / yr
- $906 – $1,684
Heat risk 6/10 · Moderate
- Hot days now (above 103°F)
- 7 days/yr
- Hot days in 30 yrs
- 17 days/yr
Wind risk 4/10 · Minor
- Chance of severe wind over 30 yrs
- 14.0%
Air-quality risk 2/10 · Minimal
- Unhealthy air days now
- 1 days/yr
- Unhealthy air days in 30 yrs
- 1 days/yr
Risk factors via First Street. Map © Google.
Why this score? — see what drove the D+ grade
The composite is a weighted blend of 9 inputs, each scored 0–100. Each bar is that input's sub-score; the figure is the points it added to the 100-point composite (weight × sub-score).
- Cash flow +15.0/30.0
- ARV discount +7.3/15.0
- DSCR +4.6/10.0
- Schools +4.3/10.0
- 1% rule +4.1/10.0
- Livability +3.9/5.0
- Rent growth +3.6/5.0
- Condition / age +2.5/5.0
- Appreciation +0.0/10.0
$135,000
🖨 Deal sheet (PDF) 📄 Offer letter ✓ Due diligence
Listing remarks
Charming, remodeled 2-bedroom, 1-bath home with fresh paint, updated flooring, and a stylish modern kitchen. Relax on the covered front porch or unwind on the back deck in the peaceful backyard setting. The roof was recently sealed, and the home has been consistently well maintained.
Key facts
- Covered front porch
- Recently sealed roof
- Back deck
Tags
Property features AI
Finance
- HOA & community: Association name: High Point (no association required)
Exterior
- Parking: Driveway with gravel surface
- Utilities: Septic tank sewer; Electric water heater; Public water source
- Home design: Manufactured home (single wide); One story; Built in 1983; Existing structure
- Construction: Aluminum siding; Vinyl siding; Crawl space foundation
- Exterior features: No fencing; Public-maintained road access; Public water
Interior
- Kitchen: Electric water heater (appliance)
- Bedrooms: Living space includes main-level living room (one main room listed)
- Bathrooms: 1 full bathroom
- Heating & cooling: Heat pump heating; Electric heating; Central air conditioning
- Interior features: Primary bedroom on the main level
- Laundry & utility: Electric water heater
Neighborhood map
What this means for you Summary
Snapshot
- This is a 3-bed/2.0-bath single-family listed at $135k.
Deal economics
- At list price, monthly cash flow is $43 ($514/yr) — positive.
- The deal already cash-flows at list — no discount required.
- To meet the 1% rule (rent ≥ 1% of price), the offer needs to be $124k (8.5% below list).
- Recommended offer: $124k (8.5% below list) — sets the bar for 1% rule.
- Cap rate 6.7% vs local median 4.0% in High Point — top-decile yield for the area; either an underpriced asset or a hidden risk that comps aren't pricing in. Stress-test before assuming the spread holds.
Location & tenants
- Location reads 77/100 on livability (#31 in NC, #3,084 nationally) — a middle-class / working-renter tenant base. Strengths: commute A+, cost of living A+, housing A+; Watch: schools D+, amenities D, employment D.
- Davidson County Schools (rural): math 50% / reading 50% proficiency, ranked #62 of 178 in NC (top 35%) — acceptable for families but not a draw, mixed tenant base, ~2y average lease.
- Market conditions: Rents rising fast (+4.3%/yr); 307 active listings in the ZIP; 990 units permitted in Davidson County in 2024 (54 in 5+ unit buildings).
Forward outlook
- Local home prices are declining (-3.0%/yr); year-one equity from $933 of loan paydown is wiped out by about $4k of value loss. Plan a longer hold.
- Davidson County population projected to shrink 6% by 2050 — rents likely to lag national; underwrite the cash flow, not the appreciation.
Negotiation context
- It's been on market 57 days — a 3% lower offer ($131k) is reasonable based on typical stale-listing flexibility.
- Current owner paid $8k; list at $135k implies a 1700% gain — meaningful room to come down on a strong offer.
Risks & watch-outs
- Climate carrying-cost: extreme-heat days projected 7→17/yr by 2055 (HVAC capex compounding) — expect insurance premiums to compound above CPI over the hold.
Questions for the listing agent
- It's been on market 57 days. Have you received any prior offers? Is the seller open to a 9% concession, seller financing, or rate buy-down credit?
- Is there a deadline driving the sale (1031 exchange, divorce, estate, relocation)? That informs how much negotiation room exists.
- Schools are D-rated, which usually means shorter tenancies and higher turnover. Who's the typical renter profile here, and what's been the actual vacancy rate?
- Crime grade is F in this area — have there been break-ins, vandalism, or insurance claims at this property in the last 3 years? What carrier currently insures it and at what premium?
- The area grade is low — what's the realistic commute time and amenity access for the typical tenant pool here? Any planned neighborhood developments (good or bad) we should know about?
- What's the average days-on-market for RENTAL listings here right now (not sales)? A rising rental-DOM trend means longer vacancies and softer asking-rent achievability than the comps imply.
- What's the recent tenant-quality profile in this submarket — average credit score on applications, eviction rate, late-payment / NSF rate, and stable-employment percentage? A property-management company in the area should have these aggregated.
- How much new for-sale + rental construction is in the pipeline within 1–3 miles? Heavy new supply typically softens prices + rents 12–24 months out; constrained supply supports both.
Investment metrics
- 1% rule
- 0.91% ✗
- Cap rate
- 6.67%
- Cash-on-cash
- 1.36%
- DSCR
- 1.06
- GRM
- 9.1
CMA / ARV
- ARV (on-the-fly)
- $134,302
- Comps found
- 1
Show comp detail 1 sale within ~0.75 mi
| Address | Dist | Beds/Ba | Sqft | Sold | Price | $/sf | Match |
|---|---|---|---|---|---|---|---|
| 2614 Carsten Ave | 0.45mi | 2/1.0 (-1) | 770 (+4%) | 22mo | $139,050 | $181 | 46 |
Match score weights: distance 35% · size 25% · config 20% · recency 20%. Top-matched comps best support the ARV.
Projected returns pro-forma
-3.0% appreciation · 4.34% rent growth · sell at horizon
- IRR
- -12.6%
- Equity multiple
- 0.54×
- Total profit
- $-17,441
- Equity at exit
- $20,129
- IRR
- -1.6%
- Equity multiple
- 0.88×
- Total profit
- $-4,482
- Equity at exit
- $11,672
Cash invested: $37,800 (down + closing). Projections, not guarantees.
Landlord ↔ Tenant lean methodology
- Overall (STATE)
- 85 Strongly Landlord-Friendly
- State North Carolina
- 85 Strongly Landlord-Friendly · R+3
- County
- — inherits STATE
- City
- — inherits STATE
ZIP-level market 27360
- Rents YoY
- 4.3%
- Active inventory
- 307
- Price-to-rent
- 9.1×
Monthly cashflow live
- Estimated rent
- $1,235 medium interval (Pro) →
- Mortgage (P&I)
- −$708
- Tax est. 1.5%
- −$169 /mo · $2,025/yr
- Insurance
- −$56
- HOA
- −$0
- Vacancy / Maint / Mgmt
- −$259
- Net cashflow
- $43
Break-even live
Sensitivity live
| Price | -10% $136 | -5% $89 | +0% $43 | +5% $-4 | +10% $-50 |
|---|---|---|---|---|---|
| Rent | -10% $-55 | -5% $-6 | +0% $43 | +5% $92 | +10% $140 |
| Rate | -1.0pp $111 | -0.5pp $77 | base $43 | +0.5pp $8 | +1.0pp $-28 |
UW: 25.0% down · 7.5% · 30yr · 1.5% tax · 5.0% vac · 8.0% maint · 8.0% mgmt
Financing live
Cash to close
- Down payment
- $33,750
- Closing costs
- $4,050
- Reserves months
- —
- Total cash needed
- —
Loan-product check · same deal, 3 products live
Conventional
25% down · 7.5% · 30yr
- Down + closing
- —
- Monthly P&I
- —
- Monthly cashflow
- —
- DSCR
- —
- Eligible?
- —
Personal DTI + credit; lowest rate.
DSCR
20% down · 8.5% · 30yr
- Down + closing
- —
- Monthly P&I
- —
- Monthly cashflow
- —
- DSCR
- —
- Eligible?
- —
No personal income docs; deal must DSCR.
Hard money
10% down · 12.0% · 12mo
- Down + closing
- —
- Monthly P&I
- —
- Monthly cashflow
- —
- DSCR
- —
- Eligible?
- —
Short-term bridge; refi at stabilization.
Listing history 20 events
-
2026-06-18days on market $135,000 Active 57 DOM
-
2026-06-17days on market $135,000 Active 56 DOM
-
2026-06-16days on market $135,000 Active 55 DOM
-
2026-06-15days on market $135,000 Active 54 DOM
-
2026-06-14days on market $135,000 Active 52 DOM
-
2026-06-13days on market $135,000 Active 51 DOM
-
2026-06-10days on market $135,000 Active 49 DOM
-
2026-06-09days on market $135,000 Active 48 DOM
-
2026-06-08days on market $135,000 Active 47 DOM
-
2026-06-07days on market $135,000 Active 46 DOM
-
2026-06-05days on market $135,000 Active 43 DOM
-
2026-06-03days on market $135,000 Active 42 DOM
-
2026-06-02days on market $135,000 Active 41 DOM
-
2026-06-01days on market $135,000 Active 40 DOM
-
2026-05-31days on market $135,000 Active 39 DOM
-
2026-05-31days on market $135,000 Active 38 DOM
-
2026-04-22$135,000 Active
-
2002-01-01soldstatus $7,500
-
2002-01-01soldstatus $20,000
-
2002-01-01soldstatus $9,500
ⓘ Source: listings_history table (triggers on properties + properties_extension) + one-shot
backfill from property_details.listing_events for pre-trigger history.
Climate risk First Street
- Flood 1/10 Low FEMA zone X (unshaded) · 0% chance over 30 yrs
- Wildfire 3/10 Moderate
- Heat 6/10 Major 7 d/yr ≥103°F today · 17 d/yr by 30 yrs out
- Wind 4/10 Moderate 14% chance of damaging wind over 30 yrs
- Air quality 2/10 Low 1 unhealthy d/yr today · 1 by 30 yrs out
Nearby sold comps map
Loading sold comps map…
Walkable amenities ~0.75 mi
Loading nearby amenities…
Taxation est. · year 1
- Rental income
- $14,822
- − Mortgage interest
- −$7,562
- − Property taxes
- −$2,025
- − Insurance
- −$675
- − Repairs & maintenance
- −$1,186
- − Management
- −$1,186
- − Depreciation
- −$3,927
- Taxable loss
- −$1,739
- Est. tax savings @ 24.0%
- +$417
- After-tax cash flow
- $931/yr
For passive investors: Depreciation is non-cash, so a rental often shows a tax loss while cash-flowing — sheltering income. Rental losses are passive: they offset passive income freely, and up to $25,000/yr can offset ordinary (W-2) income if you actively participate and your MAGI is under $100k (phasing out to $0 by $150k); unused losses carry forward. On sale, claimed depreciation is recaptured at up to 25%, and gains may owe capital-gains tax (a 1031 exchange can defer both). Figures are a year-1 estimate at your 24.0% rate — not tax advice; consult a CPA.
Schools (NCES district)
- District
- Davidson County Schools
- NCES district ID
- 3701140
- Math proficiency
- 50% ▲ 2.00%
- Reading proficiency
- 50% ▲ 2.00%
- Median HH income
- $49,696
- Composite
- 42.76/100
- National rank
- #3157
- State rank
- #62 of 178 in NC
Livability — High Point
- Score
- 77/100
- State rank
- #31
- US rank
- #3084
Category grades
Schools grade is shown separately in the Schools card above.
Census & demographics
- County
- Davidson County · 129,088 people
- City population
- 102,450
- Metro
- Winston-Salem, NC
- Population (ZIP)
- 49,510
- Household income
- $61,983
- Rent vs Own
- Severe rent burden
- 1052.0
Population outlook (Davidson County) Hauer SSP2
- Today (2025)
- 167,156 people
- By 2030
- 167,216 · +0.0%
- By 2040
- 164,524 · -1.6%
- By 2050
- 157,229 · -5.9%
- By 2075
- 138,084 · -17.4%
- By 2100
- 112,729 · -32.6%
Race, ethnicity, and origin ACS 2023
- Neighborhood character
- Predominantly White (71%)
- Race & ethnicity
- White 71% Hispanic / Latino 11% Black 11% Two or more races 11%
- Hispanic origin (detail)
- Mexican 7%
- Common ancestry
- Slovak 2% Serbian 1% Italian 1%
- Foreign-born
- 7% · Canada
- Languages at home
- 88% English-only · Spanish 10% Other Indo-European 1%
Political lean MEDSL · Davidson
- 2024 margin
- Solid R (+47.1) · D 25.9% · R 73.0% · Other 1.1%
- 2008→2024 swing
- -13.5pp toward R · 2008: -33.5pp · 2024: -47.1pp
- All cycles
- 2024: R+47.1 2020: R+47.5 2016: R+49.4 2012: R+40.9 2008: R+33.5
Not yet ingested
- Civics
- —
Market trends
- HPI YoY
- ▼ -146.33%
- Current HPI
- 243.0953
- Rent YoY
- ▲ 4.34%
- Metro
- Winston-Salem, NC
- State GDP YoY
- ▲ 3.28%
- F500 in state
- 26
Industry mix (Fortune 500 HQ in NC)
| Industry | F500 HQs | Revenue |
|---|---|---|
| Financial Services | 2 | $213B |
|
||
| Retail | 2 | $95B |
|
||
| Industrial Conglomerate | 1 | $38B |
|
||
| Metals / Steel | 1 | $35B |
|
||
| Utilities | 1 | $30B |
|
||
| Industrial Machinery | 1 | $19B |
|
||
Price history
+1700.0% since first listed4 events — show timeline
- 2026-04-22 Listed $135,000 Triad MLS
- 2002-01-01 Sold (Public Records) $9,500 Public Records
- 2002-01-01 Sold (Public Records) $20,000 Public Records
- 2002-01-01 Sold (Public Records) $7,500 Public Records
Property tax history
+2.5%/yrLatest (2025): $214 · +3.1% YoY. Source: county tax records.
Cash-flow waterfall
monthlySold comps — $/sqft
last 12 mo · ≤1 miLoading sold comps…