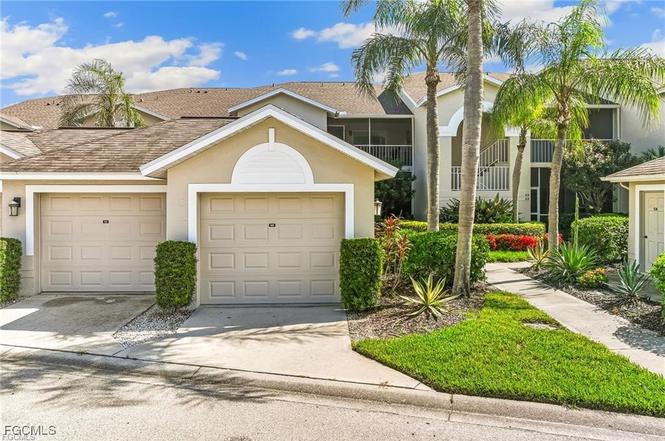
14511 Hickory Hill Ct #523 · Fort Myers, FL
Flood risk 1/10 · Minimal
- FEMA flood zone
- X (unshaded)
- Chance of flooding over 30 yrs
- 0.0%
- Est. flood insurance / yr
- $507 – $1,088
Fire risk 4/10 · Minor
- Est. fire insurance / yr
- $947 – $1,759
Heat risk 10/10 · Severe
- Hot days now (above 107°F)
- 7 days/yr
- Hot days in 30 yrs
- 29 days/yr
Wind risk 10/10 · Severe
- Chance of severe wind over 30 yrs
- 99.0%
Air-quality risk 2/10 · Minimal
- Unhealthy air days now
- 1 days/yr
- Unhealthy air days in 30 yrs
- 1 days/yr
Risk factors via First Street. Map © Google.
Why this score? — see what drove the C- grade
The composite is a weighted blend of 9 inputs, each scored 0–100. Each bar is that input's sub-score; the figure is the points it added to the 100-point composite (weight × sub-score).
- Cash flow +17.1/30.0
- 1% rule +10.0/10.0
- ARV discount +7.5/15.0
- DSCR +5.3/10.0
- Livability +4.3/5.0
- Schools +4.1/10.0
- Rent growth +2.7/5.0
- Condition / age +2.5/5.0
- Appreciation +0.0/10.0
$170,000
🖨 Deal sheet 📄 Offer letter ✓ Due diligence
Listing remarks
Escape the cold and step into the vibrant, low-density lifestyle of Olde Hickory Golf & Country Club, Fort Myers' premier private bundled golf community. This impeccable 2nd-floor, turnkey furnished veranda unit is the perfect space to start your 2026 Florida life. Property Highlights: Move-In Ready: Turnkey furnished for a seamless transition. Panoramic Views: Enjoy breathtaking, two-sided screened lanai views of the lush, championship Ron Garl-designed golf course. Ideal Layout: Two comfortable bedrooms and two full bathrooms, separated by open living and dining areas, offer privacy and ample space. Active Lifestyle: Olde Hickory is an incredibly active community with no waitlist f
Key facts
- Fitness center
- Golf membership
- Turnkey furnished
Tags
Neighborhood map
What this means for you Summary
Snapshot
- This is a 2-bed/2.0-bath condo listed at $170k.
Deal economics
- At list price, monthly cash flow is $119 ($1k/yr) — positive.
- The deal already cash-flows at list — no discount required.
- Meets the 1% rule at list price ($3k rent vs $170k).
- Recommended offer: $155k (9.0% below list) — sets the bar for market timing.
- Cap rate 7.1% vs local median 3.0% in Fort Myers — top-decile yield for the area; either an underpriced asset or a hidden risk that comps aren't pricing in. Stress-test before assuming the spread holds.
Location & tenants
- Location reads 86/100 on livability (#14 in FL, #383 nationally) — a professional / high-income tenant draw. Strengths: amenities A+, commute A+, housing A+.
- Lee (suburban): math 47% / reading 50% proficiency, ranked #42 of 73 in FL (top 58%) — families likely to look elsewhere, expect single-tenant / working-renter base with shorter leases.
- Market conditions: Rents flat; 305 active listings in the ZIP; 8 comparable units currently listed for rent nearby; rentals at typical pace (median 24d on market — plan ~3-4 weeks tenant-placement turnaround); solid renter incomes; 15,411 units permitted in Lee County in 2024 (4,686 in 5+ unit buildings).
- This rent runs 38% of the median local income ($103k/yr) — at the standard rent-burdened threshold; future hikes will face affordability resistance.
Forward outlook
- Local home prices are declining (-3.0%/yr); year-one equity from $1k of loan paydown is wiped out by about $5k of value loss. Plan a longer hold.
- Lee County population projected at +44% by 2050 — long-run rental-demand tailwind backs the buy-and-hold thesis.
Negotiation context
- It's been on market 101 days — a 9% lower offer ($155k) is reasonable based on typical stale-listing flexibility.
- 4 sale attempts; this cycle's ask has dropped $79k (32%) from the opening price — seller is motivated, your offer sets the floor, not the list.
- Current owner paid $134k; 27% above their basis — modest negotiation headroom, anchor on the comps not their cost.
Risks & watch-outs
- Watch-outs: HOA is 43% of rent.
- Climate carrying-cost: severe wind risk, 99% chance of damaging wind over 30y; extreme-heat days projected 7→29/yr by 2055 (HVAC capex compounding) — expect insurance premiums to compound above CPI over the hold.
Questions for the listing agent
- It's been on market 101 days. Have you received any prior offers? Is the seller open to a 9% concession, seller financing, or rate buy-down credit?
- What does the HOA fee cover, when was the last increase, and are there any pending special assessments or reserve-fund shortfalls?
- Any open or pending special assessments — roof, HVAC, plumbing, elevator, façade? What's the per-unit balance and payoff schedule, and is the seller paying it off at close or rolling it to the buyer?
- Why hasn't it sold? Are there any deal-killer items the seller is aware of (foundation, flood, title, zoning, code violations)?
- Is there a deadline driving the sale (1031 exchange, divorce, estate, relocation)? That informs how much negotiation room exists.
- What's the average days-on-market for RENTAL listings here right now (not sales)? A rising rental-DOM trend means longer vacancies and softer asking-rent achievability than the comps imply.
- What's the recent tenant-quality profile in this submarket — average credit score on applications, eviction rate, late-payment / NSF rate, and stable-employment percentage? A property-management company in the area should have these aggregated.
- How much new apartment / multifamily construction is in the pipeline within 1–3 miles? Heavy new supply (>2% of stock underway) typically softens rents 12–24 months out; light construction supports rent growth.
Investment metrics
- 1% rule
- 1.91% ✓
- Cap rate
- 7.13%
- Cash-on-cash
- 3.00%
- DSCR
- 1.13
- GRM
- 4.4
CMA / ARV
No comps found within radius.
Projected returns pro-forma
-3.0% appreciation · 0.94% rent growth · sell at horizon
- IRR
- -15.7%
- Equity multiple
- 0.46×
- Total profit
- $-25,739
- Equity at exit
- $25,348
- IRR
- -16.0%
- Equity multiple
- 0.26×
- Total profit
- $-35,250
- Equity at exit
- $14,698
Cash invested: $47,600 (down + closing). Projections, not guarantees.
Landlord ↔ Tenant lean methodology
- Overall (STATE)
- 87 Strongly Landlord-Friendly
- State Florida
- 87 Strongly Landlord-Friendly · R+3
- County
- — inherits STATE
- City
- — inherits STATE
ZIP-level market 33912
- Rents YoY
- 0.9%
- Active inventory
- 305
- Price-to-rent
- 4.4×
Monthly cashflow live
- Estimated rent
- $3,246 high interval (Pro) →
- Mortgage (P&I)
- −$891
- Tax from tax record
- −$73 /mo · $878/yr
- Insurance
- −$71
- HOA
- −$1,410
- Vacancy / Maint / Mgmt
- −$682
- Net cashflow
- $119
Break-even live
UW: 25.0% down · 7.5% · 30yr · 1.5% tax · 5.0% vac · 8.0% maint · 8.0% mgmt
Financing live
Cash to close
- Down payment
- $42,500
- Closing costs
- $5,100
- Reserves months
- —
- Total cash needed
- —
Loan-product check · same deal, 3 products live
Conventional
25% down · 7.5% · 30yr
- Down + closing
- —
- Monthly P&I
- —
- Monthly cashflow
- —
- DSCR
- —
- Eligible?
- —
Personal DTI + credit; lowest rate.
DSCR
20% down · 8.5% · 30yr
- Down + closing
- —
- Monthly P&I
- —
- Monthly cashflow
- —
- DSCR
- —
- Eligible?
- —
No personal income docs; deal must DSCR.
Hard money
10% down · 12.0% · 12mo
- Down + closing
- —
- Monthly P&I
- —
- Monthly cashflow
- —
- DSCR
- —
- Eligible?
- —
Short-term bridge; refi at stabilization.
Rent comps 8 comps
| Address | Beds | Baths | Sqft | Rent | $/sqft | DOM | Units | Dist |
|---|---|---|---|---|---|---|---|---|
| 14290 Hickory Links Ct #1915 Fort Myers, FL | 2.0 | 2.0 | 1243 | $4,000 | $3.22 | 23d | 1 | 0.19mi |
| 14320 Bristol Bay Pl Unit 1546395P Fort Myers, FL | 2.0 | 2.0 | 1097 | $4,032 | $3.68 | 16d | 1 | 0.53mi |
| 8500 Legends Blvd #305 Fort Myers, FL | 2.0 | 2.0 | 1096 | $3,500 | $3.19 | 23d | 1 | 0.65mi |
| 14571 Legends Blvd N Fort Myers, FL | 2.0 | 2.0 | 1132 | $2,175 | $1.92 | 23d | 2 | 0.73mi |
| 14571 Legends Blvd N #106 Fort Myers, FL | 2.0 | 2.0 | 1095 | $2,500 | $2.28 | 3d | 1 | 0.81mi |
| 14122 Danpark Loop Fort Myers, FL | 2.0 | 2.0 | 1209 | $1,800 | $1.49 | 1d | 1 | 0.91mi |
| 15091 Bagpipe Way #101 Fort Myers, FL | 2.0 | 2.0 | 1120 | $7,000 | $6.25 | 23d | 1 | 1.37mi |
| 15121 Bagpipe Way #202 Fort Myers, FL | 2.0 | 2.0 | 1110 | $7,400 | $6.67 | 10d | 1 | 1.43mi |
HOA detail condo
- Monthly dues
- $1,410 · $16,920/yr
- Likely covers
- cable
- Assessments
- None detected in remarks — confirm with the listing agent.
Listing history 14 events
-
2026-04-20status Pending
-
2026-03-28price $170,000
-
2026-03-20status Active
-
2026-03-16status Pending
-
2026-03-13status Active
-
2026-03-11status Pending
-
2026-03-02price $185,000
-
2026-02-10price $215,000
-
2026-01-03$249,000 Active
-
2025-12-03historical
-
2025-10-09$259,000 Active
-
2002-08-22soldstatus $134,000
-
1999-02-22soldstatus $110,000
-
1992-12-30soldstatus $121,800
ⓘ Source: listings_history table (triggers on properties + properties_extension) + one-shot
backfill from property_details.listing_events for pre-trigger history.
Tax reassessment forecast FL · Resets to sale price
- Current annual tax
- $878 · $73/mo
- Projected year-2 tax
- $1,411 · $118/mo
- Expected delta
- +$533/yr (+$44/mo · 60.7%)
ⓘ Screening estimate from a state-policy table — verify with the county assessor before closing.
Climate risk First Street
- Flood 1/10 Low FEMA zone X (unshaded) · 0% chance over 30 yrs
- Wildfire 4/10 Moderate
- Heat 10/10 Extreme 7 d/yr ≥107°F today · 29 d/yr by 30 yrs out
- Wind 10/10 Extreme 99% chance of damaging wind over 30 yrs
- Air quality 2/10 Low 1 unhealthy d/yr today · 1 by 30 yrs out
Nearby sold comps map
Loading sold comps map…
Walkable amenities ~0.75 mi
Loading nearby amenities…
Taxation est. · year 1
- Rental income
- $38,952
- − Mortgage interest
- −$9,523
- − Property taxes
- −$878
- − Insurance
- −$850
- − Repairs & maintenance
- −$3,116
- − Management
- −$3,116
- − HOA
- −$16,920
- − Depreciation
- −$4,945
- Taxable loss
- −$396
- Est. tax savings @ 24.0%
- +$95
- After-tax cash flow
- $1,522/yr
For passive investors: Depreciation is non-cash, so a rental often shows a tax loss while cash-flowing — sheltering income. Rental losses are passive: they offset passive income freely, and up to $25,000/yr can offset ordinary (W-2) income if you actively participate and your MAGI is under $100k (phasing out to $0 by $150k); unused losses carry forward. On sale, claimed depreciation is recaptured at up to 25%, and gains may owe capital-gains tax (a 1031 exchange can defer both). Figures are a year-1 estimate at your 24.0% rate — not tax advice; consult a CPA.
Schools (NCES district)
- District
- Lee
- NCES district ID
- 1201080
- Math proficiency
- 47% ▼ -11.00%
- Reading proficiency
- 50% ▼ -4.00%
- Median HH income
- $49,518
- Composite
- 41.49/100
- National rank
- #3458
- State rank
- #42 of 73 in FL
Livability — Fort Myers
- Score
- 86/100
- State rank
- #14
- US rank
- #383
Category grades
Schools grade is shown separately in the Schools card above.
Census & demographics
- County
- Lee County · 788,662 people
- City population
- 278,598
- Metro
- Cape Coral-Fort Myers, FL
- Population (ZIP)
- 19,533
- Household income
- $103,194
- Rent vs Own
- Severe rent burden
- 292.0
Population outlook (Lee County) Hauer SSP2
- Today (2025)
- 871,946 people
- By 2030
- 955,468 · +9.6%
- By 2040
- 1,113,587 · +27.7%
- By 2050
- 1,256,891 · +44.1%
- By 2075
- 1,560,270 · +78.9%
- By 2100
- 1,726,848 · +98.0%
Race, ethnicity, and origin ACS 2023
- Neighborhood character
- Predominantly White (85%)
- Race & ethnicity
- White 85% Hispanic / Latino 8% Two or more races 7% Black 3% Asian 2%
- Hispanic origin (detail)
- Puerto Rican 2% Cuban 3%
- Common ancestry
- Romanian 4% Italian 3% Slovak 2%
- Foreign-born
- 11% · Canada, China, South Korea
- Languages at home
- 87% English-only · Spanish 7% French/Haitian/Cajun 2% Other Indo-European 2%
Political lean MEDSL · Lee
- 2024 margin
- Strong R (+28.4) · D 35.5% · R 63.9%
- 2008→2024 swing
- -18.0pp toward R · 2008: -10.4pp · 2024: -28.4pp
- All cycles
- 2024: R+28.4 2020: R+19.2 2016: R+20.4 2012: R+16.6 2008: R+10.4
Not yet ingested
- Civics
- —
Market trends
- HPI YoY
- ▼ -180.73%
- Current HPI
- 226.7102
- Rent YoY
- ▲ 0.94%
- Metro
- Cape Coral-Fort Myers, FL
- State GDP YoY
- ▲ 3.28%
- F500 in state
- 36
Industry mix (Fortune 500 HQ in FL)
| Industry | F500 HQs | Revenue |
|---|---|---|
| Industrial Technology | 2 | $29B |
|
||
| Insurance | 2 | $17B |
|
||
| Retail | 1 | $60B |
|
||
| Technology Distribution | 1 | $58B |
|
||
| Homebuilding | 1 | $35B |
|
||
| Technology Manufacturing | 1 | $35B |
|
||
Price history
+39.6% since first listed14 events — show timeline
- 2026-04-20 Pending — FORTMLS
- 2026-03-28 Price Changed $170,000 FORTMLS
- 2026-03-20 Relisted — FORTMLS
- 2026-03-16 Pending — FORTMLS
- 2026-03-13 Relisted — FORTMLS
- 2026-03-11 Pending — FORTMLS
- 2026-03-02 Price Changed $185,000 FORTMLS
- 2026-02-10 Price Changed $215,000 FORTMLS
- 2026-01-03 Listed $249,000 FORTMLS
- 2025-12-03 Listing Removed — FORTMLS
- 2025-10-09 Listed $259,000 FORTMLS
- 2002-08-22 Sold (Public Records) $134,000 Public Records
- 1999-02-22 Sold (Public Records) $110,000 Public Records
- 1992-12-30 Sold (Public Records) $121,800 Public Records
Property tax history
+0.3%/yrLatest (2025): $878 · +4.2% YoY. Source: county tax records.
Cash-flow waterfall
monthlySold comps — $/sqft
last 12 mo · ≤1 miLoading sold comps…