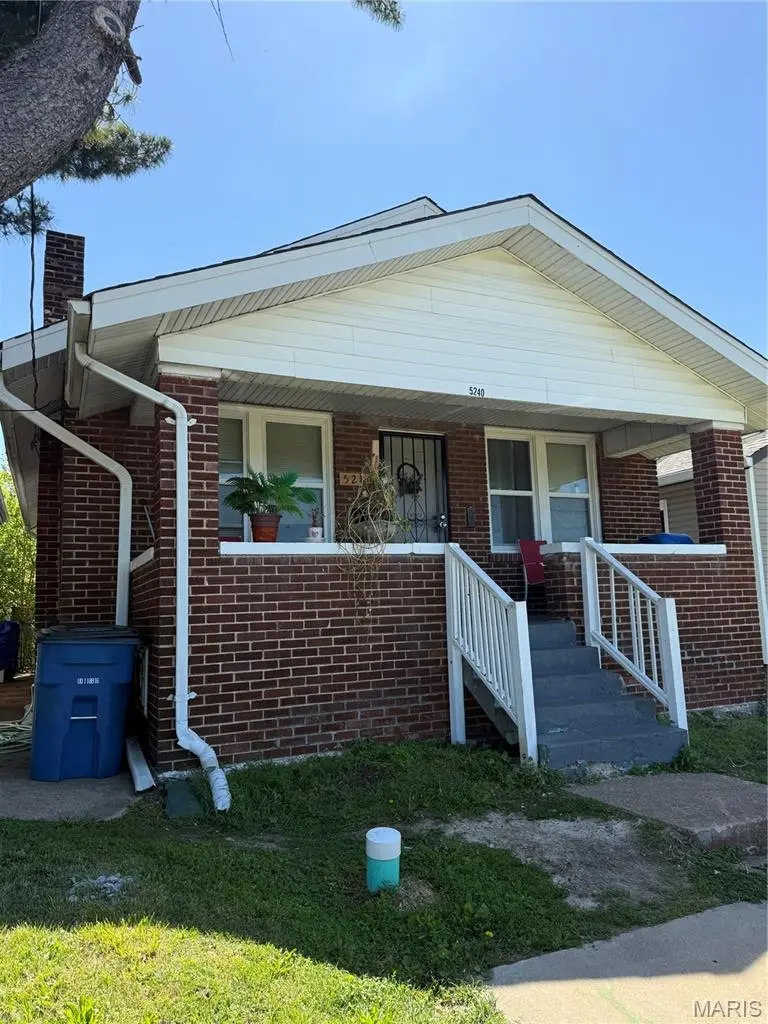
5240 Helen Ave · Jennings, MO
Flood risk 1/10 · Minimal
- FEMA flood zone
- X (unshaded)
- Chance of flooding over 30 yrs
- 0.0%
- Est. flood insurance / yr
- $473 – $860
Fire risk 1/10 · Minimal
- Est. fire insurance / yr
- $1,054 – $1,958
Heat risk 5/10 · Moderate
- Hot days now (above 107°F)
- 7 days/yr
- Hot days in 30 yrs
- 21 days/yr
Wind risk 2/10 · Minimal
- Chance of severe wind over 30 yrs
- 1.0%
Air-quality risk 4/10 · Minor
- Unhealthy air days now
- 4 days/yr
- Unhealthy air days in 30 yrs
- 5 days/yr
Risk factors via First Street. Map © Google.
Why this score? — see what drove the B- grade
The composite is a weighted blend of 9 inputs, each scored 0–100. Each bar is that input's sub-score; the figure is the points it added to the 100-point composite (weight × sub-score).
- Cash flow +30.0/30.0
- 1% rule +10.0/10.0
- DSCR +10.0/10.0
- Appreciation +6.9/10.0
- Rent growth +3.7/5.0
- Livability +3.4/5.0
- Condition / age +2.5/5.0
- Schools +1.1/10.0
- ARV discount +0.0/15.0
$72,000
🖨 Deal sheet 📄 Offer letter ✓ Due diligence
Listing remarks
Investor Special – Tenant in Place & Room to Add Value! This income-producing 2-bedroom, 1-bath home is a great opportunity for investors seeking both immediate cash flow and future upside. Currently rented at $800/month, there's room to increase rent with minor updates—making this the perfect value-add property. The home has solid bones and great potential for improvements that could boost both rental income and long-term value. Located in a desirable area with strong rental demand, this property is a smart addition to any portfolio. Don’t miss your chance to secure a property with steady income and growth potential!
Key facts
- 3,841 sq ft lot
- Built 1929
- Listed 35 days
Property features AI
Finance
- Other: Living area listed as 922 (public records); Lot size approximately 0.0882 acres; No pool
- Financial info: Lease not considered
- HOA & community: HOA information unknown — please confirm
Exterior
- Parking: Driveway parking; Off-street parking
- Utilities: Public water; Public sewer; Electric service by Ameren; Cable available
- Home design: Single-family residence; Private ownership; One story
- Construction: Brick construction; Architectural shingle roof
- Exterior features: Front yard; Back yard; Level lot
Interior
- Bedrooms: 2 bedrooms (both on the main level)
- Bathrooms: 1 full bathroom (on the main level)
- Heating & cooling: Forced air heating (natural gas); Central air conditioning
- Interior features: Unfinished basement; Basement present
Neighborhood map
What this means for you Summary
Snapshot
- This is a 2-bed/1.0-bath single-family listed at $72k.
Deal economics
- At list price, monthly cash flow is $427 ($5k/yr) — positive.
- The deal already cash-flows at list — no discount required.
- Meets the 1% rule at list price ($1k rent vs $72k).
- Recommended offer: $70k (3.0% below list) — sets the bar for market timing.
Location & tenants
- Location reads 67/100 on livability (#208 in MO) — a middle-class / working-renter tenant base. Strengths: cost of living A+, commute A-, housing A-; Watch: crime F, amenities F, employment F.
- Jennings (suburban): math 8% / reading 20% proficiency, ranked #315 of 324 in MO (top 97%) — low school quality limits family demand, transient renter base, plan for 1-2y turnover; 86% free/reduced lunch — lower-income household profile, screen leases tightly.
- Zoned schools: Fairview Primary (math 34% / reading 34%, grade F, #676 of 1,115 statewide, top 66%, 267 students, 100% FRL); Jennings High (math 8% / reading 17%, grade F, #497 of 521 statewide, top 96%, 691 students, 100% FRL).
- Market conditions: Rents rising fast (+5.0%/yr); 372 active listings in the ZIP; 40 comparable units currently listed for rent nearby; rentals at typical pace (median 24d on market — plan ~3-4 weeks tenant-placement turnaround); lower-income renter base — watch delinquency; 920 units permitted in St. Louis County in 2024 (250 in 5+ unit buildings).
- This rent runs 33% of the median local income ($41k/yr) — at the standard rent-burdened threshold; future hikes will face affordability resistance.
Forward outlook
- In year one you build about $3k of equity ($498 loan paydown + $3k appreciation (3.8% local appreciation)).
- At projected returns (3.8% appreciation + 5.0% rent growth), your $20k cash investment doubles in ~3 years — after that, you're playing with house money.
- By year 10, paydown + projected appreciation supports a ~$31k cash-out refi (75% LTV) — recoverable capital for the next deal without selling this one.
Negotiation context
- It's been on market 35 days — a 3% lower offer ($70k) is reasonable based on typical stale-listing flexibility.
- Current owner paid $27k; list at $72k implies a 167% gain — meaningful room to come down on a strong offer.
Risks & watch-outs
- Watch-outs: built in 1929 — expect roof / HVAC / electrical / plumbing capex.
- Climate carrying-cost: extreme-heat days projected 7→21/yr by 2055 (HVAC capex compounding) — expect insurance premiums to compound above CPI over the hold.
Questions for the listing agent
- It's been on market 35 days. Have you received any prior offers? Is the seller open to a 3% concession, seller financing, or rate buy-down credit?
- Built in 1929 — when were the roof, HVAC, electrical panel, plumbing, and water heater last replaced?
- Is there a deadline driving the sale (1031 exchange, divorce, estate, relocation)? That informs how much negotiation room exists.
- Schools are D-rated, which usually means shorter tenancies and higher turnover. Who's the typical renter profile here, and what's been the actual vacancy rate?
- Crime grade is F in this area — have there been break-ins, vandalism, or insurance claims at this property in the last 3 years? What carrier currently insures it and at what premium?
- What's the average days-on-market for RENTAL listings here right now (not sales)? A rising rental-DOM trend means longer vacancies and softer asking-rent achievability than the comps imply.
- What's the recent tenant-quality profile in this submarket — average credit score on applications, eviction rate, late-payment / NSF rate, and stable-employment percentage? A property-management company in the area should have these aggregated.
- How much new for-sale + rental construction is in the pipeline within 1–3 miles? Heavy new supply typically softens prices + rents 12–24 months out; constrained supply supports both.
Investment metrics
- 1% rule
- 1.58% ✓
- Cap rate
- 13.41%
- Cash-on-cash
- 25.43%
- DSCR
- 2.13
- GRM
- 5.3
CMA / ARV
- ARV (median comp)
- $57,717
- List price
- $72,000
- Delta
- 24.75%
- Verdict
- OVERPRICED
- Comps
- 20 within 1.0 mi
Show comp detail 12 sales within ~0.75 mi
| Address | Dist | Beds/Ba | Sqft | Sold | Price | $/sf | Match |
|---|---|---|---|---|---|---|---|
| 5218 Fletcher St | 0.49mi | 2/1.0 | 918 (-0%) | 2mo | $75,000 | $82 | 75 |
| 5220 Fletcher St | 0.49mi | 2/1.0 | 918 (-0%) | 3mo | $64,900 | $71 | 74 |
| 7041 Garesche Ave | 0.32mi | 2/1.0 | 864 (-6%) | 3mo | $39,900 | $46 | 72 |
| 6705 Kenwood Dr | 0.52mi | 2/1.0 | 912 (-1%) | 2mo | $78,900 | $87 | 72 |
| 6331 Saloma Ave | 0.29mi | 3/1.5 (+1) | 1,008 (+9%) | 1mo | $80,000 | $79 | 63 |
| 5617 Janet Ave | 0.58mi | 3/1.0 (+1) | 909 (-1%) | 4mo | $39,900 | $44 | 62 |
| 5712 Floy Ave | 0.74mi | 2/1.0 | 966 (+5%) | 1mo | $62,000 | $64 | 57 |
| 7133 Beulah Ave | 0.35mi | 3/1.0 (+1) | 1,039 (+13%) | 1mo | $70,000 | $67 | 57 |
| 6635 Donald St | 0.69mi | 2/1.0 | 875 (-5%) | 4mo | $95,900 | $110 | 56 |
| 4419 June Ave | 0.53mi | 2/1.5 | 816 (-12%) | 4mo | $57,500 | $70 | 51 |
| 5709 Goodfellow Blvd | 0.74mi | 2/1.0 | 1,020 (+11%) | 4mo | $19,900 | $20 | 45 |
| 4135 Begg Blvd | 0.72mi | 2/1.0 | 810 (-12%) | 2mo | $34,900 | $43 | 44 |
Match score weights: distance 35% · size 25% · config 20% · recency 20%. Top-matched comps best support the ARV.
Projected returns pro-forma
3.79% appreciation · 4.97% rent growth · sell at horizon
- IRR
- 34.4%
- Equity multiple
- 3.05×
- Total profit
- $41,245
- Equity at exit
- $35,625
- IRR
- 34.8%
- Equity multiple
- 6.39×
- Total profit
- $108,684
- Equity at exit
- $57,576
Cash invested: $20,160 (down + closing). Projections, not guarantees.
Landlord ↔ Tenant lean methodology
- Overall (STATE)
- 81 Strongly Landlord-Friendly
- State Missouri
- 81 Strongly Landlord-Friendly · R+10
- County
- — inherits STATE
- City
- — inherits STATE
ZIP-level market 63136
- Home prices YoY
- 0.9%
- Rents YoY
- 5.0%
- Active inventory
- 372
- Price-to-rent
- 5.3×
Monthly cashflow live
- Estimated rent
- $1,138 high interval (Pro) →
- Mortgage (P&I)
- −$378
- Tax from tax record
- −$64 /mo · $768/yr
- Insurance
- −$30
- HOA
- −$0
- Vacancy / Maint / Mgmt
- −$239
- Net cashflow
- $427
Break-even live
UW: 25.0% down · 7.5% · 30yr · 1.5% tax · 5.0% vac · 8.0% maint · 8.0% mgmt
Financing live
Cash to close
- Down payment
- $18,000
- Closing costs
- $2,160
- Reserves months
- —
- Total cash needed
- —
Loan-product check · same deal, 3 products live
Conventional
25% down · 7.5% · 30yr
- Down + closing
- —
- Monthly P&I
- —
- Monthly cashflow
- —
- DSCR
- —
- Eligible?
- —
Personal DTI + credit; lowest rate.
DSCR
20% down · 8.5% · 30yr
- Down + closing
- —
- Monthly P&I
- —
- Monthly cashflow
- —
- DSCR
- —
- Eligible?
- —
No personal income docs; deal must DSCR.
Hard money
10% down · 12.0% · 12mo
- Down + closing
- —
- Monthly P&I
- —
- Monthly cashflow
- —
- DSCR
- —
- Eligible?
- —
Short-term bridge; refi at stabilization.
Rent comps 40 comps
| Address | Beds | Baths | Sqft | Rent | $/sqft | DOM | Units | Dist |
|---|---|---|---|---|---|---|---|---|
| 5361 Wilborn Dr Saint Louis, MO | 3.0 | 1.0 | 900 | $1,420 | $1.58 | 17d | 1 | 0.20mi |
| 5415 Hamilton Ave Unit Labs Jennings, MO | 2.0 | 1.0 | 864 | $1,100 | $1.27 | 23d | 1 | 0.25mi |
| 5439 Hodiamont Ave Saint Louis, MO | 2.0 | 1.0 | 770 | $950 | $1.23 | 17d | 1 | 0.30mi |
| 7036 Garesche Ave Saint Louis, MO | 2.0 | 1.0 | 864 | $950 | $1.10 | 17d | 1 | 0.32mi |
| 7024 Idlewild Ave Saint Louis, MO | 2.0 | 1.0 | 588 | $995 | $1.69 | 43d | 1 | 0.35mi |
| 6150 Sherry Ave Saint Louis, MO | 2.0 | 1.0 | 1032 | $896 | $0.87 | 23d | 1 | 0.35mi |
| 6153 Laura Ave Saint Louis, MO | 2.0 | 1.0 | 834 | $1,000 | $1.20 | 23d | 1 | 0.35mi |
| 7131 Garesche Ave Saint Louis, MO | 2.0 | 1.0 | 918 | $1,090 | $1.19 | 3d | 1 | 0.41mi |
| 7160 Beulah Ave Saint Louis, MO | 2.0 | 1.0 | 784 | $1,059 | $1.35 | 43d | 1 | 0.46mi |
| 7030 Emma Ave Saint Louis, MO | 2.0 | 1.0 | 801 | $1,350 | $1.69 | 43d | 1 | 0.47mi |
| 5225 Fletcher St Saint Louis, MO | 3.0 | 2.0 | 918 | $1,295 | $1.41 | 23d | 1 | 0.54mi |
| 5936 Theodore Ave Saint Louis, MO | 3.0 | 2.0 | 1008 | $1,350 | $1.34 | 43d | 1 | 0.60mi |
| 5546 Floy Ave Saint Louis, MO | 2.0 | 2.0 | 850 | $1,273 | $1.50 | 20d | 1 | 0.62mi |
| 5635 Hodiamont Ave Saint Louis, MO | 2.0 | 1.0 | 580 | $899 | $1.55 | 20d | 1 | 0.63mi |
| 5637 Jennings Station Rd Saint Louis, MO | 3.0 | 1.0 | 1116 | $895 | $0.80 | 43d | 1 | 0.66mi |
| 5516 Fairridge Ct Saint Louis, MO | 2.0 | 1.0 | 1110 | $995 | $0.90 | 23d | 1 | 0.66mi |
| 5654 Acme Ave Saint Louis, MO | 2.0 | 1.0 | 968 | $325 | $0.34 | 21d | 1 | 0.68mi |
| 5574 Era Ave Saint Louis, MO | 3.0 | 1.0 | 850 | $1,400 | $1.65 | 11d | 1 | 0.69mi |
| 5662 Wilborn Dr Saint Louis, MO | 1.0 | 1.0 | 768 | $850 | $1.11 | 23d | 1 | 0.69mi |
| 5721 Floy Ave Saint Louis, MO | 2.0 | 1.0 | 1032 | $1,120 | $1.09 | 23d | 1 | 0.72mi |
| 5741 Floy Ave Saint Louis, MO | 2.0 | 1.0 | 1000 | $1,100 | $1.10 | 23d | 1 | 0.76mi |
| 7218 Albright Ave Saint Louis, MO | 2.0 | 1.0 | 1100 | $980 | $0.89 | 23d | 1 | 0.77mi |
| 5931 Emma Ave Saint Louis, MO | 2.0 | 1.0 | 880 | $1,200 | $1.36 | 43d | 1 | 0.78mi |
| 5756 Floy Ave Saint Louis, MO | 2.0 | 1.0 | 1080 | $995 | $0.92 | 43d | 1 | 0.80mi |
| 7304 Albright Ave Saint Louis, MO | 2.0 | 1.0 | 800 | $1,100 | $1.38 | 43d | 1 | 0.82mi |
| 5615 Beldon Dr Saint Louis, MO | 2.0 | 1.0 | 850 | $950 | $1.12 | 43d | 1 | 0.83mi |
| 7315 Albright Ave Saint Louis, MO | 3.0 | 1.0 | 888 | $1,150 | $1.30 | 43d | 1 | 0.85mi |
| 4719 Plover Ave Saint Louis, MO | 2.0 | 1.0 | 744 | $995 | $1.34 | 4d | 1 | 0.86mi |
| 7142 Lamont Dr Saint Louis, MO | 2.0 | 1.0 | 750 | $1,100 | $1.47 | 17d | 1 | 0.88mi |
| 4715 Thrush Ave Unit 24 St. Louis, MO | 2.0 | 1.0 | 900 | $1,350 | $1.50 | 23d | 1 | 0.93mi |
| 7431 Esterbrook Dr Saint Louis, MO | 2.0 | 1.0 | 792 | $1,350 | $1.70 | 43d | 1 | 0.97mi |
| 5640 Sapphire Ave Saint Louis, MO | 2.0 | 1.0 | 900 | $1,100 | $1.22 | 43d | 1 | 0.97mi |
| 5932 Floy Ave Saint Louis, MO | 3.0 | 1.0 | 1080 | $1,373 | $1.27 | 20d | 1 | 0.99mi |
| 7205 Calvin Ave Saint Louis, MO | 3.0 | 1.0 | 832 | $750 | $0.90 | 43d | 1 | 1.00mi |
| 5955 Floy Ave Saint Louis, MO | 2.0 | 1.0 | 1032 | $1,050 | $1.02 | 2d | 1 | 1.01mi |
| 8502 Dianthus Ln Saint Louis, MO | 2.0 | 1.0 | 1072 | $1,175 | $1.10 | 23d | 1 | 1.04mi |
| 7414 Pleaseway Dr Saint Louis, MO | 2.0 | 1.0 | 768 | $1,100 | $1.43 | 43d | 1 | 1.09mi |
| 8527 Dianthus Ln Saint Louis, MO | 3.0 | 1.0 | 976 | $1,295 | $1.33 | 43d | 1 | 1.10mi |
| 7420 Pleaseway Dr Saint Louis, MO | 2.0 | 1.0 | 952 | $1,250 | $1.31 | 21d | 1 | 1.11mi |
| 8344 Eton Pl Saint Louis, MO | 2.0 | 1.0 | 750 | $895 | $1.19 | 3d | 1 | 1.12mi |
Listing history 23 events
-
2026-06-18days on market $72,000 Active 35 DOM
-
2026-06-17days on market $72,000 Active 34 DOM
-
2026-06-16days on market $72,000 Active 33 DOM
-
2026-06-15days on market $72,000 Active 32 DOM
-
2026-06-13days on market $72,000 Active 30 DOM
-
2026-06-09days on market $72,000 Active 26 DOM
-
2026-06-08days on market $72,000 Active 25 DOM
-
2026-06-07days on market $72,000 Active 24 DOM
-
2026-06-03days on market $72,000 Active 20 DOM
-
2026-06-02days on market $72,000 Active 19 DOM
-
2026-06-01days on market $72,000 Active 18 DOM
-
2026-05-31days on market $72,000 Active 17 DOM
-
2026-05-14$72,000 Active 648-char remark
-
2022-09-07soldstatus $27,000
-
2010-07-02soldstatus $76,000
-
2001-11-02soldstatus $17,500
-
2001-09-07soldstatus $24,900
-
2000-06-02soldstatus $48,000
-
1999-03-03soldstatus $16,200
-
1998-05-12soldstatus $39,450
-
1998-03-01soldstatus
-
1992-02-11soldstatus $33,500
-
1987-12-01soldstatus $32,000
ⓘ Source: listings_history table (triggers on properties + properties_extension) + one-shot
backfill from property_details.listing_events for pre-trigger history.
Tax reassessment forecast MO · Resets to sale price
- Current annual tax
- $768 · $64/mo
- Projected year-2 tax
- $768 · $64/mo
- Expected delta
- $0/yr ($0/mo · 0.0%)
ⓘ Screening estimate from a state-policy table — verify with the county assessor before closing.
Climate risk First Street
- Flood 1/10 Low FEMA zone X (unshaded) · 0% chance over 30 yrs
- Wildfire 1/10 Low
- Heat 5/10 Major 7 d/yr ≥107°F today · 21 d/yr by 30 yrs out
- Wind 2/10 Low 100% chance of damaging wind over 30 yrs
- Air quality 4/10 Moderate 4 unhealthy d/yr today · 5 by 30 yrs out
Nearby sold comps map
Loading sold comps map…
Walkable amenities ~0.75 mi
Loading nearby amenities…
Taxation est. · year 1
- Rental income
- $13,653
- − Mortgage interest
- −$4,033
- − Property taxes
- −$768
- − Insurance
- −$360
- − Repairs & maintenance
- −$1,092
- − Management
- −$1,092
- − Depreciation
- −$2,095
- Taxable income
- $4,214
- Est. tax owed @ 24.0%
- −$1,011
- After-tax cash flow
- $4,116/yr
For passive investors: Depreciation is non-cash, so a rental often shows a tax loss while cash-flowing — sheltering income. Rental losses are passive: they offset passive income freely, and up to $25,000/yr can offset ordinary (W-2) income if you actively participate and your MAGI is under $100k (phasing out to $0 by $150k); unused losses carry forward. On sale, claimed depreciation is recaptured at up to 25%, and gains may owe capital-gains tax (a 1031 exchange can defer both). Figures are a year-1 estimate at your 24.0% rate — not tax advice; consult a CPA.
Schools (NCES district)
- District
- Jennings
- NCES district ID
- 2916290
- Math proficiency
- 8% ▼ -16.00%
- Reading proficiency
- 20% ▼ -4.00%
- Median HH income
- $30,595
- Composite
- 11.04/100
- National rank
- #9739
- State rank
- #315 of 324 in MO
Livability — Jennings
- Score
- 67/100
- State rank
- #208
- US rank
- #10499
Category grades
Schools grade is shown separately in the Schools card above.
Census & demographics
- Census place
- Jennings, MO
- County
- Saint Louis County · 888,823 people
- Metro
- St. Louis, MO-IL
- Population (ZIP)
- 40,929
- Household income
- $41,154
- Rent vs Own
- Severe rent burden
- 3085.0
Population outlook (St. Louis County) Hauer SSP2
- Today (2025)
- 1,025,227 people
- By 2030
- 1,028,023 · +0.3%
- By 2040
- 1,020,940 · -0.4%
- By 2050
- 1,007,280 · -1.8%
- By 2075
- 987,277 · -3.7%
- By 2100
- 921,984 · -10.1%
Race, ethnicity, and origin ACS 2023
- Neighborhood character
- Predominantly Black (90%)
- Race & ethnicity
- Black 90% White 5% Two or more races 3%
- Foreign-born
- 1% · Canada
Political lean MEDSL · St. Louis
- 2024 margin
- Strong D (+23.4) · D 60.8% · R 37.4% · Other 1.7%
- 2008→2024 swing
- +3.5pp toward D · 2008: 19.9pp · 2024: 23.4pp
- All cycles
- 2024: D+23.4 2020: D+24.0 2016: D+16.2 2012: D+13.7 2008: D+19.9
Not yet ingested
- Civics
- —
Market trends
- HPI YoY
- ▲ 3.79%
- Current HPI
- 420.28
- Rent YoY
- ▲ 4.97%
- Metro
- St. Louis, MO-IL
- State GDP YoY
- ▲ 1.84%
- F500 in state
- 20
Industry mix (Fortune 500 HQ in MO)
| Industry | F500 HQs | Revenue |
|---|---|---|
| Healthcare | 1 | $163B |
|
||
| Insurance | 1 | $21B |
|
||
| Industrial Technology | 1 | $17B |
|
||
| Retail | 1 | $16B |
|
||
| Industrial Distribution | 1 | $10B |
|
||
| Utilities | 1 | $9B |
|
||
Price history
+125.0% since first listed11 events — show timeline
- 2026-05-14 Listed $72,000 MARIS as Distributed by MLS Grid
- 2022-09-07 Sold (Public Records) $27,000 Public Records
- 2010-07-02 Sold (Public Records) $76,000 Public Records
- 2001-11-02 Sold (Public Records) $17,500 Public Records
- 2001-09-07 Sold (Public Records) $24,900 Public Records
- 2000-06-02 Sold (Public Records) $48,000 Public Records
- 1999-03-03 Sold (Public Records) $16,200 Public Records
- 1998-05-12 Sold (Public Records) $39,450 Public Records
- 1998-03-01 Sold (Public Records) — Public Records
- 1992-02-11 Sold (Public Records) $33,500 Public Records
- 1987-12-01 Sold (Public Records) $32,000 Public Records
Property tax history
-1.6%/yrLatest (2022): $768 · +1.5% YoY. Source: county tax records.
Cash-flow waterfall
monthlySold comps — $/sqft
last 12 mo · ≤1 miLoading sold comps…