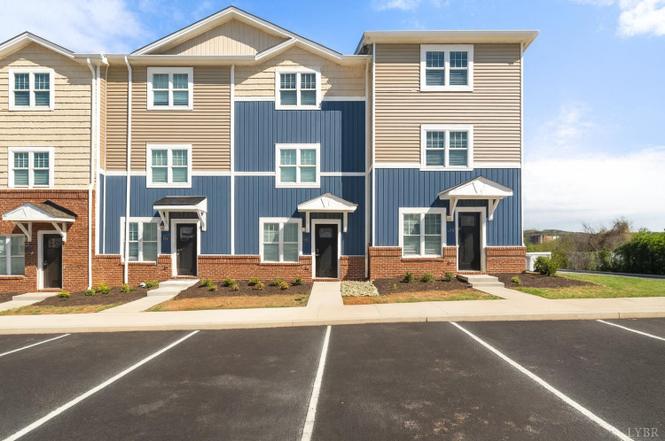
1600 Wards Ferry Rd · Lynchburg, VA
Flood risk 1/10 · Minimal
- FEMA flood zone
- X (unshaded)
- Chance of flooding over 30 yrs
- 0.0%
- Est. flood insurance / yr
- $507 – $1,088
Fire risk 4/10 · Minor
- Est. fire insurance / yr
- $666 – $1,236
Heat risk 6/10 · Moderate
- Hot days now (above 101°F)
- 7 days/yr
- Hot days in 30 yrs
- 19 days/yr
Wind risk 2/10 · Minimal
- Chance of severe wind over 30 yrs
- 2.0%
Air-quality risk 2/10 · Minimal
- Unhealthy air days now
- 0 days/yr
- Unhealthy air days in 30 yrs
- 1 days/yr
Risk factors via First Street. Map © Google.
Why this score? — see what drove the D+ grade
The composite is a weighted blend of 9 inputs, each scored 0–100. Each bar is that input's sub-score; the figure is the points it added to the 100-point composite (weight × sub-score).
- Cash flow +15.2/30.0
- ARV discount +7.5/15.0
- DSCR +4.7/10.0
- Livability +4.5/5.0
- Schools +4.0/10.0
- 1% rule +3.8/10.0
- Rent growth +3.8/5.0
- Condition / age +2.5/5.0
- Appreciation +0.0/10.0
$249,900
🖨 Deal sheet 📄 Offer letter ✓ Due diligence
Listing remarks
OPEN HOUSE Sun 2-4 pm. The lowest priced 4 bedroom townhomes in all of Lynchburg with $4,000 paid in closing costs by seller! Model is 901. A Once-in-a-Lifetime Investment Opportunity Near LU! You've never seen anything like this hit the market near Liberty University before. Low $80/mo HOA dues. Built in 2012, these are immaculate 4-bedroom 2.5 bath townhomes. Just one block from both LU and CVCC. Buy one or buy 2 or more! Nearly 600 sq ft per floor, spread across three private levels. No Parking Worries Ever, every unit includes 2 assigned parking spaces, plus there are over 100 additional spots throughout the complex. Low $80/month POA fees covering trash, snow removal, mowing, and land
Key facts
- One block from lu
- Low hoa dues
- $80 HOA
Tags
Neighborhood map
What this means for you Summary
Snapshot
- This is a 4-bed/2.5-bath land listed at $250k.
Deal economics
- At list price, monthly cash flow is $87 ($1k/yr) — positive.
- The deal already cash-flows at list — no discount required.
- To meet the 1% rule (rent ≥ 1% of price), the offer needs to be $221k (11.7% below list).
- Recommended offer: $221k (11.7% below list) — sets the bar for 1% rule.
- Cap rate 6.7% vs local median 4.0% in Lynchburg — top-decile yield for the area; either an underpriced asset or a hidden risk that comps aren't pricing in. Stress-test before assuming the spread holds.
Location & tenants
- Location reads 91/100 on livability (#1 in VA, #58 nationally) — a professional / high-income tenant draw. Strengths: amenities A+, commute A+, cost of living A+; Watch: crime C-, employment D+.
- Lynchburg City Public School District (urban): math 36% / reading 61% proficiency, ranked #104 of 131 in VA (top 79%) — families likely to look elsewhere, expect single-tenant / working-renter base with shorter leases; 61% free/reduced lunch — lower-income household profile, screen leases tightly.
- Zoned schools: Sandusky Elementary (math 47% / reading 67%, grade C+, #597 of 1,108 statewide, top 57%, 352 students, 91% FRL); Heritage High (math 32% / reading 77%, grade C-, #281 of 319 statewide, top 90%, 1,073 students, 94% FRL) — zoned schools average 92% FRL vs 61% district-wide (32 pts higher); higher-poverty schools than district average — tighter screening recommended.
- Market conditions: Rents rising fast (+5.1%/yr); 318 active listings in the ZIP; 11 comparable units currently listed for rent nearby; rentals at typical pace (median 21d on market — plan ~3-4 weeks tenant-placement turnaround); 472 units permitted in Lynchburg city in 2024 (240 in 5+ unit buildings).
- This rent runs 38% of the median local income ($69k/yr) — at the standard rent-burdened threshold; future hikes will face affordability resistance.
Forward outlook
- Local home prices are declining (-3.0%/yr); year-one equity from $2k of loan paydown is wiped out by about $7k of value loss. Plan a longer hold.
- Lynchburg County population projected at +37% by 2050 — long-run rental-demand tailwind backs the buy-and-hold thesis.
Negotiation context
- Only 1 days on market — expect competitive offers; lowballing is unlikely to land.
- 9 sale attempts with the ask held roughly flat each time — persistent listings suggest the price (not the market) is what's stuck; bring a comps-based counter.
- Current owner paid $10k; list at $250k implies a 2523% gain — meaningful room to come down on a strong offer.
Risks & watch-outs
- Climate carrying-cost: extreme-heat days projected 7→19/yr by 2055 (HVAC capex compounding) — expect insurance premiums to compound above CPI over the hold.
Questions for the listing agent
- What does the HOA fee cover, when was the last increase, and are there any pending special assessments or reserve-fund shortfalls?
- Is there a deadline driving the sale (1031 exchange, divorce, estate, relocation)? That informs how much negotiation room exists.
- Schools are A-rated — typically a magnet for longer-tenancy family renters. What's the average tenant stay here, and is there a school-zone premium baked into asking?
- The area grade is low — what's the realistic commute time and amenity access for the typical tenant pool here? Any planned neighborhood developments (good or bad) we should know about?
- What's the average days-on-market for RENTAL listings here right now (not sales)? A rising rental-DOM trend means longer vacancies and softer asking-rent achievability than the comps imply.
- What's the recent tenant-quality profile in this submarket — average credit score on applications, eviction rate, late-payment / NSF rate, and stable-employment percentage? A property-management company in the area should have these aggregated.
- How much new for-sale + rental construction is in the pipeline within 1–3 miles? Heavy new supply typically softens prices + rents 12–24 months out; constrained supply supports both.
Investment metrics
- 1% rule
- 0.88% ✗
- Cap rate
- 6.71%
- Cash-on-cash
- 1.49%
- DSCR
- 1.07
- GRM
- 9.4
CMA / ARV
No comps found within radius.
Projected returns pro-forma
-3.0% appreciation · 5.11% rent growth · sell at horizon
- IRR
- -11.7%
- Equity multiple
- 0.57×
- Total profit
- $-30,203
- Equity at exit
- $37,261
- IRR
- 0.2%
- Equity multiple
- 1.02×
- Total profit
- $1,250
- Equity at exit
- $21,607
Cash invested: $69,972 (down + closing). Projections, not guarantees.
Landlord ↔ Tenant lean methodology
- Overall (STATE)
- 55 Moderately Landlord-Leaning
- State Virginia
- 55 Moderately Landlord-Leaning · D+2
- County
- — inherits STATE
- City
- — inherits STATE
ZIP-level market 24502
- Rents YoY
- 5.1%
- Active inventory
- 318
- Price-to-rent
- 9.4×
Monthly cashflow live
- Estimated rent
- $2,205 high interval (Pro) →
- Mortgage (P&I)
- −$1,311
- Tax from tax record
- −$161 /mo · $1,932/yr
- Insurance
- −$104
- HOA
- −$80
- Vacancy / Maint / Mgmt
- −$463
- Net cashflow
- $87
Break-even live
UW: 25.0% down · 7.5% · 30yr · 1.5% tax · 5.0% vac · 8.0% maint · 8.0% mgmt
Financing live
Cash to close
- Down payment
- $62,475
- Closing costs
- $7,497
- Reserves months
- —
- Total cash needed
- —
Loan-product check · same deal, 3 products live
Conventional
25% down · 7.5% · 30yr
- Down + closing
- —
- Monthly P&I
- —
- Monthly cashflow
- —
- DSCR
- —
- Eligible?
- —
Personal DTI + credit; lowest rate.
DSCR
20% down · 8.5% · 30yr
- Down + closing
- —
- Monthly P&I
- —
- Monthly cashflow
- —
- DSCR
- —
- Eligible?
- —
No personal income docs; deal must DSCR.
Hard money
10% down · 12.0% · 12mo
- Down + closing
- —
- Monthly P&I
- —
- Monthly cashflow
- —
- DSCR
- —
- Eligible?
- —
Short-term bridge; refi at stabilization.
Rent comps 11 comps
| Address | Beds | Baths | Sqft | Rent | $/sqft | DOM | Units | Dist |
|---|---|---|---|---|---|---|---|---|
| 1600 Wards Ferry Rd #1207 Lynchburg, VA | 4.0 | 4.5 | 1728 | $2,600 | $1.50 | 44d | 1 | 0.01mi |
| 1600 Wards Ferry Rd #907 Lynchburg, VA | 4.0 | 2.5 | 1782 | $1,895 | $1.06 | 44d | 1 | 0.01mi |
| 124 Palmer Dr Lynchburg, VA | 5.0 | 3.0 | 1250 | $2,600 | $2.08 | 21d | 1 | 0.65mi |
| 1816 Wards Ferry Rd Lynchburg, VA | 3.0 | 3.5 | 1432 | $825 | $0.58 | 44d | 1 | 0.68mi |
| 110 Aaron Pl #611 Lynchburg, VA | 3.0 | 2.5 | 1490 | $1,925 | $1.29 | 21d | 1 | 0.88mi |
| 110 Aaron Pl #605 Lynchburg, VA | 3.0 | 2.0 | 1517 | $1,795 | $1.18 | 13d | 1 | 0.88mi |
| 217 Bentley Grove Way Lynchburg, VA | 5.0 | 3.0 | 2536 | $3,495 | $1.38 | 21d | 1 | 0.98mi |
| 5900 Edgewood Ave Lynchburg, VA | 3.0 | 1.0 | 1528 | $1,400 | $0.92 | 13d | 1 | 1.05mi |
| 152 Montview Forest Dr Lynchburg, VA | 3.0 | 2.0 | 1400 | $1,545 | $1.10 | 13d | 1 | 1.05mi |
| 556 Leesville Rd #306 Lynchburg, VA | 3.0 | 3.0 | 1520 | $2,100 | $1.38 | 44d | 1 | 1.11mi |
| 556 Leesville Rd Lynchburg, VA | 3.0 | 2.5 | 1600 | $1,695 | $1.06 | 13d | 1 | 1.11mi |
HOA detail
- Monthly dues
- $80 · $960/yr
- Likely covers
- trashsnow removalparking
Listing history 20 events
-
2026-01-20status Active
-
2025-12-07status Pending
-
2025-12-07$249,900 Active
-
2025-12-02status Pending
-
2025-12-01$249,900 Active
-
2025-11-23status Pending
-
2025-11-21$249,900 Active
-
2025-10-16historical $1,995
-
2025-09-13$1,995
-
2025-09-13historical $1,995
-
2025-07-30$1,995
-
2025-06-18historical $1,195
-
2025-06-12soldstatus $9,529
-
2025-06-07$1,195
-
2025-04-20historical $1,795
-
2025-04-12$350,000 Active
-
2025-04-06$1,795
-
2012-04-19soldstatus $960,000
-
2010-04-12soldstatus $2,409,600
-
2006-11-21soldstatus $748,650
ⓘ Source: listings_history table (triggers on properties + properties_extension) + one-shot
backfill from property_details.listing_events for pre-trigger history.
Tax reassessment forecast VA · Resets to sale price
- Current annual tax
- $1,932 · $161/mo
- Projected year-2 tax
- $2,049 · $171/mo
- Expected delta
- +$117/yr (+$10/mo · 6.1%)
ⓘ Screening estimate from a state-policy table — verify with the county assessor before closing.
Climate risk First Street
- Flood 1/10 Low FEMA zone X (unshaded) · 0% chance over 30 yrs
- Wildfire 4/10 Moderate
- Heat 6/10 Major 7 d/yr ≥101°F today · 19 d/yr by 30 yrs out
- Wind 2/10 Low 2% chance of damaging wind over 30 yrs
- Air quality 2/10 Low 0 unhealthy d/yr today · 1 by 30 yrs out
Nearby sold comps map
Loading sold comps map…
Walkable amenities ~0.75 mi
Loading nearby amenities…
Taxation est. · year 1
- Rental income
- $26,466
- − Mortgage interest
- −$13,998
- − Property taxes
- −$1,932
- − Insurance
- −$1,250
- − Repairs & maintenance
- −$2,117
- − Management
- −$2,117
- − HOA
- −$960
- − Depreciation
- −$7,270
- Taxable loss
- −$3,178
- Est. tax savings @ 24.0%
- +$763
- After-tax cash flow
- $1,803/yr
For passive investors: Depreciation is non-cash, so a rental often shows a tax loss while cash-flowing — sheltering income. Rental losses are passive: they offset passive income freely, and up to $25,000/yr can offset ordinary (W-2) income if you actively participate and your MAGI is under $100k (phasing out to $0 by $150k); unused losses carry forward. On sale, claimed depreciation is recaptured at up to 25%, and gains may owe capital-gains tax (a 1031 exchange can defer both). Figures are a year-1 estimate at your 24.0% rate — not tax advice; consult a CPA.
Schools (NCES district)
- District
- Lynchburg City Public School District
- NCES district ID
- 5102340
- Math proficiency
- 36% ▼ -38.00%
- Reading proficiency
- 61% ▼ -8.00%
- Median HH income
- $39,097
- Composite
- 40.4/100
- National rank
- #3730
- State rank
- #104 of 131 in VA
Livability — Lynchburg
- Score
- 91/100
- State rank
- #1
- US rank
- #58
Category grades
Schools grade is shown separately in the Schools card above.
Census & demographics
- Census place
- Lynchburg, VA
- County
- Lynchburg City · 97,036 people
- City population
- 97,036
- Metro
- Lynchburg, VA
- Population (ZIP)
- 41,979
- Household income
- $68,872
- Rent vs Own
- Severe rent burden
- 1774.0
Population outlook (Lynchburg County) Hauer SSP2
- Today (2025)
- 87,977 people
- By 2030
- 93,626 · +6.4%
- By 2040
- 106,145 · +20.7%
- By 2050
- 120,783 · +37.3%
- By 2075
- 162,249 · +84.4%
- By 2100
- 191,358 · +117.5%
Race, ethnicity, and origin ACS 2023
- Neighborhood character
- Predominantly White (68%)
- Race & ethnicity
- White 68% Black 19% Two or more races 6% Hispanic / Latino 6% Asian 2%
- Hispanic origin (detail)
- Mexican 2%
- Common ancestry
- Slovak 3% Italian 2% Lithuanian 2%
- Foreign-born
- 6% · Canada, South Korea, United Kingdom
- Languages at home
- 91% English-only · Spanish 4% Other Indo-European 1% Other Asian/Pacific 1%
Political lean MEDSL · Lynchburg
- 2024 margin
- Lean R (+7.9) · D 45.4% · R 53.3% · Other 1.3%
- 2008→2024 swing
- -3.9pp toward R · 2008: -4.0pp · 2024: -7.9pp
- All cycles
- 2024: R+7.9 2020: D+2.6 2016: R+9.0 2012: R+10.6 2008: R+4.0
Not yet ingested
- Civics
- —
Market trends
- HPI YoY
- ▼ -222.79%
- Current HPI
- 241.9041
- Rent YoY
- ▲ 5.11%
- Metro
- Lynchburg, VA
- State GDP YoY
- ▲ 2.40%
- F500 in state
- 50
Industry mix (Fortune 500 HQ in VA)
| Industry | F500 HQs | Revenue |
|---|---|---|
| Aerospace / Defense | 4 | $236B |
|
||
| Technology / Defense | 3 | $32B |
|
||
| Financial Services | 2 | $176B |
|
||
| Utilities | 2 | $27B |
|
||
| Insurance | 2 | $25B |
|
||
| Technology | 2 | $15B |
|
||
Price history
-66.6% since first listed20 events — show timeline
- 2026-01-20 Relisted — LMLS
- 2025-12-07 Pending — LMLS
- 2025-12-07 Listed $249,900 LMLS
- 2025-12-02 Pending — LMLS
- 2025-12-01 Listed $249,900 LMLS
- 2025-11-23 Pending — LMLS
- 2025-11-21 Listed $249,900 LMLS
- 2025-10-16 Rental Removed $1,995 BUILDIUM
- 2025-09-13 Listed for Rent $1,995 BUILDIUM
- 2025-09-13 Rental Removed $1,995 BUILDIUM
- 2025-07-30 Listed for Rent $1,995 BUILDIUM
- 2025-06-18 Rental Removed $1,195 APPFOLIO
- 2025-06-12 Sold (Public Records) $9,529 Public Records
- 2025-06-07 Listed for Rent $1,195 APPFOLIO
- 2025-04-20 Rental Removed $1,795 RENTALBEAST
- 2025-04-12 Listed $350,000 LMLS
- 2025-04-06 Listed for Rent $1,795 RENTALBEAST
- 2012-04-19 Sold (Public Records) $960,000 Public Records
- 2010-04-12 Sold (Public Records) $2,409,600 Public Records
- 2006-11-21 Sold (Public Records) $748,650 Public Records
Property tax history
+14.9%/yrLatest (2025): $1,932 · +334.2% YoY. Source: county tax records.
Cash-flow waterfall
monthlySold comps — $/sqft
last 12 mo · ≤1 miLoading sold comps…