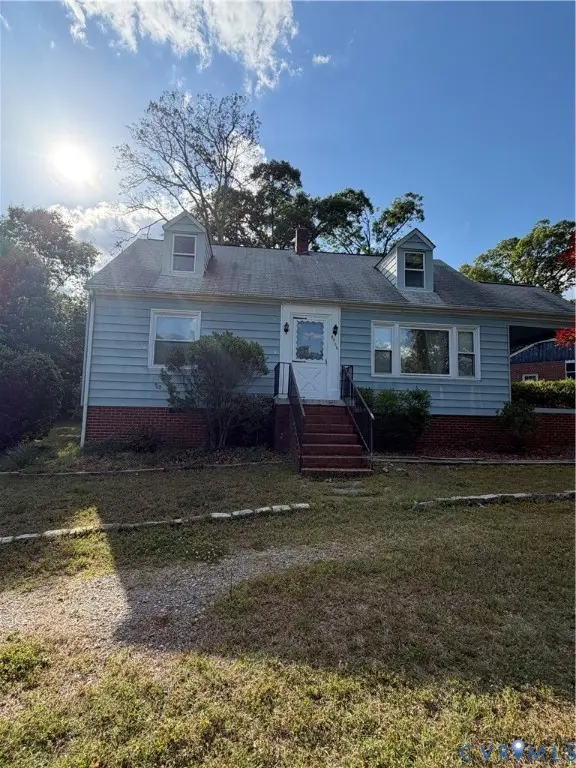
8706 Mccaw Dr · Bon Air, VA
Flood risk 1/10 · Minimal
- FEMA flood zone
- X (unshaded)
- Chance of flooding over 30 yrs
- 0.0%
- Est. flood insurance / yr
- $507 – $1,088
Fire risk 1/10 · Minimal
- Est. fire insurance / yr
- $666 – $1,236
Heat risk 7/10 · Major
- Hot days now (above 103°F)
- 7 days/yr
- Hot days in 30 yrs
- 17 days/yr
Wind risk 6/10 · Moderate
- Chance of severe wind over 30 yrs
- 27.0%
Air-quality risk 2/10 · Minimal
- Unhealthy air days now
- 0 days/yr
- Unhealthy air days in 30 yrs
- 2 days/yr
Risk factors via First Street. Map © Google.
Why this score? — see what drove the C- grade
The composite is a weighted blend of 9 inputs, each scored 0–100. Each bar is that input's sub-score; the figure is the points it added to the 100-point composite (weight × sub-score).
- ARV discount +15.0/15.0
- Cash flow +14.7/30.0
- Schools +5.2/10.0
- DSCR +4.5/10.0
- Livability +3.9/5.0
- 1% rule +3.6/10.0
- Rent growth +3.5/5.0
- Condition / age +2.5/5.0
- Appreciation +0.0/10.0
$225,000
🖨 Deal sheet (PDF) 📄 Offer letter ✓ Due diligence
Listing remarks
Beautiful opportunity in the sought-after Bon Air area of North Chesterfield! Situated on a spacious 0.32-acre corner lot in a quiet established neighborhood, this 2-bedroom, 1-bath cape cod home offers incredible potential for investors, renovators, or buyers looking to create their vision. With 1,140 square feet plus accessible upstairs space that may offer future expansion possibilities, the opportunities here are substantial. Built in 1956, the home features public water, public sewer, aluminum siding, a heat pump, and conveys with existing washer, dryer, and refrigerator. Property is being sold strictly AS-IS from an estate, with no repairs to be made by seller. Home will be delivered
Key facts
- 0.32 acre lot
- Parking
- Built 1956
Property features AI
Exterior
- Parking: Circular driveway
- Utilities: Public water; Public sewer
- Home design: Single-story home; Resale property
- Construction: Aluminum siding and frame construction; Composition roof
- Exterior features: Circular driveway; Lot zoned R15
Interior
- Bedrooms: Total of 6 rooms (bedrooms and other rooms included)
- Flooring: Wood
- Bathrooms: 1 full bathroom with tub & shower (on the first level)
- Heating & cooling: Heat pump heating; Electric heating; Heat pump cooling
- Interior features: Wood flooring; Crawl space basement
Neighborhood map
What this means for you Summary
Snapshot
- This is a 2-bed/1.0-bath single-family listed at $225k.
Deal economics
- At list price, monthly cash flow is $59 ($711/yr) — positive.
- The deal already cash-flows at list — no discount required.
- To meet the 1% rule (rent ≥ 1% of price), the offer needs to be $192k (14.5% below list).
- Recommended offer: $192k (14.5% below list) — sets the bar for 1% rule.
- Cap rate 6.6% vs local median 3.8% in Bon Air — top-decile yield for the area; either an underpriced asset or a hidden risk that comps aren't pricing in. Stress-test before assuming the spread holds.
Location & tenants
- Location reads 77/100 on livability (#103 in VA, #3,251 nationally) — a middle-class / working-renter tenant base. Strengths: schools A+, employment A+, housing A+; Watch: amenities F, commute F.
- Chesterfield County Public School District (suburban): math 52% / reading 64% proficiency, ranked #57 of 131 in VA (top 44%) — acceptable for families but not a draw, mixed tenant base, ~2y average lease.
- Market conditions: Rents rising fast (+4.0%/yr); 169 active listings in the ZIP; 10 comparable units currently listed for rent nearby; rentals leasing fast (median 12d on market — plan ~1-2 weeks tenant-placement turnaround); solid renter incomes; 2,307 units permitted in Chesterfield County in 2024 (462 in 5+ unit buildings).
Forward outlook
- Local home prices are declining (-3.0%/yr); year-one equity from $2k of loan paydown is wiped out by about $7k of value loss. Plan a longer hold.
- Chesterfield County population projected at +20% by 2050 — long-run rental-demand tailwind backs the buy-and-hold thesis.
Negotiation context
- Only 2 days on market — expect competitive offers; lowballing is unlikely to land.
- Current owner paid $75k; list at $225k implies a 200% gain — meaningful room to come down on a strong offer.
Risks & watch-outs
- Watch-outs: built in 1956 — expect roof / HVAC / electrical / plumbing capex.
- Climate carrying-cost: major wind risk, 27% chance of damaging wind over 30y; extreme-heat days projected 7→17/yr by 2055 (HVAC capex compounding) — expect insurance premiums to compound above CPI over the hold.
Questions for the listing agent
- Built in 1956 — when were the roof, HVAC, electrical panel, plumbing, and water heater last replaced?
- Is there a deadline driving the sale (1031 exchange, divorce, estate, relocation)? That informs how much negotiation room exists.
- Schools are A-rated — typically a magnet for longer-tenancy family renters. What's the average tenant stay here, and is there a school-zone premium baked into asking?
- What's the average days-on-market for RENTAL listings here right now (not sales)? A rising rental-DOM trend means longer vacancies and softer asking-rent achievability than the comps imply.
- What's the recent tenant-quality profile in this submarket — average credit score on applications, eviction rate, late-payment / NSF rate, and stable-employment percentage? A property-management company in the area should have these aggregated.
- How much new for-sale + rental construction is in the pipeline within 1–3 miles? Heavy new supply typically softens prices + rents 12–24 months out; constrained supply supports both.
Investment metrics
- 1% rule
- 0.86% ✗
- Cap rate
- 6.61%
- Cash-on-cash
- 1.13%
- DSCR
- 1.05
- GRM
- 9.7
CMA / ARV
- ARV (median comp)
- $384,587
- List price
- $225,000
- Delta
- -41.50%
- Verdict
- UNDERPRICED
- Comps
- 20 within 1.0 mi
Show comp detail 2 sales within ~0.75 mi
| Address | Dist | Beds/Ba | Sqft | Sold | Price | $/sf | Match |
|---|---|---|---|---|---|---|---|
| 8430 Mccaw Dr | 0.26mi | 2/1.5 | 1,168 (+2%) | 23mo | $341,500 | $292 | 63 |
| 8815 W Huguenot Rd | 0.16mi | 3/1.5 (+1) | 1,301 (+14%) | 19mo | $305,000 | $234 | 46 |
Match score weights: distance 35% · size 25% · config 20% · recency 20%. Top-matched comps best support the ARV.
Projected returns pro-forma
-3.0% appreciation · 4.01% rent growth · sell at horizon
- IRR
- -13.5%
- Equity multiple
- 0.51×
- Total profit
- $-30,741
- Equity at exit
- $33,548
- IRR
- -3.1%
- Equity multiple
- 0.78×
- Total profit
- $-13,755
- Equity at exit
- $19,454
Cash invested: $63,000 (down + closing). Projections, not guarantees.
Landlord ↔ Tenant lean methodology
- Overall (STATE)
- 55 Moderately Landlord-Leaning
- State Virginia
- 55 Moderately Landlord-Leaning · D+2
- County
- — inherits STATE
- City
- — inherits STATE
ZIP-level market 23235
- Rents YoY
- 4.0%
- Active inventory
- 169
- Price-to-rent
- 9.7×
Monthly cashflow live
- Estimated rent
- $1,924 high interval (Pro) →
- Mortgage (P&I)
- −$1,180
- Tax from tax record
- −$187 /mo · $2,246/yr
- Insurance
- −$94
- HOA
- −$0
- Vacancy / Maint / Mgmt
- −$404
- Net cashflow
- $59
Break-even live
Sensitivity live
| Price | -10% $187 | -5% $123 | +0% $59 | +5% $-4 | +10% $-68 |
|---|---|---|---|---|---|
| Rent | -10% $-93 | -5% $-17 | +0% $59 | +5% $135 | +10% $211 |
| Rate | -1.0pp $173 | -0.5pp $116 | base $59 | +0.5pp $1 | +1.0pp $-58 |
UW: 25.0% down · 7.5% · 30yr · 1.5% tax · 5.0% vac · 8.0% maint · 8.0% mgmt
Financing live
Cash to close
- Down payment
- $56,250
- Closing costs
- $6,750
- Reserves months
- —
- Total cash needed
- —
Loan-product check · same deal, 3 products live
Conventional
25% down · 7.5% · 30yr
- Down + closing
- —
- Monthly P&I
- —
- Monthly cashflow
- —
- DSCR
- —
- Eligible?
- —
Personal DTI + credit; lowest rate.
DSCR
20% down · 8.5% · 30yr
- Down + closing
- —
- Monthly P&I
- —
- Monthly cashflow
- —
- DSCR
- —
- Eligible?
- —
No personal income docs; deal must DSCR.
Hard money
10% down · 12.0% · 12mo
- Down + closing
- —
- Monthly P&I
- —
- Monthly cashflow
- —
- DSCR
- —
- Eligible?
- —
Short-term bridge; refi at stabilization.
Rent comps 10 comps
| Address | Beds | Baths | Sqft | Rent | $/sqft | DOM | Units | Dist |
|---|---|---|---|---|---|---|---|---|
| 3012 Stony Lake Dr Richmond, VA | 1.0–2.0 | 1.0–2.0 | 1013 | $1,861 | $1.84 | 2d | 19 | 0.55mi |
| 9220 St Charles Cir Richmond, VA | 3.0 | 2.5 | 1470 | $2,300 | $1.56 | 18d | 1 | 0.62mi |
| 2052 Buford Rd Apt 2B Richmond, VA | 1.0 | 1.0 | 1000 | $2,000 | $2.00 | 4d | 1 | 0.75mi |
| 2909 Westgate Dr Richmond, VA | 3.0 | 1.0 | 1127 | $1,937 | $1.72 | 44d | 1 | 0.86mi |
| 2517 W Tremont Ct Richmond, VA | 1.0–3.0 | 1.0–2.0 | 1040 | $1,858 | $1.79 | 3d | 35 | 1.24mi |
| 10280 Iron Mill Rd North Chesterfield, VA | 2.0 | 1.5 | 962 | $1,750 | $1.82 | 11d | 1 | 1.27mi |
| 10146 Iron Mill Rd North Chesterfield, VA | 2.0 | 1.0 | 971 | $1,500 | $1.54 | 11d | 1 | 1.28mi |
| 7733 Duncaster Rd Richmond, VA | 3.0 | 1.0 | 1248 | $1,962 | $1.57 | 12d | 1 | 1.30mi |
| 10124 Iron Mill Rd #1 Richmond, VA | 1.0 | 1.0 | 811 | $1,650 | $2.03 | 44d | 1 | 1.33mi |
| 9101 Stony Point Pkwy Richmond, VA | 1.0–3.0 | 1.0–2.0 | 1096 | $1,925 | $1.76 | 3d | 25 | 1.48mi |
Listing history 4 events
-
2026-05-08status Pending 1077-char remark
-
2026-05-06$225,000 Active 1077-char remark
-
1993-02-24soldstatus $74,950
-
1991-04-01soldstatus $64,250
ⓘ Source: listings_history table (triggers on properties + properties_extension) + one-shot
backfill from property_details.listing_events for pre-trigger history.
Tax reassessment forecast VA · Resets to sale price
- Current annual tax
- $2,246 · $187/mo
- Projected year-2 tax
- $2,246 · $187/mo
- Expected delta
- $0/yr ($0/mo · 0.0%)
ⓘ Screening estimate from a state-policy table — verify with the county assessor before closing.
Climate risk First Street
- Flood 1/10 Low FEMA zone X (unshaded) · 0% chance over 30 yrs
- Wildfire 1/10 Low
- Heat 7/10 Severe 7 d/yr ≥103°F today · 17 d/yr by 30 yrs out
- Wind 6/10 Major 27% chance of damaging wind over 30 yrs
- Air quality 2/10 Low 0 unhealthy d/yr today · 2 by 30 yrs out
Nearby sold comps map
Loading sold comps map…
Walkable amenities ~0.75 mi
Loading nearby amenities…
Taxation est. · year 1
- Rental income
- $23,090
- − Mortgage interest
- −$12,603
- − Property taxes
- −$2,246
- − Insurance
- −$1,125
- − Repairs & maintenance
- −$1,847
- − Management
- −$1,847
- − Depreciation
- −$6,545
- Taxable loss
- −$3,125
- Est. tax savings @ 24.0%
- +$750
- After-tax cash flow
- $1,461/yr
For passive investors: Depreciation is non-cash, so a rental often shows a tax loss while cash-flowing — sheltering income. Rental losses are passive: they offset passive income freely, and up to $25,000/yr can offset ordinary (W-2) income if you actively participate and your MAGI is under $100k (phasing out to $0 by $150k); unused losses carry forward. On sale, claimed depreciation is recaptured at up to 25%, and gains may owe capital-gains tax (a 1031 exchange can defer both). Figures are a year-1 estimate at your 24.0% rate — not tax advice; consult a CPA.
Schools (NCES district)
- District
- Chesterfield County Public School District
- NCES district ID
- 5100840
- Math proficiency
- 52% ▼ -30.00%
- Reading proficiency
- 64% ▼ -15.00%
- Median HH income
- $72,821
- Composite
- 51.56/100
- National rank
- #1712
- State rank
- #57 of 131 in VA
Livability — Bon Air
- Score
- 77/100
- State rank
- #103
- US rank
- #3251
Category grades
Schools grade is shown separately in the Schools card above.
Census & demographics
- Census place
- Bon Air, VA
- County
- Chesterfield County · 406,988 people
- City population
- 33,207
- Metro
- Richmond, VA
- Population (ZIP)
- 33,461
- Household income
- $96,083
- Rent vs Own
- Severe rent burden
- 764.0
Population outlook (Chesterfield County) Hauer SSP2
- Today (2025)
- 377,190 people
- By 2030
- 395,710 · +4.9%
- By 2040
- 427,694 · +13.4%
- By 2050
- 452,706 · +20.0%
- By 2075
- 505,533 · +34.0%
- By 2100
- 521,282 · +38.2%
Race, ethnicity, and origin ACS 2023
- Neighborhood character
- Predominantly White (68%)
- Race & ethnicity
- White 68% Black 16% Hispanic / Latino 8% Two or more races 5% Asian 4%
- Hispanic origin (detail)
- Mexican 2%
- Common ancestry
- Slovak 3% Serbian 2% Romanian 2%
- Foreign-born
- 10% · Canada, China
- Languages at home
- 88% English-only · Spanish 7% Other Asian/Pacific 1% Other Indo-European 1%
Political lean MEDSL · Chesterfield
- 2024 margin
- Lean D (+9.0) · D 53.8% · R 44.8% · Other 1.4%
- 2008→2024 swing
- +16.4pp toward D · 2008: -7.5pp · 2024: 9.0pp
- All cycles
- 2024: D+9.0 2020: D+6.7 2016: R+2.2 2012: R+7.1 2008: R+7.5
Not yet ingested
- Civics
- —
Market trends
- HPI YoY
- ▼ -276.72%
- Current HPI
- 294.1809
- Rent YoY
- ▲ 4.01%
- Metro
- Richmond, VA
- State GDP YoY
- ▲ 2.40%
- F500 in state
- 50
Industry mix (Fortune 500 HQ in VA)
| Industry | F500 HQs | Revenue |
|---|---|---|
| Aerospace / Defense | 4 | $236B |
|
||
| Technology / Defense | 3 | $32B |
|
||
| Financial Services | 2 | $176B |
|
||
| Utilities | 2 | $27B |
|
||
| Insurance | 2 | $25B |
|
||
| Technology | 2 | $15B |
|
||
Price history
+250.2% since first listed4 events — show timeline
- 2026-05-08 Pending — CVRMLS
- 2026-05-06 Listed $225,000 CVRMLS
- 1993-02-24 Sold (Public Records) $74,950 Public Records
- 1991-04-01 Sold (Public Records) $64,250 Public Records
Property tax history
+5.7%/yrLatest (2025): $2,246 · -1.1% YoY. Source: county tax records.
Cash-flow waterfall
monthlySold comps — $/sqft
last 12 mo · ≤1 miLoading sold comps…