 🏷️ Likely Rental
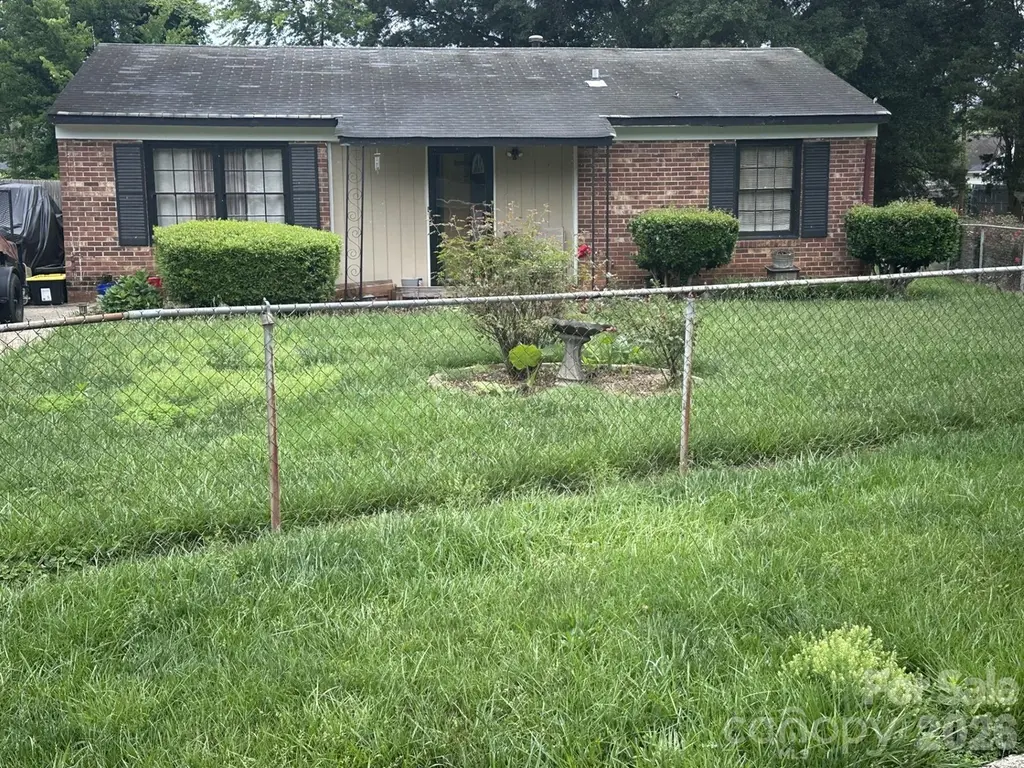
3512 Otwell Ct · Charlotte, NC
Flood risk 1/10 · Minimal
- FEMA flood zone
- X (unshaded)
- Chance of flooding over 30 yrs
- 0.0%
- Est. flood insurance / yr
- $507 – $1,088
Fire risk 1/10 · Minimal
- Est. fire insurance / yr
- $906 – $1,684
Heat risk 6/10 · Moderate
- Hot days now (above 103°F)
- 7 days/yr
- Hot days in 30 yrs
- 17 days/yr
Wind risk 5/10 · Moderate
- Chance of severe wind over 30 yrs
- 23.0%
Air-quality risk 3/10 · Minor
- Unhealthy air days now
- 3 days/yr
- Unhealthy air days in 30 yrs
- 4 days/yr
Risk factors via First Street. Map © Google.
Why this score? — see what drove the B- grade
The composite is a weighted blend of 9 inputs, each scored 0–100. Each bar is that input's sub-score; the figure is the points it added to the 100-point composite (weight × sub-score).
- Cash flow +25.0/30.0
- ARV discount +15.0/15.0
- DSCR +8.1/10.0
- 1% rule +5.8/10.0
- Livability +3.9/5.0
- Schools +3.8/10.0
- Rent growth +3.0/5.0
- Condition / age +2.5/5.0
- Appreciation +0.0/10.0
$179,999
🖨 Deal sheet 📄 Offer letter ✓ Due diligence
Listing remarks
This Ranch style home is a diamond in the rough. Need a little TLC. Easy access to Uptown and the Airport. Public Transportation Bus stop is only 500 walking feet away. Home is tenant occupied month to month. Home is being SOLD "AS-IS" NEW HEAT INSTALL 10/25, AC currently not operable per the tenant. The roof looks aged but currently no leaks. Other than that the home appears to be in good shape. Due to the overwhelming interest The sellers are looking for highest and best by 5pm Friday 6/12/26 to included Due Diligence concession. The Buyer will be responsible for the tenant eviction if he does not leave voluntarily.
Key facts
- 0.23 acre lot
- Built 1971
- Listed 10 days
Tags
Property features AI
Finance
- HOA & community: No HOA
Exterior
- Parking: Driveway (no main-level garage)
- Utilities: City water; Public sewer
- Home design: Single-family residence; One story; Site-built construction; Partial brick exterior; Shingle/shake exterior; Entry on main level; Facing direction not specified
- Construction: Slab foundation
- Exterior features: Fenced yard; Cul-de-sac lot; Level lot; Gravel and concrete road access; Publicly maintained road
Interior
- Kitchen: Gas cooktop; Gas oven; Gas range
- Bedrooms: Three bedrooms (main level)
- Bathrooms: One full bathroom (main level)
- Heating & cooling: Central heating; Central air conditioning
- Interior features: Five rooms total; Storage
- Laundry & utility: Laundry on the main level
Neighborhood map
What this means for you Summary
Snapshot
- This is a 3-bed/1.0-bath single-family listed at $180k.
Deal economics
- At list price, monthly cash flow is $390 ($5k/yr) — positive.
- The deal already cash-flows at list — no discount required.
- Meets the 1% rule at list price ($2k rent vs $180k).
- Cap rate 8.9% vs local median 3.1% in Charlotte — top-decile yield for the area; either an underpriced asset or a hidden risk that comps aren't pricing in. Stress-test before assuming the spread holds.
Location & tenants
- Location reads 78/100 on livability (#26 in NC, #2,502 nationally) — a middle-class / working-renter tenant base. Strengths: amenities A+, commute A+, housing A+; Watch: schools D+, crime F.
- Charlotte-Mecklenburg Schools (urban): math 42% / reading 46% proficiency, ranked #85 of 178 in NC (top 48%) — families likely to look elsewhere, expect single-tenant / working-renter base with shorter leases.
- Market conditions: Rents rising (+2.1%/yr); 458 active listings in the ZIP; 25 comparable units currently listed for rent nearby; rentals at typical pace (median 16d on market — plan ~3-4 weeks tenant-placement turnaround); 11,969 units permitted in Mecklenburg County in 2024 (5,377 in 5+ unit buildings).
- This rent runs 36% of the median local income ($66k/yr) — at the standard rent-burdened threshold; future hikes will face affordability resistance.
Forward outlook
- Local home prices are declining (-3.0%/yr); year-one equity from $1k of loan paydown is wiped out by about $5k of value loss. Plan a longer hold.
- Mecklenburg County population projected at +53% by 2050 — long-run rental-demand tailwind backs the buy-and-hold thesis.
Negotiation context
- Only 10 days on market — expect competitive offers; lowballing is unlikely to land.
- Current owner paid $18k; list at $180k implies a 929% gain — meaningful room to come down on a strong offer.
Risks & watch-outs
- Climate carrying-cost: moderate wind risk, 23% chance of damaging wind over 30y; extreme-heat days projected 7→17/yr by 2055 (HVAC capex compounding) — expect insurance premiums to compound above CPI over the hold.
Questions for the listing agent
- Built in 1971 — when were the roof, HVAC, electrical panel, plumbing, and water heater last replaced?
- Is there a deadline driving the sale (1031 exchange, divorce, estate, relocation)? That informs how much negotiation room exists.
- Schools are D-rated, which usually means shorter tenancies and higher turnover. Who's the typical renter profile here, and what's been the actual vacancy rate?
- Crime grade is F in this area — have there been break-ins, vandalism, or insurance claims at this property in the last 3 years? What carrier currently insures it and at what premium?
- What's the average days-on-market for RENTAL listings here right now (not sales)? A rising rental-DOM trend means longer vacancies and softer asking-rent achievability than the comps imply.
- What's the recent tenant-quality profile in this submarket — average credit score on applications, eviction rate, late-payment / NSF rate, and stable-employment percentage? A property-management company in the area should have these aggregated.
- How much new for-sale + rental construction is in the pipeline within 1–3 miles? Heavy new supply typically softens prices + rents 12–24 months out; constrained supply supports both.
Investment metrics
- 1% rule
- 1.08% ✓
- Cap rate
- 8.89%
- Cash-on-cash
- 9.28%
- DSCR
- 1.41
- GRM
- 7.7
CMA / ARV
- ARV (on-the-fly)
- $269,025
- Comps found
- 12
Show comp detail 12 sales within ~0.75 mi
| Address | Dist | Beds/Ba | Sqft | Sold | Price | $/sf | Match |
|---|---|---|---|---|---|---|---|
| 3600 Braden Dr | 0.14mi | 3/1.0 | 1,070 (+1%) | 1mo | $287,000 | $268 | 91 |
| 3601 Braden Dr | 0.13mi | 3/1.0 | 1,055 (0%) | 8mo | $220,000 | $209 | 87 |
| 615 Milan Rd E | 0.04mi | 3/1.5 | 1,100 (+4%) | 7mo | $150,000 | $136 | 83 |
| 3623 Braden Dr | 0.16mi | 3/1.0 | 1,059 (+0%) | 12mo | $285,000 | $269 | 82 |
| 529 Dedmon Dr | 0.23mi | 3/1.0 | 1,060 (+0%) | 12mo | $260,000 | $245 | 78 |
| 3716 Capps Hill Dr #19 | 0.28mi | 3/2.0 | 1,006 (-5%) | 2mo | $248,000 | $247 | 74 |
| 3753 Capps Hill Dr | 0.30mi | 3/2.0 | 1,077 (+2%) | 11mo | $250,000 | $232 | 69 |
| 1218 Milan Rd | 0.34mi | 3/1.0 | 1,000 (-5%) | 8mo | $255,000 | $255 | 68 |
| 719 Lightspun Ln | 0.37mi | 3/1.0 | 960 (-9%) | 7mo | $244,815 | $255 | 62 |
| 1629 Hudson Graham Ln | 0.59mi | 3/2.0 | 1,052 (-0%) | 8mo | $275,000 | $261 | 62 |
| 522 Klondike Ln | 0.60mi | 3/2.0 | 1,080 (+2%) | 9mo | $280,000 | $259 | 57 |
| 3528 Merrill Pl | 0.58mi | 3/1.0 | 1,210 (+15%) | 2mo | $250,000 | $207 | 47 |
Match score weights: distance 35% · size 25% · config 20% · recency 20%. Top-matched comps best support the ARV.
Projected returns pro-forma
-3.0% appreciation · 2.08% rent growth · sell at horizon
- IRR
- -3.3%
- Equity multiple
- 0.88×
- Total profit
- $-6,161
- Equity at exit
- $26,838
- IRR
- 5.4%
- Equity multiple
- 1.38×
- Total profit
- $19,284
- Equity at exit
- $15,563
Cash invested: $50,400 (down + closing). Projections, not guarantees.
Landlord ↔ Tenant lean methodology
- Overall (STATE)
- 85 Strongly Landlord-Friendly
- State North Carolina
- 85 Strongly Landlord-Friendly · R+3
- County
- — inherits STATE
- City
- — inherits STATE
ZIP-level market 28216
- Home prices YoY
- -31.8%
- Rents YoY
- 2.1%
- Active inventory
- 458
- Price-to-rent
- 7.7×
Monthly cashflow live
- Estimated rent
- $1,948 high interval (Pro) →
- Mortgage (P&I)
- −$944
- Tax from tax record
- −$130 /mo · $1,561/yr
- Insurance
- −$75
- HOA
- −$0
- Vacancy / Maint / Mgmt
- −$409
- Net cashflow
- $390
Break-even live
UW: 25.0% down · 7.5% · 30yr · 1.5% tax · 5.0% vac · 8.0% maint · 8.0% mgmt
Financing live
Cash to close
- Down payment
- $45,000
- Closing costs
- $5,400
- Reserves months
- —
- Total cash needed
- —
Loan-product check · same deal, 3 products live
Conventional
25% down · 7.5% · 30yr
- Down + closing
- —
- Monthly P&I
- —
- Monthly cashflow
- —
- DSCR
- —
- Eligible?
- —
Personal DTI + credit; lowest rate.
DSCR
20% down · 8.5% · 30yr
- Down + closing
- —
- Monthly P&I
- —
- Monthly cashflow
- —
- DSCR
- —
- Eligible?
- —
No personal income docs; deal must DSCR.
Hard money
10% down · 12.0% · 12mo
- Down + closing
- —
- Monthly P&I
- —
- Monthly cashflow
- —
- DSCR
- —
- Eligible?
- —
Short-term bridge; refi at stabilization.
Rent comps 25 comps
| Address | Beds | Baths | Sqft | Rent | $/sqft | DOM | Units | Dist |
|---|---|---|---|---|---|---|---|---|
| 3610 Bardot Dr Charlotte, NC | 3.0 | 1.5 | 1142 | $1,735 | $1.52 | 4d | 1 | 0.11mi |
| 412 Bent Leaf Ct Charlotte, NC | 3.0 | 2.5 | 1300 | $1,789 | $1.38 | 7d | 1 | 0.11mi |
| 3239 Braden Dr Charlotte, NC | 4.0 | 2.0 | 1308 | $1,800 | $1.38 | 21d | 1 | 0.23mi |
| 3807 Gold Nugget Ct Charlotte, NC | 3.0 | 2.0 | 1038 | $1,770 | $1.71 | 7d | 1 | 0.31mi |
| 818 Dedmon Dr Charlotte, NC | 3.0 | 1.0 | 1200 | $3,400 | $2.83 | 16d | 1 | 0.33mi |
| 1604 Black Diamond Ct Charlotte, NC | 3.0 | 2.0 | 1032 | $1,625 | $1.57 | 23d | 1 | 0.43mi |
| 624 Lightspun Ln Charlotte, NC | 3.0 | 2.5 | 1280 | $1,860 | $1.45 | 19d | 1 | 0.45mi |
| 4940 Hopewood Ln Charlotte, NC | 4.0 | 2.0 | 1482 | $1,829 | $1.23 | 23d | 1 | 0.55mi |
| 3513 Merrill Pl Charlotte, NC | 3.0 | 2.0 | 1000 | $2,200 | $2.20 | 16d | 1 | 0.56mi |
| 1113 Capps Hollow Dr Charlotte, NC | 3.0 | 2.0 | 1025 | $1,629 | $1.59 | 16d | 1 | 0.74mi |
| 1509 Crandon Dr Charlotte, NC | 3.0 | 2.0 | 1100 | $1,625 | $1.48 | 23d | 1 | 0.86mi |
| 4164 Canyon Creek Ln Charlotte, NC | 3.0 | 2.0 | 1221 | $1,880 | $1.54 | 23d | 1 | 1.17mi |
| 2308 Juniper Dr Charlotte, NC | 4.0 | 2.5 | 1305 | $1,799 | $1.38 | 16d | 1 | 1.23mi |
| 2544 Abelwood Rd Charlotte, NC | 3.0 | 1.0 | 975 | $1,495 | $1.53 | 23d | 1 | 1.35mi |
| 517 N Linwood Ave Charlotte, NC | 3.0 | 2.0 | 1154 | $1,973 | $1.71 | 16d | 1 | 1.36mi |
| 340 Peachtree Rd Charlotte, NC | 3.0 | 2.0 | 1124 | $1,739 | $1.55 | 7d | 1 | 1.37mi |
| 2701 Abelwood Rd Charlotte, NC | 3.0 | 1.5 | 988 | $2,000 | $2.02 | 4d | 1 | 1.37mi |
| 5823 Hamilton Oaks Dr Charlotte, NC | 3.0 | 2.0 | 1074 | $1,640 | $1.53 | 4d | 1 | 1.37mi |
| 2244 English Dr Charlotte, NC | 3.0 | 1.0 | 962 | $1,550 | $1.61 | 23d | 1 | 1.39mi |
| 1003 Korp Rd Charlotte, NC | 3.0 | 2.5 | 1254 | $1,745 | $1.39 | 16d | 1 | 1.43mi |
| 314 Clarence St Unit 2 Charlotte, NC | 4.0 | 2.0 | 1330 | $1,495 | $1.12 | 23d | 1 | 1.48mi |
| 314 Clarence St Unit 3913-8 Charlotte, NC | 3.0 | 1.5 | 1170 | $1,325 | $1.13 | 23d | 1 | 1.48mi |
| 314 Clarence St Charlotte, NC | 2.0–4.0 | 1.5–2.0 | 1160 | $1,295 | $1.12 | 20d | 2 | 1.48mi |
| 3304 Sunset Rd Charlotte, NC | 3.0 | 2.0 | 1300 | $1,720 | $1.32 | 2d | 1 | 1.49mi |
| 1033 Rook Rd Charlotte, NC | 3.0 | 2.5 | 1476 | $3,000 | $2.03 | 7d | 1 | 1.50mi |
Listing history 8 events
-
2026-06-18days on market $179,999 Active 10 DOM
-
2026-06-17days on market $179,999 Active 9 DOM
-
2026-06-16days on market $179,999 Active 8 DOM
-
2026-06-15days on market $179,999 Active 7 DOM
-
2026-06-13days on market $179,999 Active 5 DOM
-
2026-06-10remarks 626-char remark
-
2026-06-08remarks 169-char remark
-
2026-06-08$179,999 Active 1 DOM
ⓘ Source: listings_history table (triggers on properties + properties_extension) + one-shot
backfill from property_details.listing_events for pre-trigger history.
Tax reassessment forecast NC · Resets to sale price
- Current annual tax
- $1,561 · $130/mo
- Projected year-2 tax
- $1,561 · $130/mo
- Expected delta
- $0/yr ($0/mo · 0.0%)
ⓘ Screening estimate from a state-policy table — verify with the county assessor before closing.
Climate risk First Street
- Flood 1/10 Low FEMA zone X (unshaded) · 0% chance over 30 yrs
- Wildfire 1/10 Low
- Heat 6/10 Major 7 d/yr ≥103°F today · 17 d/yr by 30 yrs out
- Wind 5/10 Major 23% chance of damaging wind over 30 yrs
- Air quality 3/10 Moderate 3 unhealthy d/yr today · 4 by 30 yrs out
Nearby sold comps map
Loading sold comps map…
Walkable amenities ~0.75 mi
Loading nearby amenities…
Taxation est. · year 1
- Rental income
- $23,374
- − Mortgage interest
- −$10,083
- − Property taxes
- −$1,561
- − Insurance
- −$900
- − Repairs & maintenance
- −$1,870
- − Management
- −$1,870
- − Depreciation
- −$5,236
- Taxable income
- $1,854
- Est. tax owed @ 24.0%
- −$445
- After-tax cash flow
- $4,232/yr
For passive investors: Depreciation is non-cash, so a rental often shows a tax loss while cash-flowing — sheltering income. Rental losses are passive: they offset passive income freely, and up to $25,000/yr can offset ordinary (W-2) income if you actively participate and your MAGI is under $100k (phasing out to $0 by $150k); unused losses carry forward. On sale, claimed depreciation is recaptured at up to 25%, and gains may owe capital-gains tax (a 1031 exchange can defer both). Figures are a year-1 estimate at your 24.0% rate — not tax advice; consult a CPA.
Schools (NCES district)
- District
- Charlotte-Mecklenburg Schools
- NCES district ID
- 3702970
- Math proficiency
- 42% ▼ -6.00%
- Reading proficiency
- 46% ▲ 1.00%
- Median HH income
- $57,175
- Composite
- 38.49/100
- National rank
- #4183
- State rank
- #85 of 178 in NC
Livability — Charlotte
- Score
- 78/100
- State rank
- #26
- US rank
- #2502
Category grades
Schools grade is shown separately in the Schools card above.
Census & demographics
- Census place
- Charlotte, NC
- County
- Mecklenburg County · 1,167,319 people
- City population
- 920,422
- Metro
- Charlotte-Concord-Gastonia, NC-SC
- Population (ZIP)
- 57,507
- Household income
- $65,795
- Rent vs Own
- Severe rent burden
- 3184.0
Population outlook (Mecklenburg County) Hauer SSP2
- Today (2025)
- 1,305,740 people
- By 2030
- 1,442,752 · +10.5%
- By 2040
- 1,722,441 · +31.9%
- By 2050
- 1,999,450 · +53.1%
- By 2075
- 2,642,495 · +102.4%
- By 2100
- 3,106,755 · +137.9%
Race, ethnicity, and origin ACS 2023
- Neighborhood character
- Diverse neighborhood (Simpson 0.58)
- Race & ethnicity
- Black 60% White 20% Hispanic / Latino 12% Asian 5% Two or more races 4%
- Hispanic origin (detail)
- Mexican 5%
- Common ancestry
- Romanian 1% Slovak 1% Lithuanian 1%
- Foreign-born
- 13% · Canada, Vietnam, Philippines
- Languages at home
- 82% English-only · Spanish 11% Other Asian/Pacific 2% Other Indo-European 1%
Political lean MEDSL · Mecklenburg
- 2024 margin
- Solid D (+32.9) · D 65.6% · R 32.7% · Other 1.6%
- 2008→2024 swing
- +8.5pp toward D · 2008: 24.4pp · 2024: 32.9pp
- All cycles
- 2024: D+32.9 2020: D+35.1 2016: D+29.9 2012: D+22.5 2008: D+24.4
Not yet ingested
- Civics
- —
Market trends
- HPI YoY
- ▼ -130.17%
- Current HPI
- 278.6861
- Rent YoY
- ▲ 2.08%
- Metro
- Charlotte-Concord-Gastonia, NC-SC
- State GDP YoY
- ▲ 3.28%
- F500 in state
- 26
Industry mix (Fortune 500 HQ in NC)
| Industry | F500 HQs | Revenue |
|---|---|---|
| Financial Services | 2 | $213B |
|
||
| Retail | 2 | $95B |
|
||
| Industrial Conglomerate | 1 | $38B |
|
||
| Metals / Steel | 1 | $35B |
|
||
| Utilities | 1 | $30B |
|
||
| Industrial Machinery | 1 | $19B |
|
||
Price history
+928.6% since first listed2 events — show timeline
- 2026-06-08 Listed $179,999 CANOPYMLS as Distributed by MLS Grid
- 1976-05-01 Sold (Public Records) $17,500 Public Records
Property tax history
+6.2%/yrLatest (2025): $1,561 · +2.5% YoY. Source: county tax records.
Cash-flow waterfall
monthlySold comps — $/sqft
last 12 mo · ≤1 miLoading sold comps…