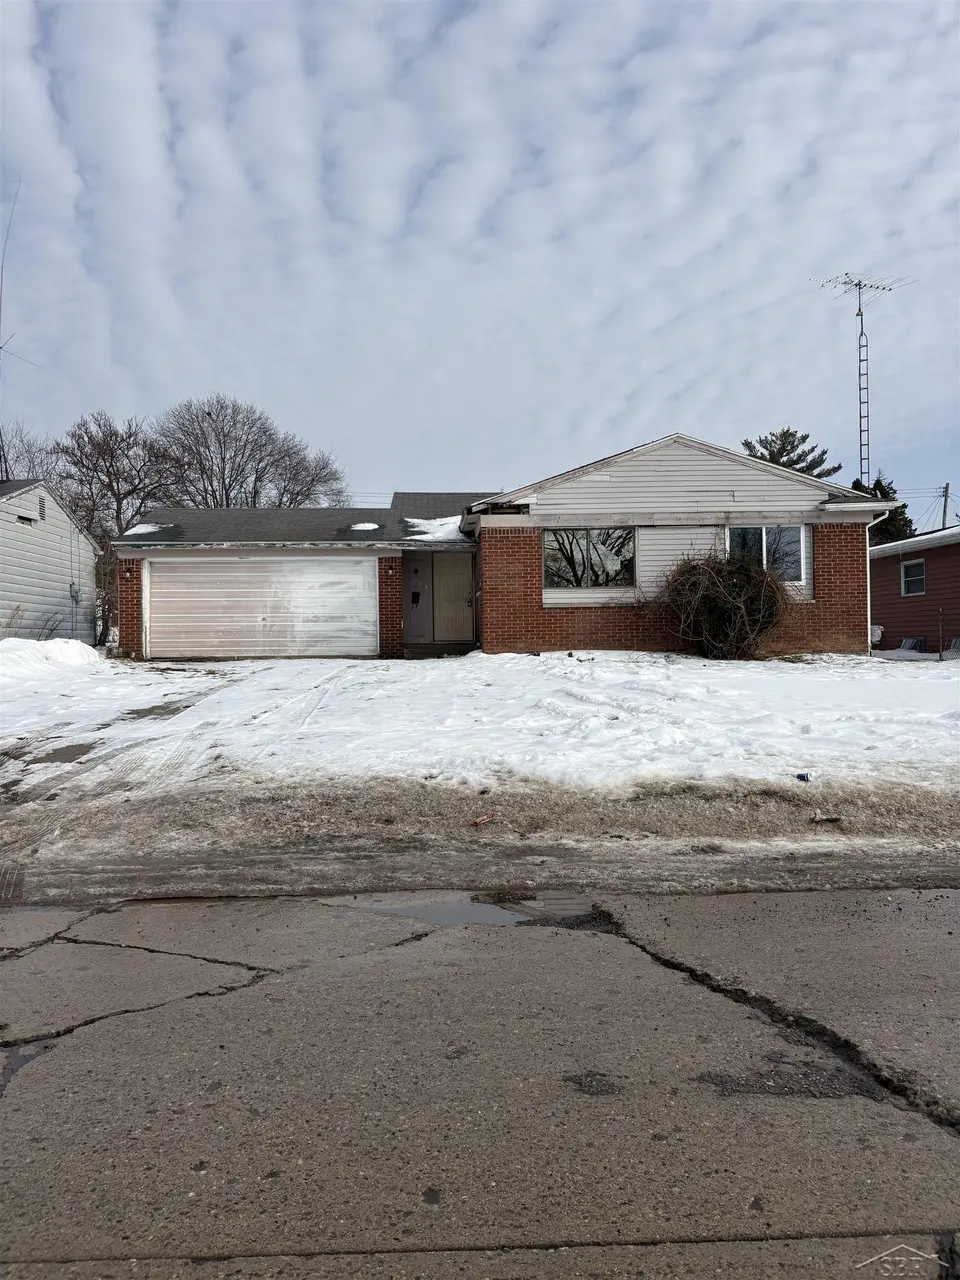
6104 Hilton Ln · Mount Morris, MI
Flood risk 1/10 · Minimal
- FEMA flood zone
- X (unshaded)
- Chance of flooding over 30 yrs
- 0.0%
- Est. flood insurance / yr
- $473 – $860
Fire risk 1/10 · Minimal
- Est. fire insurance / yr
- $784 – $1,456
Heat risk 2/10 · Minimal
- Hot days now (above 97°F)
- 7 days/yr
- Hot days in 30 yrs
- 14 days/yr
Wind risk 2/10 · Minimal
- Chance of severe wind over 30 yrs
- —
Air-quality risk 2/10 · Minimal
- Unhealthy air days now
- 1 days/yr
- Unhealthy air days in 30 yrs
- 3 days/yr
Risk factors via First Street. Map © Google.
Why this score? — see what drove the B- grade
The composite is a weighted blend of 9 inputs, each scored 0–100. Each bar is that input's sub-score; the figure is the points it added to the 100-point composite (weight × sub-score).
- Cash flow +30.0/30.0
- 1% rule +10.0/10.0
- DSCR +10.0/10.0
- ARV discount +7.5/15.0
- Livability +3.4/5.0
- Rent growth +2.5/5.0
- Condition / age +2.5/5.0
- Schools +1.0/10.0
- Appreciation +0.0/10.0
$35,000
🖨 Deal sheet 📄 Offer letter ✓ Due diligence
Listing remarks MLS
Welcome to this fixer-upper with great investment potential. This 1,140 sq ft home offers 2 bedrooms and 1.5 bathrooms. A spacious dining room. 1st floor laundry room potential 3rd bedroom and a full basement providing ample storage or future living space. An attached garage adds convenience. A solid opportunity for investors or buyers ready to add value. Nice size Backyard for entertaining.
Key facts
- Attached garage
- Spacious dining room
- Nice size backyard
Tags
Neighborhood map
What this means for you Summary
Snapshot
- This is a 2-bed/1.5-bath single-family listed at $35k.
Deal economics
- At list price, monthly cash flow is $567 ($7k/yr) — positive.
- The deal already cash-flows at list — no discount required.
- Meets the 1% rule at list price ($1k rent vs $35k).
- Recommended offer: $31k (12.0% below list) — sets the bar for market timing.
- Cap rate 25.7% vs local median 5.5% in Mount Morris — top-decile yield for the area; either an underpriced asset or a hidden risk that comps aren't pricing in. Stress-test before assuming the spread holds.
Location & tenants
- Location reads 68/100 on livability (#357 in MI) — a middle-class / working-renter tenant base. Strengths: cost of living A+, housing A+, health & safety A+; Watch: schools F, crime F, amenities F.
- Beecher Community School District (suburban): math 7% / reading 10% proficiency, ranked #722 of 760 in MI (top 95%) — low school quality limits family demand, transient renter base, plan for 1-2y turnover; 90% free/reduced lunch — lower-income household profile, screen leases tightly.
- Market conditions: 144 active listings in the ZIP; 1 comparable units currently listed for rent nearby; 419 units permitted in Genesee County in 2024 (68 in 5+ unit buildings).
Forward outlook
- Local home prices are declining (-3.0%/yr); year-one equity from $242 of loan paydown is wiped out by about $1k of value loss. Plan a longer hold.
- Genesee County population projected at -27% by 2050 — secular population decline; favor cash flow + early exit over multi-decade hold.
- At projected returns (-3.0% appreciation + 3.0% rent growth), your $10k cash investment doubles in ~2 years — after that, you're playing with house money.
Negotiation context
- It's been on market 127 days — a 12% lower offer ($31k) is reasonable based on typical stale-listing flexibility.
- 2 sale attempts; this cycle's ask has dropped $5k (12%) from the opening price — seller is motivated, your offer sets the floor, not the list.
Risks & watch-outs
- Watch-outs: property tax is 3.7% of price.
Questions for the listing agent
- It's been on market 127 days. Have you received any prior offers? Is the seller open to a 12% concession, seller financing, or rate buy-down credit?
- Built in 1965 — when were the roof, HVAC, electrical panel, plumbing, and water heater last replaced?
- Property tax is high relative to price — has the assessment been appealed recently, and will the sale trigger a re-assessment?
- Why hasn't it sold? Are there any deal-killer items the seller is aware of (foundation, flood, title, zoning, code violations)?
- Is there a deadline driving the sale (1031 exchange, divorce, estate, relocation)? That informs how much negotiation room exists.
- Schools are F-rated, which usually means shorter tenancies and higher turnover. Who's the typical renter profile here, and what's been the actual vacancy rate?
- Crime grade is F in this area — have there been break-ins, vandalism, or insurance claims at this property in the last 3 years? What carrier currently insures it and at what premium?
- What's the average days-on-market for RENTAL listings here right now (not sales)? A rising rental-DOM trend means longer vacancies and softer asking-rent achievability than the comps imply.
- What's the recent tenant-quality profile in this submarket — average credit score on applications, eviction rate, late-payment / NSF rate, and stable-employment percentage? A property-management company in the area should have these aggregated.
- How much new for-sale + rental construction is in the pipeline within 1–3 miles? Heavy new supply typically softens prices + rents 12–24 months out; constrained supply supports both.
Investment metrics
- 1% rule
- 3.16% ✓
- Cap rate
- 25.73%
- Cash-on-cash
- 69.43%
- DSCR
- 4.09
- GRM
- 2.6
CMA / ARV
- ARV (median comp)
- $80,165
- List price
- $35,000
- Delta
- -56.34%
- Verdict
- UNDERPRICED
- Comps
- 20 within 1.0 mi
Projected returns pro-forma
-3.0% appreciation · 3.0% rent growth · sell at horizon
- IRR
- 69.0%
- Equity multiple
- 4.11×
- Total profit
- $30,497
- Equity at exit
- $5,219
- IRR
- 73.1%
- Equity multiple
- 8.48×
- Total profit
- $73,287
- Equity at exit
- $3,026
Cash invested: $9,800 (down + closing). Projections, not guarantees.
Landlord ↔ Tenant lean methodology
- Overall (STATE)
- 62 Landlord-Friendly
- State Michigan
- 62 Landlord-Friendly · EVEN
- County
- — inherits STATE
- City
- — inherits STATE
ZIP-level market 48458
- Home prices YoY
- -16.0%
- Active inventory
- 144
- Price-to-rent
- 2.6×
Monthly cashflow live
- Estimated rent
- $1,106 medium interval (Pro) →
- Mortgage (P&I)
- −$184
- Tax from tax record
- −$109 /mo · $1,305/yr
- Insurance
- −$15
- HOA
- −$0
- Vacancy / Maint / Mgmt
- −$232
- Net cashflow
- $567
Break-even live
UW: 25.0% down · 7.5% · 30yr · 1.5% tax · 5.0% vac · 8.0% maint · 8.0% mgmt
Financing live
Cash to close
- Down payment
- $8,750
- Closing costs
- $1,050
- Reserves months
- —
- Total cash needed
- —
Loan-product check · same deal, 3 products live
Conventional
25% down · 7.5% · 30yr
- Down + closing
- —
- Monthly P&I
- —
- Monthly cashflow
- —
- DSCR
- —
- Eligible?
- —
Personal DTI + credit; lowest rate.
DSCR
20% down · 8.5% · 30yr
- Down + closing
- —
- Monthly P&I
- —
- Monthly cashflow
- —
- DSCR
- —
- Eligible?
- —
No personal income docs; deal must DSCR.
Hard money
10% down · 12.0% · 12mo
- Down + closing
- —
- Monthly P&I
- —
- Monthly cashflow
- —
- DSCR
- —
- Eligible?
- —
Short-term bridge; refi at stabilization.
Rent comps 1 comps
| Address | Beds | Baths | Sqft | Rent | $/sqft | DOM | Units | Dist |
|---|---|---|---|---|---|---|---|---|
| 48 Sunny Ln Mount Morris, MI | 3.0 | 2.0 | 1900 | $1,100 | $0.58 | 43d | 1 | 1.06mi |
Listing history 21 events
-
2026-06-18days on market $35,000 Active 127 DOM
-
2026-06-17days on market $35,000 Active 126 DOM
-
2026-06-16days on market $35,000 Active 125 DOM
-
2026-06-15days on market $35,000 Active 124 DOM
-
2026-06-14days on market $35,000 Active 122 DOM
-
2026-06-13days on market $35,000 Active 121 DOM
-
2026-06-10days on market $35,000 Active 119 DOM
-
2026-06-09days on market $35,000 Active 118 DOM
-
2026-06-08days on market $35,000 Active 117 DOM
-
2026-06-07days on market $35,000 Active 116 DOM
-
2026-06-03days on market $35,000 Active 112 DOM
-
2026-06-02days on market $35,000 Active 111 DOM
-
2026-06-01days on market $35,000 Active 110 DOM
-
2026-05-31days on market $35,000 Active 109 DOM
-
2026-05-30days on market $35,000 Active 108 DOM
-
2026-05-15price $35,000 394-char remark
Show marketing remark (394 chars)
Welcome to this fixer-upper with great investment potential. This 1,140 sq ft home offers 2 bedrooms and 1.5 bathrooms. A spacious dining room. 1st floor laundry room potential 3rd bedroom and a full basement providing ample storage or future living space. An attached garage adds convenience. A solid opportunity for investors or buyers ready to add value. Nice size Backyard for entertaining.
-
2026-04-09price $39,500 394-char remark
Show marketing remark (394 chars)
Welcome to this fixer-upper with great investment potential. This 1,140 sq ft home offers 2 bedrooms and 1.5 bathrooms. A spacious dining room. 1st floor laundry room potential 3rd bedroom and a full basement providing ample storage or future living space. An attached garage adds convenience. A solid opportunity for investors or buyers ready to add value. Nice size Backyard for entertaining.
-
2026-04-08price $39,500 394-char remark
Show marketing remark (394 chars)
Welcome to this fixer-upper with great investment potential. This 1,140 sq ft home offers 2 bedrooms and 1.5 bathrooms. A spacious dining room. 1st floor laundry room potential 3rd bedroom and a full basement providing ample storage or future living space. An attached garage adds convenience. A solid opportunity for investors or buyers ready to add value. Nice size Backyard for entertaining.
-
2026-02-11$40,000 Active 394-char remark
Show marketing remark (394 chars)
Welcome to this fixer-upper with great investment potential. This 1,140 sq ft home offers 2 bedrooms and 1.5 bathrooms. A spacious dining room. 1st floor laundry room potential 3rd bedroom and a full basement providing ample storage or future living space. An attached garage adds convenience. A solid opportunity for investors or buyers ready to add value. Nice size Backyard for entertaining.
ⓘ Source: listings_history table (triggers on properties + properties_extension) + one-shot
backfill from property_details.listing_events for pre-trigger history.
Tax reassessment forecast MI · Partial reset (capped growth)
- Current annual tax
- $1,305 · $109/mo
- Projected year-2 tax
- $1,305 · $109/mo
- Expected delta
- $0/yr ($0/mo · 0.0%)
ⓘ Screening estimate from a state-policy table — verify with the county assessor before closing.
Climate risk First Street
- Flood 1/10 Low FEMA zone X (unshaded) · 0% chance over 30 yrs
- Wildfire 1/10 Low
- Heat 2/10 Low 7 d/yr ≥97°F today · 14 d/yr by 30 yrs out
- Wind 2/10 Low
- Air quality 2/10 Low 1 unhealthy d/yr today · 3 by 30 yrs out
Nearby sold comps map
Loading sold comps map…
Walkable amenities ~0.75 mi
Loading nearby amenities…
Taxation est. · year 1
- Rental income
- $13,273
- − Mortgage interest
- −$1,961
- − Property taxes
- −$1,305
- − Insurance
- −$175
- − Repairs & maintenance
- −$1,062
- − Management
- −$1,062
- − Depreciation
- −$1,018
- Taxable income
- $6,691
- Est. tax owed @ 24.0%
- −$1,606
- After-tax cash flow
- $5,198/yr
For passive investors: Depreciation is non-cash, so a rental often shows a tax loss while cash-flowing — sheltering income. Rental losses are passive: they offset passive income freely, and up to $25,000/yr can offset ordinary (W-2) income if you actively participate and your MAGI is under $100k (phasing out to $0 by $150k); unused losses carry forward. On sale, claimed depreciation is recaptured at up to 25%, and gains may owe capital-gains tax (a 1031 exchange can defer both). Figures are a year-1 estimate at your 24.0% rate — not tax advice; consult a CPA.
Schools (NCES district)
- District
- Beecher Community School District
- NCES district ID
- 2604500
- Math proficiency
- 7% ▲ 3.00%
- Reading proficiency
- 10% ▼ -2.00%
- Median HH income
- $27,719
- Composite
- 9.96/100
- National rank
- #14685
- State rank
- #722 of 760 in MI
Livability — Mount Morris
- Score
- 68/100
- State rank
- #357
- US rank
- #9095
Category grades
Schools grade is shown separately in the Schools card above.
Census & demographics
- Census place
- Beecher, MI
- County
- Genesee County · 221,329 people
- City population
- 19,519
- Metro
- Flint, MI
- Population (ZIP)
- 19,519
- Household income
- $46,797
- Rent vs Own
- Severe rent burden
- 724.0
Population outlook (Genesee County) Hauer SSP2
- Today (2025)
- 381,312 people
- By 2030
- 362,731 · -4.9%
- By 2040
- 321,550 · -15.7%
- By 2050
- 279,212 · -26.8%
- By 2075
- 193,336 · -49.3%
- By 2100
- 128,118 · -66.4%
Race, ethnicity, and origin ACS 2023
- Neighborhood character
- Predominantly White (66%)
- Race & ethnicity
- White 66% Black 22% Two or more races 7% Hispanic / Latino 7%
- Hispanic origin (detail)
- Mexican 5%
- Common ancestry
- Lithuanian 5% Romanian 3% Slovak 1%
- Foreign-born
- 2% · Canada
- Languages at home
- 97% English-only · Spanish 2%
Political lean MEDSL · Genesee
- 2024 margin
- Toss-up / Even · D 51.4% · R 47.2% · Other 1.4%
- 2008→2024 swing
- -28.3pp toward R · 2008: 32.5pp · 2024: 4.2pp
- All cycles
- 2024: D+4.2 2020: D+9.3 2016: D+9.5 2012: D+28.2 2008: D+32.5
Not yet ingested
- Civics
- —
Market trends
- HPI YoY
- ▼ -46.45%
- Current HPI
- 244.2061
- Rent YoY
- —
- Metro
- Flint, MI
- State GDP YoY
- ▲ 1.37%
- F500 in state
- 28
Industry mix (Fortune 500 HQ in MI)
| Industry | F500 HQs | Revenue |
|---|---|---|
| Automotive Parts | 3 | $48B |
|
||
| Automotive | 2 | $372B |
|
||
| Chemicals | 1 | $45B |
|
||
| Automotive Retail | 1 | $29B |
|
||
| Healthcare / Medical Devices | 1 | $23B |
|
||
| Automotive Technology | 1 | $20B |
|
||
Price history
-12.5% since first listed6 events — show timeline
- 2026-05-15 Price Changed $35,000 MiRealSource-MiMLS
- 2026-05-15 Price Changed $35,000 REALCOMP
- 2026-04-09 Price Changed $39,500 MiRealSource-MiMLS
- 2026-04-08 Price Changed $39,500 REALCOMP
- 2026-02-11 Listed $40,000 REALCOMP
- 2026-02-11 Listed $40,000 MiRealSource-MiMLS
Property tax history
+2.5%/yrLatest (2025): $1,305 · +187.2% YoY. Source: county tax records.
Cash-flow waterfall
monthlySold comps — $/sqft
last 12 mo · ≤1 miLoading sold comps…