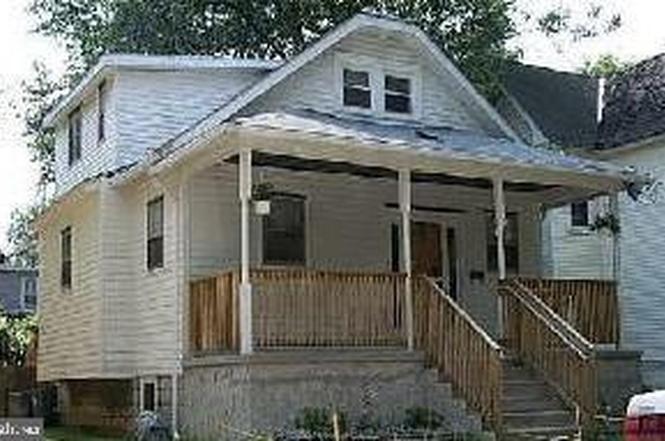
2249 39th St · Camden, NJ
Flood risk 1/10 · Minimal
- FEMA flood zone
- X (unshaded)
- Chance of flooding over 30 yrs
- 0.0%
- Est. flood insurance / yr
- $507 – $1,088
Fire risk 1/10 · Minimal
- Est. fire insurance / yr
- $526 – $976
Heat risk 6/10 · Moderate
- Hot days now (above 104°F)
- 7 days/yr
- Hot days in 30 yrs
- 15 days/yr
Wind risk 6/10 · Moderate
- Chance of severe wind over 30 yrs
- 39.0%
Air-quality risk 4/10 · Minor
- Unhealthy air days now
- 5 days/yr
- Unhealthy air days in 30 yrs
- 6 days/yr
Risk factors via First Street. Map © Google.
Why this score? — see what drove the B grade
The composite is a weighted blend of 9 inputs, each scored 0–100. Each bar is that input's sub-score; the figure is the points it added to the 100-point composite (weight × sub-score).
- Cash flow +27.4/30.0
- ARV discount +15.0/15.0
- 1% rule +10.0/10.0
- DSCR +9.6/10.0
- Livability +3.5/5.0
- Rent growth +2.5/5.0
- Condition / age +2.5/5.0
- Schools +2.0/10.0
- Appreciation +0.0/10.0
$150,000
🖨 Deal sheet (PDF) 📄 Offer letter ✓ Due diligence
Listing remarks MLS
Nicely Redone Home New Kitchen And Updated Baths Fresh Paint New Carpet Some New Windows, New Electrical Service 200 Amp Home Showes Nicely
Key facts
- Forced-air heating
- 3,999 sq ft lot
- Built 1924
Tags
Neighborhood map
What this means for you Summary
Snapshot
- This is a 3-bed/2.0-bath single-family listed at $150k.
Deal economics
- At list price, monthly cash flow is $439 ($5k/yr) — positive.
- The deal already cash-flows at list — no discount required.
- Meets the 1% rule at list price ($2k rent vs $150k).
- Cap rate 9.8% vs local median 7.0% in Camden — top-decile yield for the area; either an underpriced asset or a hidden risk that comps aren't pricing in. Stress-test before assuming the spread holds.
Location & tenants
- Location reads 70/100 on livability (#262 in NJ) — a middle-class / working-renter tenant base. Strengths: amenities A+, commute A+, cost of living A; Watch: crime F, employment F.
- Pennsauken Township Board Of Education School District (suburban): math 12% / reading 32% proficiency, ranked #410 of 472 in NJ (top 87%) — low school quality limits family demand, transient renter base, plan for 1-2y turnover.
- Zoned schools: Benjamin Franklin Elementary School (math 17% / reading 24%, grade F, #984 of 1,303 statewide, top 76%, 362 students, 39% FRL); Howard M. Phifer Middle School (math 14% / reading 37%, grade F, #359 of 431 statewide, top 84%, 1,045 students, 43% FRL); Pennsauken High School (math 8% / reading 45%, grade F, #319 of 399 statewide, top 80%, 1,530 students, 37% FRL) — zoned schools average 39% FRL vs 56% district-wide (16 pts lower); this property's tenant base skews higher-income than the district average.
- Market conditions: 61 active listings in the ZIP; 18 comparable units currently listed for rent nearby; rentals at typical pace (median 27d on market — plan ~3-4 weeks tenant-placement turnaround); solid renter incomes; 1,018 units permitted in Camden County in 2024 (509 in 5+ unit buildings).
- This rent runs 32% of the median local income ($84k/yr) — at the standard rent-burdened threshold; future hikes will face affordability resistance.
Forward outlook
- Local home prices are declining (-3.0%/yr); year-one equity from $1k of loan paydown is wiped out by about $4k of value loss. Plan a longer hold.
- Camden County population projected to shrink 8% by 2050 — rents likely to lag national; underwrite the cash flow, not the appreciation.
- At projected returns (-3.0% appreciation + 3.0% rent growth), your $42k cash investment doubles in ~9 years — after that, you're playing with house money.
Negotiation context
- Only 8 days on market — expect competitive offers; lowballing is unlikely to land.
- 3 sale attempts since 23y ago with the ask held roughly flat each time — persistent listings suggest the price (not the market) is what's stuck; bring a comps-based counter.
- Current owner paid $112k; 33% above their basis — modest negotiation headroom, anchor on the comps not their cost.
Risks & watch-outs
- Watch-outs: property tax is 3.9% of price; built in 1924 — expect roof / HVAC / electrical / plumbing capex.
- Climate carrying-cost: major wind risk, 39% chance of damaging wind over 30y; extreme-heat days projected 7→15/yr by 2055 (HVAC capex compounding) — expect insurance premiums to compound above CPI over the hold.
Questions for the listing agent
- Built in 1924 — when were the roof, HVAC, electrical panel, plumbing, and water heater last replaced?
- Property tax is high relative to price — has the assessment been appealed recently, and will the sale trigger a re-assessment?
- Is there a deadline driving the sale (1031 exchange, divorce, estate, relocation)? That informs how much negotiation room exists.
- Schools are F-rated, which usually means shorter tenancies and higher turnover. Who's the typical renter profile here, and what's been the actual vacancy rate?
- Crime grade is F in this area — have there been break-ins, vandalism, or insurance claims at this property in the last 3 years? What carrier currently insures it and at what premium?
- What's the average days-on-market for RENTAL listings here right now (not sales)? A rising rental-DOM trend means longer vacancies and softer asking-rent achievability than the comps imply.
- What's the recent tenant-quality profile in this submarket — average credit score on applications, eviction rate, late-payment / NSF rate, and stable-employment percentage? A property-management company in the area should have these aggregated.
- How much new for-sale + rental construction is in the pipeline within 1–3 miles? Heavy new supply typically softens prices + rents 12–24 months out; constrained supply supports both.
Investment metrics
- 1% rule
- 1.50% ✓
- Cap rate
- 9.80%
- Cash-on-cash
- 12.54%
- DSCR
- 1.56
- GRM
- 5.5
CMA / ARV
- ARV (on-the-fly)
- $276,000
- Comps found
- 12
Show comp detail 12 sales within ~0.75 mi
| Address | Dist | Beds/Ba | Sqft | Sold | Price | $/sf | Match |
|---|---|---|---|---|---|---|---|
| 2249 39th St | 0.00mi | 3/2.0 | 1,200 (0%) | 1mo | $201,000 | $168 | 99 |
| 2232 42nd St | 0.18mi | 3/1.5 | 1,196 (-0%) | 4mo | $268,000 | $224 | 86 |
| 243 N 40th St | 0.14mi | 3/2.0 | 1,120 (-7%) | 6mo | $229,900 | $205 | 77 |
| 1763 41st St | 0.44mi | 3/2.0 | 1,260 (+5%) | 2mo | $364,900 | $290 | 70 |
| 2201 38th St | 0.05mi | 4/1.5 (+1) | 1,328 (+11%) | 4mo | $260,000 | $196 | 70 |
| 2503 48th St | 0.45mi | 3/1.0 | 1,248 (+4%) | 3mo | $300,000 | $240 | 65 |
| 1938 W River Dr | 0.50mi | 3/2.0 | 1,129 (-6%) | 4mo | $325,000 | $288 | 63 |
| 1744 43rd St | 0.50mi | 3/1.0 | 1,270 (+6%) | 6mo | $291,595 | $230 | 58 |
| 420 N 36th St | 0.33mi | 3/1.0 | 1,356 (+13%) | 4mo | $186,000 | $137 | 55 |
| 1947 Tinsman Ave | 0.67mi | 3/1.0 | 1,299 (+8%) | 2mo | $340,000 | $262 | 50 |
| 1408 Hillside Ter | 0.74mi | 4/2.0 (+1) | 1,140 (-5%) | 6mo | $325,000 | $285 | 47 |
| 4755 W End Ave | 0.61mi | 2/1.5 (-1) | 1,038 (-14%) | 2mo | $170,000 | $164 | 40 |
Match score weights: distance 35% · size 25% · config 20% · recency 20%. Top-matched comps best support the ARV.
Projected returns pro-forma
-3.0% appreciation · 3.0% rent growth · sell at horizon
- IRR
- 2.4%
- Equity multiple
- 1.09×
- Total profit
- $3,873
- Equity at exit
- $22,365
- IRR
- 12.1%
- Equity multiple
- 1.96×
- Total profit
- $40,274
- Equity at exit
- $12,969
Cash invested: $42,000 (down + closing). Projections, not guarantees.
Landlord ↔ Tenant lean methodology
- Overall (STATE)
- 21 Tenant-Leaning
- State New Jersey
- 21 Tenant-Leaning · D+6
- County
- — inherits STATE
- City
- — inherits STATE
ZIP-level market 08110
- Home prices YoY
- -10.9%
- Active inventory
- 61
- Price-to-rent
- 5.5×
Monthly cashflow live
- Estimated rent
- $2,255 high interval (Pro) →
- Mortgage (P&I)
- −$787
- Tax from tax record
- −$493 /mo · $5,916/yr
- Insurance
- −$62
- HOA
- −$0
- Vacancy / Maint / Mgmt
- −$473
- Net cashflow
- $439
Break-even live
Sensitivity live
| Price | -10% $524 | -5% $481 | +0% $439 | +5% $397 | +10% $354 |
|---|---|---|---|---|---|
| Rent | -10% $261 | -5% $350 | +0% $439 | +5% $528 | +10% $617 |
| Rate | -1.0pp $515 | -0.5pp $477 | base $439 | +0.5pp $400 | +1.0pp $361 |
UW: 25.0% down · 7.5% · 30yr · 1.5% tax · 5.0% vac · 8.0% maint · 8.0% mgmt
Financing live
Cash to close
- Down payment
- $37,500
- Closing costs
- $4,500
- Reserves months
- —
- Total cash needed
- —
Loan-product check · same deal, 3 products live
Conventional
25% down · 7.5% · 30yr
- Down + closing
- —
- Monthly P&I
- —
- Monthly cashflow
- —
- DSCR
- —
- Eligible?
- —
Personal DTI + credit; lowest rate.
DSCR
20% down · 8.5% · 30yr
- Down + closing
- —
- Monthly P&I
- —
- Monthly cashflow
- —
- DSCR
- —
- Eligible?
- —
No personal income docs; deal must DSCR.
Hard money
10% down · 12.0% · 12mo
- Down + closing
- —
- Monthly P&I
- —
- Monthly cashflow
- —
- DSCR
- —
- Eligible?
- —
Short-term bridge; refi at stabilization.
Rent comps 18 comps
| Address | Beds | Baths | Sqft | Rent | $/sqft | DOM | Units | Dist |
|---|---|---|---|---|---|---|---|---|
| 106 N 34th St Unit B Camden, NJ | 3.0 | 2.0 | 900 | $1,950 | $2.17 | 26d | 1 | 0.26mi |
| 4621 Woodland Ave Pennsauken, NJ | 3.0 | 1.5 | 1148 | $2,200 | $1.92 | 26d | 1 | 0.39mi |
| 4601 High St Pennsauken, NJ | 1.0–2.0 | 1.0 | 800 | $1,675 | $2.09 | 5d | 4 | 0.47mi |
| 2323 Browning Rd Pennsauken, NJ | 3.0 | 1.0 | 923 | $2,500 | $2.71 | 26d | 1 | 0.53mi |
| 380 Garden Ave Camden, NJ | 2.0 | 2.0 | 1184 | $2,100 | $1.77 | 26d | 1 | 0.79mi |
| 2277 Hollinshed Ave Pennsauken, NJ | 3.0 | 1.5 | 1164 | $2,400 | $2.06 | 26d | 1 | 0.84mi |
| 5729 Irving Ave Pennsauken, NJ | 3.0 | 1.5 | 1200 | $2,150 | $1.79 | 18d | 1 | 0.87mi |
| 2754 Mickle St Camden, NJ | 3.0 | 1.0 | 1500 | $1,850 | $1.23 | 0d | 1 | 0.87mi |
| 2752 Mickle St Camden, NJ | 3.0 | 1.0 | 1450 | $1,850 | $1.28 | 18d | 1 | 0.88mi |
| 1535 Gross Ave Pennsauken, NJ | 3.0 | 1.0 | 1272 | $2,150 | $1.69 | 26d | 1 | 0.91mi |
| 324 S 27th St Camden, NJ | 3.0 | 1.0 | 1152 | $1,900 | $1.65 | 26d | 1 | 0.94mi |
| 5122 Garfield Ave Pennsauken, NJ | 3.0 | 1.0 | 1308 | $2,500 | $1.91 | 26d | 1 | 0.96mi |
| 4137 Marlton Pike Pennsauken Township, NJ | 2.0 | 1.0 | 900 | $1,800 | $2.00 | 26d | 1 | 1.08mi |
| 6366 Rogers Ave Unit 3 Pennsauken Township, NJ | 3.0 | 1.0 | 1100 | $2,100 | $1.91 | 26d | 1 | 1.15mi |
| 5454 Burwood Ave Pennsauken, NJ | 3.0 | 1.5 | 1419 | $2,650 | $1.87 | 7d | 1 | 1.37mi |
| 200 E Maple Ave Unit 10 Merchantville, NJ | 2.0 | 1.0 | 1000 | $2,000 | $2.00 | 6d | 1 | 1.40mi |
| 200 E Maple Ave Apt 13 Merchantville, NJ | 2.0 | 1.0 | 1000 | $2,000 | $2.00 | 5d | 1 | 1.40mi |
| 200 E Maple Ave Unit 08 Merchantville, NJ | 2.0 | 1.0 | 1000 | $2,000 | $2.00 | 20d | 1 | 1.40mi |
Listing history 9 events
-
2026-04-28status Pending
-
2026-03-05historical Active Under Contract
-
2026-02-25$150,000 Active
-
2004-09-03soldstatus $112,500
-
2004-07-30soldstatus $112,500 140-char remark
Show marketing remark (140 chars)
Nicely Redone Home New Kitchen And Updated Baths Fresh Paint New Carpet Some New Windows, New Electrical Service 200 Amp Home Showes Nicely
-
2004-06-20$112,500 140-char remark
Show marketing remark (140 chars)
Nicely Redone Home New Kitchen And Updated Baths Fresh Paint New Carpet Some New Windows, New Electrical Service 200 Amp Home Showes Nicely
-
2004-04-19soldstatus $71,500
-
2004-03-30soldstatus $71,500 199-char remark
Show marketing remark (199 chars)
This Is A Handy Man Needs Paint & Paper But Has An Inlaw Suite On Upstairs Level. 2bed Down And 1 Bed Up. Loads Of Potential Not That Far From The Mark Has C/A. Property Being Sold As Is No Fha
-
2003-10-01$71,500 199-char remark
Show marketing remark (199 chars)
This Is A Handy Man Needs Paint & Paper But Has An Inlaw Suite On Upstairs Level. 2bed Down And 1 Bed Up. Loads Of Potential Not That Far From The Mark Has C/A. Property Being Sold As Is No Fha
ⓘ Source: listings_history table (triggers on properties + properties_extension) + one-shot
backfill from property_details.listing_events for pre-trigger history.
Tax reassessment forecast NJ · Partial reset (capped growth)
- Current annual tax
- $5,916 · $493/mo
- Projected year-2 tax
- $5,916 · $493/mo
- Expected delta
- $0/yr ($0/mo · 0.0%)
ⓘ Screening estimate from a state-policy table — verify with the county assessor before closing.
Climate risk First Street
- Flood 1/10 Low FEMA zone X (unshaded) · 0% chance over 30 yrs
- Wildfire 1/10 Low
- Heat 6/10 Major 7 d/yr ≥104°F today · 15 d/yr by 30 yrs out
- Wind 6/10 Major 39% chance of damaging wind over 30 yrs
- Air quality 4/10 Moderate 5 unhealthy d/yr today · 6 by 30 yrs out
Nearby sold comps map
Loading sold comps map…
Walkable amenities ~0.75 mi
Loading nearby amenities…
Taxation est. · year 1
- Rental income
- $27,055
- − Mortgage interest
- −$8,402
- − Property taxes
- −$5,916
- − Insurance
- −$750
- − Repairs & maintenance
- −$2,164
- − Management
- −$2,164
- − Depreciation
- −$4,364
- Taxable income
- $3,294
- Est. tax owed @ 24.0%
- −$790
- After-tax cash flow
- $4,477/yr
For passive investors: Depreciation is non-cash, so a rental often shows a tax loss while cash-flowing — sheltering income. Rental losses are passive: they offset passive income freely, and up to $25,000/yr can offset ordinary (W-2) income if you actively participate and your MAGI is under $100k (phasing out to $0 by $150k); unused losses carry forward. On sale, claimed depreciation is recaptured at up to 25%, and gains may owe capital-gains tax (a 1031 exchange can defer both). Figures are a year-1 estimate at your 24.0% rate — not tax advice; consult a CPA.
Schools (NCES district)
- District
- Pennsauken Township Board Of Education School District
- NCES district ID
- 3412870
- Math proficiency
- 12% ▼ -16.00%
- Reading proficiency
- 32% ▼ -3.00%
- Median HH income
- $60,336
- Composite
- 20.48/100
- National rank
- #8573
- State rank
- #410 of 472 in NJ
Livability — Camden
- Score
- 70/100
- State rank
- #262
- US rank
- #7721
Category grades
Schools grade is shown separately in the Schools card above.
Census & demographics
- County
- Camden County · 407,624 people
- City population
- 20,865
- Metro
- Philadelphia-Camden-Wilmington, PA-NJ-DE-MD
- Population (ZIP)
- 19,158
- Household income
- $83,729
- Rent vs Own
- Severe rent burden
- 404.0
Population outlook (Camden County) Hauer SSP2
- Today (2025)
- 507,964 people
- By 2030
- 502,182 · -1.1%
- By 2040
- 485,602 · -4.4%
- By 2050
- 465,630 · -8.3%
- By 2075
- 419,986 · -17.3%
- By 2100
- 369,492 · -27.3%
Race, ethnicity, and origin ACS 2023
- Neighborhood character
- Diverse neighborhood (Simpson 0.67)
- Race & ethnicity
- Hispanic / Latino 46% Black 30% White 14% Two or more races 13% Asian 7% Native American 2%
- Hispanic origin (detail)
- Mexican 5% Puerto Rican 17% Dominican 16%
- Common ancestry
- Romanian 2% Hispanic 1% Iranian 1%
- Foreign-born
- 28% · Canada, Vietnam, Jamaica
- Languages at home
- 52% English-only · Spanish 35% Vietnamese 4% French/Haitian/Cajun 1%
Political lean MEDSL · Camden
- 2024 margin
- Strong D (+27.4) · D 63.0% · R 35.5% · Other 1.5%
- 2008→2024 swing
- -8.8pp toward R · 2008: 36.2pp · 2024: 27.4pp
- All cycles
- 2024: D+27.4 2020: D+33.5 2016: D+32.4 2012: D+36.6 2008: D+36.2
Not yet ingested
- Civics
- —
Market trends
- HPI YoY
- ▼ -53.44%
- Current HPI
- 436.2879
- Rent YoY
- —
- Metro
- Philadelphia-Camden-Wilmington, PA-NJ-DE-MD
- State GDP YoY
- ▲ 2.05%
- F500 in state
- 34
Industry mix (Fortune 500 HQ in NJ)
| Industry | F500 HQs | Revenue |
|---|---|---|
| Consumer Goods | 3 | $31B |
|
||
| Pharmaceuticals | 2 | $153B |
|
||
| Technology | 2 | $21B |
|
||
| Insurance | 2 | $20B |
|
||
| Healthcare | 2 | $19B |
|
||
| Financial Services | 1 | $70B |
|
||
Price history
+109.8% since first listed9 events — show timeline
- 2026-04-28 Pending — BRIGHT MLS
- 2026-03-05 Contingent — BRIGHT MLS
- 2026-02-25 Listed $150,000 BRIGHT MLS
- 2004-09-03 Sold (Public Records) $112,500 Public Records
- 2004-07-30 Sold (MLS) $112,500 BRIGHT MLS
- 2004-06-20 Listed $112,500 BRIGHT MLS
- 2004-04-19 Sold (Public Records) $71,500 Public Records
- 2004-03-30 Sold (MLS) $71,500 BRIGHT MLS
- 2003-10-01 Listed $71,500 BRIGHT MLS
Property tax history
+4.0%/yrLatest (2025): $5,916 · +34.3% YoY. Source: county tax records.
Cash-flow waterfall
monthlySold comps — $/sqft
last 12 mo · ≤1 miLoading sold comps…