 🌊 Lakefront
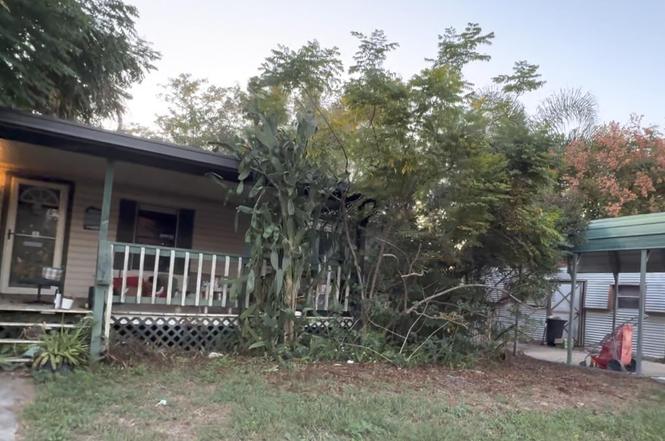
169 Jewel Ave · Interlachen, FL
Flood risk 1/10 · Minimal
- FEMA flood zone
- A
- Chance of flooding over 30 yrs
- 0.0%
- Est. flood insurance / yr
- $1,009 – $1,996
Fire risk 6/10 · Moderate
- Est. fire insurance / yr
- $947 – $1,759
Heat risk 8/10 · Major
- Hot days now (above 109°F)
- 7 days/yr
- Hot days in 30 yrs
- 19 days/yr
Wind risk 9/10 · Severe
- Chance of severe wind over 30 yrs
- 99.0%
Air-quality risk 2/10 · Minimal
- Unhealthy air days now
- 1 days/yr
- Unhealthy air days in 30 yrs
- 2 days/yr
Risk factors via First Street. Map © Google.
Why this score? — see what drove the D+ grade
The composite is a weighted blend of 9 inputs, each scored 0–100. Each bar is that input's sub-score; the figure is the points it added to the 100-point composite (weight × sub-score).
- Cash flow +17.3/30.0
- ARV discount +7.5/15.0
- DSCR +5.4/10.0
- 1% rule +4.0/10.0
- Livability +3.4/5.0
- Schools +3.0/10.0
- Rent growth +2.5/5.0
- Condition / age +2.5/5.0
- Appreciation +0.0/10.0
$126,000
🖨 Deal sheet (PDF) 📄 Offer letter ✓ Due diligence
Listing remarks MLS
Fishing is Great! Surround yourself with water! This lovely, well maintained property is directly on Lake Rocky which is an excellent swimming and fishing lake. You can boat over to Jewel Lake by canal (also view of Jewel Lake from living room)for larger boat activity or take the canal to Lake Faye for more fishing. Large home with living room and family room with fireplace provide lots of space for entertaining. Outside you'll find a covered dock with fish cleaning sink and lush landscaping including mature fruit trees, large lakeside deck, and all on a dead end street. When you turn onto Jewel Av your mood will lift and memory making will begin!
Key facts
- Mature fruit trees
- Fish cleaning sink
- Large lakeside deck
Tags
Property features AI
Finance
- HOA & community: Not a senior community
Exterior
- Parking: Carport (2 spaces)
- Utilities: Septic tank; Electricity connected
- Home design: Mobile home; Residential use
- Exterior features: Dock; Lake front / waterfront
Interior
- Kitchen: Electric range
- Bedrooms: 3 bedrooms (main level)
- Bathrooms: 2 full bathrooms
- Heating & cooling: Central heating; Central air conditioning
- Interior features: 3 total rooms; Living room (approximately 16 x 12)
- Laundry & utility: Electricity connected
Neighborhood map
What this means for you Summary
Snapshot
- This is a 3-bed/2.0-bath manufactured listed at $126k.
Deal economics
- At list price, monthly cash flow is $-32 ($-385/yr) — negative.
- To cash-flow at today's rent, offer at most $120k (4.5% below list).
- To meet the 1% rule (rent ≥ 1% of price), the offer needs to be $114k (9.9% below list).
- Recommended offer: $114k (9.9% below list) — sets the bar for 1% rule.
- Cap rate 7.2% vs local median 5.2% in Interlachen — top-decile yield for the area; either an underpriced asset or a hidden risk that comps aren't pricing in. Stress-test before assuming the spread holds.
Location & tenants
- Location reads 67/100 on livability (#540 in FL) — a middle-class / working-renter tenant base. Strengths: crime A+, cost of living A+, housing A+; Watch: amenities F, commute F, employment F.
- Putnam (town): math 34% / reading 39% proficiency, ranked #66 of 73 in FL (top 90%) — families likely to look elsewhere, expect single-tenant / working-renter base with shorter leases; 71% free/reduced lunch — lower-income household profile, screen leases tightly.
- Zoned schools: Robert H. Jenkins Jr Elementary School (math 34% / reading 32%, grade F, #1,773 of 2,144 statewide, top 83%, 904 students, 64% FRL); Putnam Academy of Arts And Sciences (math 42% / reading 52%, grade D+, #291 of 571 statewide, top 52%, 177 students, 75% FRL, charter); Interlachen Jr-Sr High School (math 16% / reading 32%, grade F, #529 of 667 statewide, top 80%, 1,097 students, 71% FRL) — zoned schools at 70% FRL track the district average.
- Market conditions: 762 active listings in the ZIP; 113 units permitted in Putnam County in 2024 (0 in 5+ unit buildings).
Forward outlook
- Local home prices are declining (-3.0%/yr); year-one equity from $871 of loan paydown is wiped out by about $4k of value loss. Plan a longer hold.
- Putnam County population projected at -31% by 2050 — secular population decline; favor cash flow + early exit over multi-decade hold.
Negotiation context
- It's been on market 110 days — a 9% lower offer ($115k) is reasonable based on typical stale-listing flexibility.
- 6 sale attempts since 21y ago; this cycle's ask has dropped $9k (7%) from the opening price — seller is motivated, your offer sets the floor, not the list.
- Current owner paid $89k; 42% above their basis — modest negotiation headroom, anchor on the comps not their cost.
Risks & watch-outs
- Watch-outs: flood insurance adds $125/mo.
- Climate carrying-cost: in FEMA flood zone A (mandatory federal flood insurance); severe wind risk, 99% chance of damaging wind over 30y; major wildfire risk; extreme-heat days projected 7→19/yr by 2055 (HVAC capex compounding) — expect insurance premiums to compound above CPI over the hold.
Questions for the listing agent
- What do current leases actually rent for vs. the listed asking? Can we see a recent rent roll and the last 12 months of T-12 income?
- It's been on market 110 days. Have you received any prior offers? Is the seller open to a 10% concession, seller financing, or rate buy-down credit?
- What's the actual annual flood-insurance premium (NFIP or private), and is the property in a SFHA with mandatory coverage?
- Why hasn't it sold? Are there any deal-killer items the seller is aware of (foundation, flood, title, zoning, code violations)?
- Is there a deadline driving the sale (1031 exchange, divorce, estate, relocation)? That informs how much negotiation room exists.
- Schools are D-rated, which usually means shorter tenancies and higher turnover. Who's the typical renter profile here, and what's been the actual vacancy rate?
- The area grade is low — what's the realistic commute time and amenity access for the typical tenant pool here? Any planned neighborhood developments (good or bad) we should know about?
- This sits on a lake — are riparian / water-frontage rights deeded with the parcel? Any dock permits, shoreline easements, or HOA water-use restrictions?
- What's the documented flood / surge / shoreline-erosion history here (FEMA AND non-FEMA — e.g., storm surge, creek backup, septic-field saturation)?
- Any water-quality or seasonal algae-bloom issues that affect tenant satisfaction or short-term-rental demand?
- What's the average days-on-market for RENTAL listings here right now (not sales)? A rising rental-DOM trend means longer vacancies and softer asking-rent achievability than the comps imply.
- What's the recent tenant-quality profile in this submarket — average credit score on applications, eviction rate, late-payment / NSF rate, and stable-employment percentage? A property-management company in the area should have these aggregated.
- How much new for-sale + rental construction is in the pipeline within 1–3 miles? Heavy new supply typically softens prices + rents 12–24 months out; constrained supply supports both.
Investment metrics
- 1% rule
- 0.90% ✗
- Cap rate
- 7.18%
- Cash-on-cash
- 3.17%
- DSCR
- 1.14
- GRM
- 9.3
CMA / ARV
- ARV (on-the-fly)
- $256,284
- Comps found
- 7
Show comp detail 7 sales within ~0.75 mi
| Address | Dist | Beds/Ba | Sqft | Sold | Price | $/sf | Match |
|---|---|---|---|---|---|---|---|
| 169 Jewel Ave | 0.00mi | 3/2.0 | 1,680 (0%) | 1mo | $80,000 | $48 | 100 |
| 412 64th St | 0.38mi | 2/2.0 (-1) | 1,720 (+2%) | 0mo | $95,000 | $55 | 73 |
| 107 Oak Cir E | 0.69mi | 3/2.0 | 1,708 (+2%) | 14mo | $215,000 | $126 | 53 |
| 126 Mirror Lake Dr | 0.74mi | 2/2.0 (-1) | 1,620 (-4%) | 2mo | $100,000 | $62 | 52 |
| 184 Violet Cir | 0.70mi | 2/2.0 (-1) | 1,680 (0%) | 12mo | $189,900 | $113 | 52 |
| 116 Mangels Dr | 0.22mi | 2/2.0 (-1) | 1,434 (-15%) | 16mo | $255,000 | $178 | 47 |
| 222 Kitty Ave | 0.74mi | 2/2.0 (-1) | 1,469 (-13%) | 14mo | $254,000 | $173 | 28 |
Match score weights: distance 35% · size 25% · config 20% · recency 20%. Top-matched comps best support the ARV.
Projected returns pro-forma
-3.0% appreciation · 3.0% rent growth · sell at horizon
- IRR
- -18.0%
- Equity multiple
- 0.36×
- Total profit
- $-22,410
- Equity at exit
- $18,787
- IRR
- -10.2%
- Equity multiple
- 0.38×
- Total profit
- $-21,934
- Equity at exit
- $10,894
Cash invested: $35,280 (down + closing). Projections, not guarantees.
Landlord ↔ Tenant lean methodology
- Overall (STATE)
- 87 Strongly Landlord-Friendly
- State Florida
- 87 Strongly Landlord-Friendly · R+3
- County
- — inherits STATE
- City
- — inherits STATE
ZIP-level market 32148
- Home prices YoY
- -5.8%
- Active inventory
- 762
- Price-to-rent
- 9.3×
Monthly cashflow live
- Estimated rent
- $1,135 medium interval (Pro) →
- Mortgage (P&I)
- −$661
- Tax from tax record
- −$90 /mo · $1,084/yr
- Insurance
- −$52
- Flood insurance flood zone
- −$125 /mo · $1,502/yr
- HOA
- −$0
- Lot rent leased land?
- −$0
- Vacancy / Maint / Mgmt
- −$238
- Net cashflow
- $-32
Break-even live
Sensitivity live
| Price | -10% $39 | -5% $4 | +0% $-32 | +5% $-68 | +10% $-103 |
|---|---|---|---|---|---|
| Rent | -10% $-122 | -5% $-77 | +0% $-32 | +5% $13 | +10% $58 |
| Rate | -1.0pp $31 | -0.5pp $0 | base $-32 | +0.5pp $-65 | +1.0pp $-98 |
UW: 25.0% down · 7.5% · 30yr · 1.5% tax · 5.0% vac · 8.0% maint · 8.0% mgmt
Financing live
Cash to close
- Down payment
- $31,500
- Closing costs
- $3,780
- Reserves months
- —
- Total cash needed
- —
Loan-product check · same deal, 3 products live
Conventional
25% down · 7.5% · 30yr
- Down + closing
- —
- Monthly P&I
- —
- Monthly cashflow
- —
- DSCR
- —
- Eligible?
- —
Personal DTI + credit; lowest rate.
DSCR
20% down · 8.5% · 30yr
- Down + closing
- —
- Monthly P&I
- —
- Monthly cashflow
- —
- DSCR
- —
- Eligible?
- —
No personal income docs; deal must DSCR.
Hard money
10% down · 12.0% · 12mo
- Down + closing
- —
- Monthly P&I
- —
- Monthly cashflow
- —
- DSCR
- —
- Eligible?
- —
Short-term bridge; refi at stabilization.
Listing history 2 events
-
2026-06-02remarks 699-char remark
-
2026-06-02$126,000 Pending 110 DOM
ⓘ Source: listings_history table (triggers on properties + properties_extension) + one-shot
backfill from property_details.listing_events for pre-trigger history.
Tax reassessment forecast FL · Resets to sale price
- Current annual tax
- $1,084 · $90/mo
- Projected year-2 tax
- $1,084 · $90/mo
- Expected delta
- $0/yr ($0/mo · 0.0%)
ⓘ Screening estimate from a state-policy table — verify with the county assessor before closing.
Climate risk First Street
- Flood 1/10 Low FEMA zone A · 0% chance over 30 yrs
- Wildfire 6/10 Major
- Heat 8/10 Severe 7 d/yr ≥109°F today · 19 d/yr by 30 yrs out
- Wind 9/10 Extreme 99% chance of damaging wind over 30 yrs
- Air quality 2/10 Low 1 unhealthy d/yr today · 2 by 30 yrs out
Nearby sold comps map
Loading sold comps map…
Walkable amenities ~0.75 mi
Loading nearby amenities…
Taxation est. · year 1
- Rental income
- $13,620
- − Mortgage interest
- −$7,058
- − Property taxes
- −$1,084
- − Insurance
- −$2,132
- − Repairs & maintenance
- −$1,090
- − Management
- −$1,090
- − Depreciation
- −$3,665
- Taxable loss
- −$2,499
- Est. tax savings @ 24.0%
- +$600
- After-tax cash flow
- $214/yr
For passive investors: Depreciation is non-cash, so a rental often shows a tax loss while cash-flowing — sheltering income. Rental losses are passive: they offset passive income freely, and up to $25,000/yr can offset ordinary (W-2) income if you actively participate and your MAGI is under $100k (phasing out to $0 by $150k); unused losses carry forward. On sale, claimed depreciation is recaptured at up to 25%, and gains may owe capital-gains tax (a 1031 exchange can defer both). Figures are a year-1 estimate at your 24.0% rate — not tax advice; consult a CPA.
Schools (NCES district)
- District
- Putnam
- NCES district ID
- 1201620
- Math proficiency
- 34% ▼ -10.00%
- Reading proficiency
- 39% ▼ -4.00%
- Median HH income
- $33,350
- Composite
- 29.99/100
- National rank
- #6361
- State rank
- #66 of 73 in FL
Livability — Interlachen
- Score
- 67/100
- State rank
- #540
- US rank
- #10162
Category grades
Schools grade is shown separately in the Schools card above.
Census & demographics
- City population
- 11,580
- Population (ZIP)
- 11,580
Population outlook (Putnam County) Hauer SSP2
- Today (2025)
- 65,299 people
- By 2030
- 61,255 · -6.2%
- By 2040
- 52,930 · -18.9%
- By 2050
- 45,051 · -31.0%
- By 2075
- 28,720 · -56.0%
- By 2100
- 15,852 · -75.7%
Race, ethnicity, and origin ACS 2023
- Neighborhood character
- Predominantly White (84%)
- Race & ethnicity
- White 84% Hispanic / Latino 9% Two or more races 8% Black 3%
- Hispanic origin (detail)
- Mexican 2% Puerto Rican 7%
- Common ancestry
- Slovak 4% Lithuanian 3% Romanian 1%
- Foreign-born
- 2% · Canada
- Languages at home
- 94% English-only · Spanish 4%
Political lean MEDSL · Putnam
- 2024 margin
- Solid R (+47.8) · D 25.8% · R 73.6%
- 2008→2024 swing
- -28.5pp toward R · 2008: -19.3pp · 2024: -47.8pp
- All cycles
- 2024: R+47.8 2020: R+41.2 2016: R+36.6 2012: R+24.5 2008: R+19.3
Not yet ingested
- Civics
- —
Market trends
- HPI YoY
- ▼ -16.98%
- Current HPI
- 277.2763
- Rent YoY
- —
- Metro
- —
- State GDP YoY
- ▲ 3.28%
- F500 in state
- 36
Industry mix (Fortune 500 HQ in FL)
| Industry | F500 HQs | Revenue |
|---|---|---|
| Industrial Technology | 2 | $29B |
|
||
| Insurance | 2 | $17B |
|
||
| Retail | 1 | $60B |
|
||
| Technology Distribution | 1 | $58B |
|
||
| Homebuilding | 1 | $35B |
|
||
| Technology Manufacturing | 1 | $35B |
|
||
Price history
+80.0% since first listed25 events — show timeline
- 2026-06-01 Pending — realMLS
- 2026-05-18 Listing Removed — realMLS
- 2026-02-23 Price Changed $126,000 realMLS
- 2026-01-28 Listed $135,000 realMLS
- 2018-06-21 Sold (Public Records) $89,000 Public Records
- 2018-06-20 Sold (MLS) $89,000 realMLS
- 2018-05-26 Pending — realMLS
- 2018-05-08 Listed $89,900 realMLS
- 2018-05-07 Listing Removed — realMLS
- 2018-03-28 Relisted — realMLS
- 2018-03-26 Listing Removed — realMLS
- 2018-01-31 Price Changed $89,900 realMLS
- 2018-01-28 Price Changed $94,500 realMLS
- 2018-01-07 Price Changed $99,999 realMLS
- 2017-11-11 Price Changed $109,200 realMLS
- 2017-09-25 Listed $110,200 realMLS
- 2013-04-12 Sold (Public Records) $70,000 Public Records
- 2013-04-09 Sold (MLS) $70,000 realMLS
- 2012-09-04 Listed $84,000 realMLS
- 2005-07-12 Sold (Public Records) $97,000 Public Records
- 2005-07-07 Listing Removed — realMLS
- 2005-07-01 Sold (MLS) $97,000 realMLS
- 2005-03-23 Listed $104,900 realMLS
- 2000-06-16 Sold (Public Records) $69,000 Public Records
- 1996-06-04 Sold (Public Records) $70,000 Public Records
Property tax history
-0.3%/yrLatest (2025): $1,084 · +12.8% YoY. Source: county tax records.
Cash-flow waterfall
monthlySold comps — $/sqft
last 12 mo · ≤1 miLoading sold comps…