2813 Biddie St · Pea Ridge, AR
Flood risk 1/10 · Minimal
- FEMA flood zone
- X (unshaded)
- Chance of flooding over 30 yrs
- 0.0%
- Est. flood insurance / yr
- $507 – $1,088
Fire risk 5/10 · Moderate
- Est. fire insurance / yr
- $1,499 – $2,785
Heat risk 5/10 · Moderate
- Hot days now (above 104°F)
- 7 days/yr
- Hot days in 30 yrs
- 21 days/yr
Wind risk 3/10 · Minor
- Chance of severe wind over 30 yrs
- 5.0%
Air-quality risk 2/10 · Minimal
- Unhealthy air days now
- 0 days/yr
- Unhealthy air days in 30 yrs
- 1 days/yr
Risk factors via First Street. Map © Google.
Why this score? — see what drove the D grade
The composite is a weighted blend of 9 inputs, each scored 0–100. Each bar is that input's sub-score; the figure is the points it added to the 100-point composite (weight × sub-score).
- Appreciation +8.7/10.0
- Cash flow +8.2/30.0
- ARV discount +6.8/15.0
- Schools +3.7/10.0
- Livability +3.4/5.0
- 1% rule +2.6/10.0
- Rent growth +2.5/5.0
- Condition / age +2.5/5.0
- DSCR +2.2/10.0
$271,700
🖨 Deal sheet (PDF) 📄 Offer letter ✓ Due diligence
Listing remarks
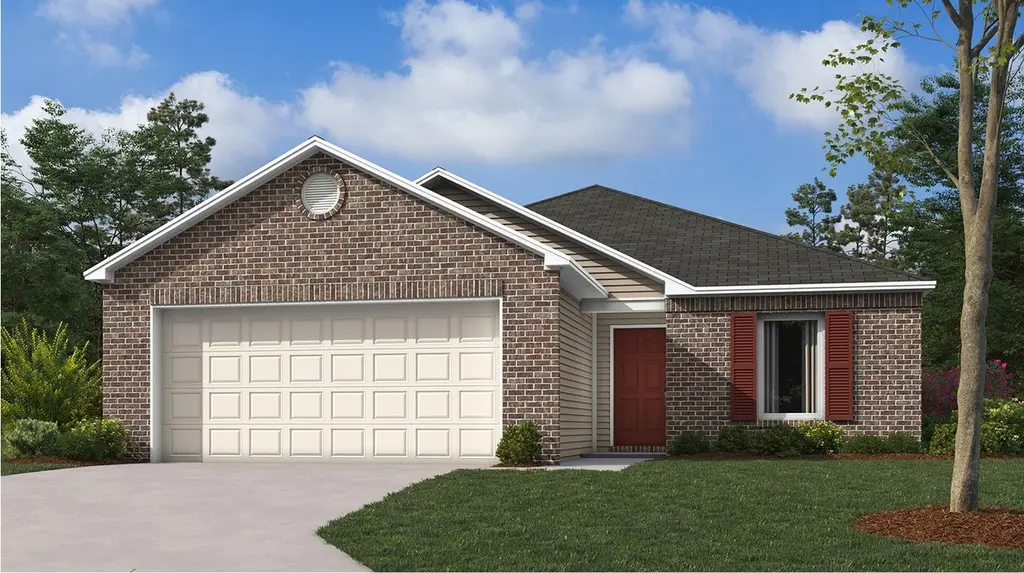
The beautiful Wright plan is packed with curb appeal with its charming covered front entry and inviting front yard landscaping. This open concept home features a floor plan with 3 bedrooms, 2 bathrooms, a spacious master suite with walk-in closets, and a marvelous kitchen fully equipped with energy-efficient appliances and a spacious laundry just off the garage. Don't miss out on this home today! * Photos are of similar model.
Key facts
- 0.27 acre lot
- Garage
- Built 2026
Property features AI
Finance
- Other: Inventory type: Spec; Plan name: RC Wright; Listing last modified: 2026-06-09
- Financial info: List price $271,700
Exterior
- Parking: 2 total parking spaces; 2-car garage
- Home design: Single-family property; Active listing
- Exterior features: Address: 2813 Biddie St, Pea Ridge, AR 72751
Interior
- Bedrooms: 3 bedrooms
- Bathrooms: 2 full bathrooms
- Interior features: Spec home (RC Wright plan); Living area of 1,216
Neighborhood map
What this means for you Summary
Snapshot
- This is a 3-bed/2.0-bath single-family listed at $272k.
Deal economics
- At list price, monthly cash flow is $-256 ($-3k/yr) — negative.
- To cash-flow at today's rent, offer at most $235k (13.6% below list).
- To meet the 1% rule (rent ≥ 1% of price), the offer needs to be $205k (24.4% below list).
- Recommended offer: $205k (24.4% below list) — sets the bar for 1% rule.
- Cap rate 5.2% vs local median 3.5% in Pea Ridge — top-decile yield for the area; either an underpriced asset or a hidden risk that comps aren't pricing in. Stress-test before assuming the spread holds.
Location & tenants
- Location reads 67/100 on livability (#98 in AR) — a middle-class / working-renter tenant base. Strengths: employment A+, housing A+, cost of living A-; Watch: amenities F, commute F.
- Pea Ridge School District (suburban): math 43% / reading 42% proficiency, ranked #43 of 238 in AR (top 18%) — families likely to look elsewhere, expect single-tenant / working-renter base with shorter leases.
- Zoned schools: Pea Ridge Primary School (575 students, 36% FRL); Pea Ridge Middle School (math 47% / reading 42%, grade D, #61 of 201 statewide, top 32%, 395 students, 34% FRL); Pea Ridge High School (math 22% / reading 37%, grade F, #142 of 292 statewide, top 53%, 566 students, 24% FRL) — zoned schools at 31% FRL track the district average.
- Market conditions: 433 active listings in the ZIP; 2 comparable units currently listed for rent nearby; solid renter incomes; 4,359 units permitted in Benton County in 2024 (402 in 5+ unit buildings).
Forward outlook
- In year one you build about $22k of equity ($2k loan paydown + $20k appreciation (7.5% local appreciation)).
- Benton County population projected at +56% by 2050 — long-run rental-demand tailwind backs the buy-and-hold thesis.
- By year 2, paydown + projected appreciation supports a ~$36k cash-out refi (75% LTV) — recoverable capital for the next deal without selling this one.
Negotiation context
- Only 9 days on market — expect competitive offers; lowballing is unlikely to land.
Risks & watch-outs
- Climate carrying-cost: moderate wildfire risk; extreme-heat days projected 7→21/yr by 2055 (HVAC capex compounding) — expect insurance premiums to compound above CPI over the hold.
Questions for the listing agent
- What do current leases actually rent for vs. the listed asking? Can we see a recent rent roll and the last 12 months of T-12 income?
- Is there a deadline driving the sale (1031 exchange, divorce, estate, relocation)? That informs how much negotiation room exists.
- The area grade is low — what's the realistic commute time and amenity access for the typical tenant pool here? Any planned neighborhood developments (good or bad) we should know about?
- What's the average days-on-market for RENTAL listings here right now (not sales)? A rising rental-DOM trend means longer vacancies and softer asking-rent achievability than the comps imply.
- What's the recent tenant-quality profile in this submarket — average credit score on applications, eviction rate, late-payment / NSF rate, and stable-employment percentage? A property-management company in the area should have these aggregated.
- How much new for-sale + rental construction is in the pipeline within 1–3 miles? Heavy new supply typically softens prices + rents 12–24 months out; constrained supply supports both.
Investment metrics
- 1% rule
- 0.76% ✗
- Cap rate
- 5.16%
- Cash-on-cash
- -4.04%
- DSCR
- 0.82
- GRM
- 11.0
CMA / ARV
- ARV (on-the-fly)
- $267,520
- Comps found
- 12
Show comp detail 12 sales within ~0.75 mi
| Address | Dist | Beds/Ba | Sqft | Sold | Price | $/sf | Match |
|---|---|---|---|---|---|---|---|
| 2716 Kane St | 0.05mi | 3/2.0 | 1,216 (0%) | 3mo | $264,200 | $217 | 95 |
| 2800 Major St | 0.11mi | 3/2.0 | 1,216 (0%) | 1mo | $268,400 | $221 | 94 |
| 2805 Biddie St | 0.00mi | 3/2.0 | 1,143 (-6%) | 3mo | $264,000 | $231 | 88 |
| 2804 Kane St | 0.05mi | 3/2.0 | 1,143 (-6%) | 3mo | $259,000 | $227 | 85 |
| 2725 Biddie St | 0.09mi | 3/2.0 | 1,143 (-6%) | 3mo | $259,900 | $227 | 83 |
| 2820 Murphy St | 0.38mi | 3/2.0 | 1,218 (+0%) | 1mo | $265,000 | $218 | 82 |
| 2708 Chittick St | 0.21mi | 3/2.0 | 1,143 (-6%) | 1mo | $266,900 | $234 | 80 |
| 2816 Kane St | 0.05mi | 3/2.0 | 1,355 (+11%) | 3mo | $280,900 | $207 | 76 |
| 2804 Major St | 0.11mi | 3/2.0 | 1,355 (+11%) | 1mo | $278,250 | $205 | 75 |
| 2700 Chittick St | 0.18mi | 3/2.0 | 1,355 (+11%) | 2mo | $285,900 | $211 | 71 |
| 2712 Chittick St | 0.21mi | 3/2.0 | 1,355 (+11%) | 1mo | $275,250 | $203 | 70 |
| 2332 John Montgomery Cir | 0.22mi | 3/2.0 | 1,385 (+14%) | 3mo | $304,900 | $220 | 64 |
Match score weights: distance 35% · size 25% · config 20% · recency 20%. Top-matched comps best support the ARV.
Projected returns pro-forma
7.48% appreciation · 3.0% rent growth · sell at horizon
- IRR
- 15.7%
- Equity multiple
- 2.14×
- Total profit
- $86,640
- Equity at exit
- $196,824
- IRR
- 15.4%
- Equity multiple
- 4.46×
- Total profit
- $263,524
- Equity at exit
- $381,882
Cash invested: $76,076 (down + closing). Projections, not guarantees.
Landlord ↔ Tenant lean methodology
- Overall (STATE)
- 92 Strongly Landlord-Friendly
- State Arkansas
- 92 Strongly Landlord-Friendly · R+14
- County
- — inherits STATE
- City
- — inherits STATE
ZIP-level market 72751
- Home prices YoY
- 2.2%
- Active inventory
- 433
- Price-to-rent
- 11.0×
Monthly cashflow live
- Estimated rent
- $2,053 medium interval (Pro) →
- Mortgage (P&I)
- −$1,425
- Tax est. 1.5%
- −$340 /mo · $4,076/yr
- Insurance
- −$113
- HOA
- −$0
- Vacancy / Maint / Mgmt
- −$431
- Net cashflow
- $-256
Break-even live
Sensitivity live
| Price | -10% $-68 | -5% $-162 | +0% $-256 | +5% $-350 | +10% $-444 |
|---|---|---|---|---|---|
| Rent | -10% $-418 | -5% $-337 | +0% $-256 | +5% $-175 | +10% $-94 |
| Rate | -1.0pp $-119 | -0.5pp $-187 | base $-256 | +0.5pp $-326 | +1.0pp $-398 |
UW: 25.0% down · 7.5% · 30yr · 1.5% tax · 5.0% vac · 8.0% maint · 8.0% mgmt
Financing live
Cash to close
- Down payment
- $67,925
- Closing costs
- $8,151
- Reserves months
- —
- Total cash needed
- —
Loan-product check · same deal, 3 products live
Conventional
25% down · 7.5% · 30yr
- Down + closing
- —
- Monthly P&I
- —
- Monthly cashflow
- —
- DSCR
- —
- Eligible?
- —
Personal DTI + credit; lowest rate.
DSCR
20% down · 8.5% · 30yr
- Down + closing
- —
- Monthly P&I
- —
- Monthly cashflow
- —
- DSCR
- —
- Eligible?
- —
No personal income docs; deal must DSCR.
Hard money
10% down · 12.0% · 12mo
- Down + closing
- —
- Monthly P&I
- —
- Monthly cashflow
- —
- DSCR
- —
- Eligible?
- —
Short-term bridge; refi at stabilization.
Rent comps 2 comps
| Address | Beds | Baths | Sqft | Rent | $/sqft | DOM | Units | Dist |
|---|---|---|---|---|---|---|---|---|
| 2720 Gorman St Pea Ridge, AR | 3.0 | 2.0 | 1480 | $1,695 | $1.15 | 16d | 1 | 0.26mi |
| 2813 Reynolds St Pea Ridge, AR | 3.0 | 2.0 | 1422 | $1,795 | $1.26 | 16d | 1 | 0.30mi |
Listing history 9 events
-
2026-06-22days on market $271,700 Active 9 DOM
-
2026-06-18days on market $271,700 Active 6 DOM
-
2026-06-17days on market $271,700 Active 5 DOM
-
2026-06-16days on market $271,700 Active 4 DOM
-
2026-06-15days on market $271,700 Active 3 DOM
-
2026-06-13remarks 431-char remark
-
2026-06-13$271,700 Active 1 DOM
-
2026-06-10remarks 404-char remark
-
2026-06-10$271,700 Active 1 DOM
ⓘ Source: listings_history table (triggers on properties + properties_extension) + one-shot
backfill from property_details.listing_events for pre-trigger history.
Climate risk First Street
- Flood 1/10 Low FEMA zone X (unshaded) · 0% chance over 30 yrs
- Wildfire 5/10 Major
- Heat 5/10 Major 7 d/yr ≥104°F today · 21 d/yr by 30 yrs out
- Wind 3/10 Moderate 5% chance of damaging wind over 30 yrs
- Air quality 2/10 Low 0 unhealthy d/yr today · 1 by 30 yrs out
Nearby sold comps map
Loading sold comps map…
Walkable amenities ~0.75 mi
Loading nearby amenities…
Taxation est. · year 1
- Rental income
- $24,634
- − Mortgage interest
- −$15,219
- − Property taxes
- −$4,076
- − Insurance
- −$1,358
- − Repairs & maintenance
- −$1,971
- − Management
- −$1,971
- − Depreciation
- −$7,904
- Taxable loss
- −$7,864
- Est. tax savings @ 24.0%
- +$1,887
- After-tax cash flow
- $-1,183/yr
For passive investors: Depreciation is non-cash, so a rental often shows a tax loss while cash-flowing — sheltering income. Rental losses are passive: they offset passive income freely, and up to $25,000/yr can offset ordinary (W-2) income if you actively participate and your MAGI is under $100k (phasing out to $0 by $150k); unused losses carry forward. On sale, claimed depreciation is recaptured at up to 25%, and gains may owe capital-gains tax (a 1031 exchange can defer both). Figures are a year-1 estimate at your 24.0% rate — not tax advice; consult a CPA.
Schools (NCES district)
- District
- Pea Ridge School District
- NCES district ID
- 0503030
- Math proficiency
- 43% ▼ -3.00%
- Reading proficiency
- 42% ▼ -8.00%
- Median HH income
- $53,156
- Composite
- 36.88/100
- National rank
- #4546
- State rank
- #43 of 238 in AR
Livability — Pea Ridge
- Score
- 67/100
- State rank
- #98
- US rank
- #10429
Category grades
Schools grade is shown separately in the Schools card above.
Census & demographics
- Census place
- Pea Ridge, AR
- County
- Benton County · 259,241 people
- City population
- 9,997
- Metro
- Fayetteville-Springdale-Rogers, AR
- Population (ZIP)
- 9,997
- Household income
- $95,299
- Rent vs Own
- Severe rent burden
- 83.0
Population outlook (Benton County) Hauer SSP2
- Today (2025)
- 318,683 people
- By 2030
- 353,481 · +10.9%
- By 2040
- 425,280 · +33.4%
- By 2050
- 497,239 · +56.0%
- By 2075
- 662,114 · +107.8%
- By 2100
- 776,431 · +143.6%
Race, ethnicity, and origin ACS 2023
- Neighborhood character
- Predominantly White (72%)
- Race & ethnicity
- White 72% Two or more races 17% Hispanic / Latino 7% Black 3%
- Hispanic origin (detail)
- Mexican 5%
- Common ancestry
- Slovak 4% Scottish 2% Lithuanian 2%
- Foreign-born
- 7% · Canada, Vietnam
- Languages at home
- 97% English-only · Spanish 2% Vietnamese 1%
Political lean MEDSL · Benton
- 2024 margin
- Strong R (+27.0) · D 35.2% · R 62.1% · Other 2.7%
- 2008→2024 swing
- +9.6pp toward D · 2008: -36.5pp · 2024: -27.0pp
- All cycles
- 2024: R+27.0 2020: R+26.4 2016: R+34.9 2012: R+40.4 2008: R+36.5
Not yet ingested
- Civics
- —
Market trends
- HPI YoY
- ▲ 7.48%
- Current HPI
- 352.7133
- Rent YoY
- —
- Metro
- Fayetteville-Springdale-Rogers, AR
- State GDP YoY
- ▲ 3.80%
- F500 in state
- 10
Industry mix (Fortune 500 HQ in AR)
| Industry | F500 HQs | Revenue |
|---|---|---|
| Retail | 1 | $681B |
|
||
| Food / Agriculture | 1 | $53B |
|
||
| Retail / Energy | 1 | $22B |
|
||
| Transportation / Logistics | 1 | $12B |
|
||
| Energy | 1 | $4B |
|
||
Cash-flow waterfall
monthlySold comps — $/sqft
last 12 mo · ≤1 miLoading sold comps…