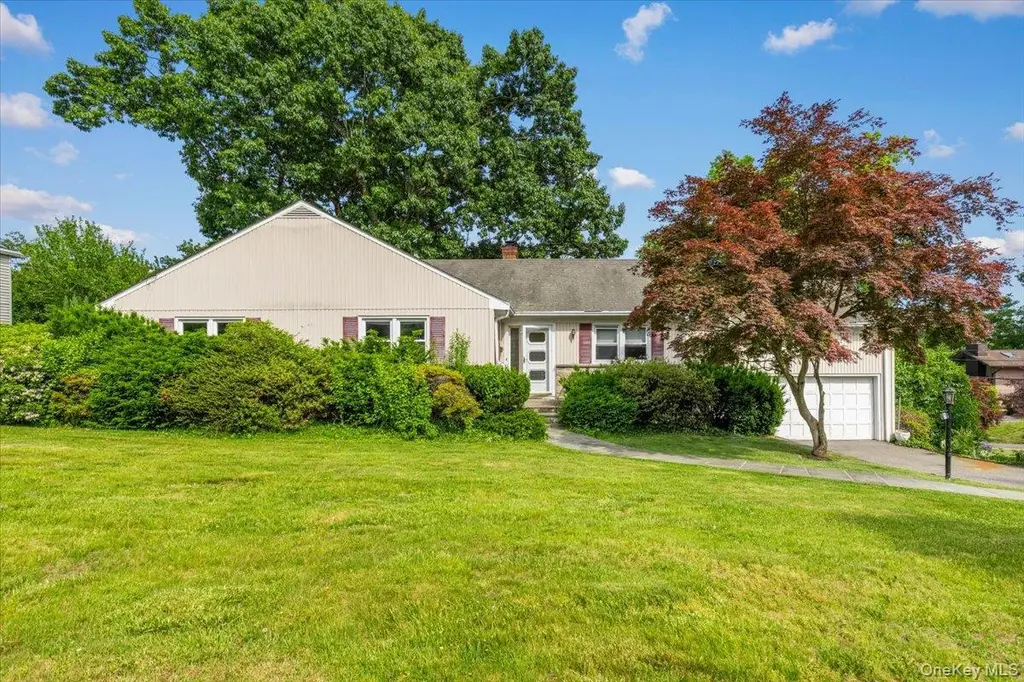
68 Brendon Hill Rd · Yonkers, NY
Flood risk 1/10 · Minimal
- FEMA flood zone
- X (unshaded)
- Chance of flooding over 30 yrs
- 0.0%
- Est. flood insurance / yr
- $473 – $860
Fire risk 1/10 · Minimal
- Est. fire insurance / yr
- $691 – $1,283
Heat risk 6/10 · Moderate
- Hot days now (above 99°F)
- 7 days/yr
- Hot days in 30 yrs
- 15 days/yr
Wind risk 6/10 · Moderate
- Chance of severe wind over 30 yrs
- 27.0%
Air-quality risk 4/10 · Minor
- Unhealthy air days now
- 3 days/yr
- Unhealthy air days in 30 yrs
- 5 days/yr
Risk factors via First Street. Map © Google.
Why this score? — see what drove the D+ grade
The composite is a weighted blend of 9 inputs, each scored 0–100. Each bar is that input's sub-score; the figure is the points it added to the 100-point composite (weight × sub-score).
- Cash flow +14.8/30.0
- ARV discount +12.0/15.0
- DSCR +4.5/10.0
- Schools +4.1/10.0
- Livability +3.4/5.0
- 1% rule +2.7/10.0
- Rent growth +2.5/5.0
- Condition / age +2.5/5.0
- Appreciation +0.0/10.0
$899,000
🖨 Deal sheet (PDF) 📄 Offer letter ✓ Due diligence
Listing remarks
Lovely split-level home located in the desirable Beech Hill section of Yonkers, offering a spacious layout, Ranch-style, with a finished basement and finished attic. Fenced-in yard. 2 Newer bathrooms. Hot Water heater and furnace replaced in 2022. Hardwood floors. 2 -Car Garage. Walking distance to Scarsdale train station, and Bronx River walking path—low taxes. Fireplace in the basement. Ideally located close to parks, shopping, dining, transportation, and major parkways. A wonderful opportunity to make this classic Beech Hill home your own.
Key facts
- Finished attic
- Hot water heater
- Finished basement
Tags
Property features AI
Exterior
- Parking: Attached parking; Driveway; Total parking for 4 vehicles; 2-car garage
- Utilities: Electric service by Con-Edison; Public sewer; No additional utilities listed
- Home design: Single family residence; Measured living area
- Construction: Frame construction; Shingle siding
- Exterior features: Frame construction with shingle siding; Not waterfront; No additional parcels
Interior
- Kitchen: Gas range; Range; Dishwasher; Refrigerator
- Bedrooms: Total of 7 rooms (includes bedrooms and living spaces)
- Bathrooms: 2 full bathrooms
- Heating & cooling: Forced air heating (natural gas); Hot air heating; Central air conditioning
- Interior features: Primary bathroom; Loft; Unfinished walk-out basement; Attic with walkup stairs; One fireplace in the basement
- Laundry & utility: Washer; Dryer
Neighborhood map
What this means for you Summary
Snapshot
- This is a 3-bed/1.5-bath single-family listed at $899k.
Deal economics
- At list price, monthly cash flow is $242 ($3k/yr) — positive.
- The deal already cash-flows at list — no discount required.
- To meet the 1% rule (rent ≥ 1% of price), the offer needs to be $695k (22.6% below list).
- Recommended offer: $695k (22.6% below list) — sets the bar for 1% rule.
- Cap rate 6.6% vs local median 5.4% in Yonkers — meaningfully above typical; check what's discounted (condition, days-on-market, listing class) to confirm the premium yield is real.
Location & tenants
- Location reads 68/100 on livability (#528 in NY) — a middle-class / working-renter tenant base. Strengths: employment A, commute B; Watch: amenities F, cost of living F.
- Yonkers City School District (suburban): math 41% / reading 54% proficiency, ranked #413 of 590 in NY (top 70%) — families likely to look elsewhere, expect single-tenant / working-renter base with shorter leases; 64% free/reduced lunch — lower-income household profile, screen leases tightly.
- Zoned schools: Yonkers Early Childhood Academy (327 students, 72% FRL); Yonkers Middle School (math 17% / reading 37%, grade F, #587 of 729 statewide, top 81%, 601 students, 88% FRL); Yonkers High School (math 92% / reading 88%, grade A+, #238 of 1,100 statewide, top 23%, 1,060 students, 76% FRL) — zoned schools average 79% FRL vs 64% district-wide (15 pts higher); higher-poverty schools than district average — tighter screening recommended.
- Market conditions: 293 active listings in the ZIP; 9 comparable units currently listed for rent nearby; rentals at typical pace (median 24d on market — plan ~3-4 weeks tenant-placement turnaround); 44% of comp listings sitting > 30 days — soft ceiling on asking rent; high-income renter base; 954 units permitted in Westchester County in 2024 (649 in 5+ unit buildings).
- This rent runs 33% of the median local income ($250k/yr) — at the standard rent-burdened threshold; future hikes will face affordability resistance.
Forward outlook
- Local home prices are declining (-3.0%/yr); year-one equity from $6k of loan paydown is wiped out by about $27k of value loss. Plan a longer hold.
- Westchester County population projected at +10% by 2050 — modest demand growth; plan on rents tracking national, not racing it.
Negotiation context
- It's been on market 17 days — a 2% lower offer ($886k) is reasonable based on typical stale-listing flexibility.
- Current owner paid $265k; list at $899k implies a 239% gain — meaningful room to come down on a strong offer.
Risks & watch-outs
- Watch-outs: built in 1951 — expect roof / HVAC / electrical / plumbing capex.
- Climate carrying-cost: major wind risk, 27% chance of damaging wind over 30y; extreme-heat days projected 7→15/yr by 2055 (HVAC capex compounding) — expect insurance premiums to compound above CPI over the hold.
Questions for the listing agent
- Built in 1951 — when were the roof, HVAC, electrical panel, plumbing, and water heater last replaced?
- Is there a deadline driving the sale (1031 exchange, divorce, estate, relocation)? That informs how much negotiation room exists.
- The area grade is low — what's the realistic commute time and amenity access for the typical tenant pool here? Any planned neighborhood developments (good or bad) we should know about?
- What's the average days-on-market for RENTAL listings here right now (not sales)? A rising rental-DOM trend means longer vacancies and softer asking-rent achievability than the comps imply.
- What's the recent tenant-quality profile in this submarket — average credit score on applications, eviction rate, late-payment / NSF rate, and stable-employment percentage? A property-management company in the area should have these aggregated.
- How much new for-sale + rental construction is in the pipeline within 1–3 miles? Heavy new supply typically softens prices + rents 12–24 months out; constrained supply supports both.
Investment metrics
- 1% rule
- 0.77% ✗
- Cap rate
- 6.62%
- Cash-on-cash
- 1.15%
- DSCR
- 1.05
- GRM
- 10.8
CMA / ARV
- ARV (on-the-fly)
- $1,000,000
- Comps found
- 12
Show comp detail 12 sales within ~0.75 mi
| Address | Dist | Beds/Ba | Sqft | Sold | Price | $/sf | Match |
|---|---|---|---|---|---|---|---|
| 22 Chauncey St | 0.33mi | 3/2.0 | 2,000 (0%) | 9mo | $650,000 | $325 | 75 |
| 210 Wyndcliff Rd | 0.14mi | 3/2.5 | 2,128 (+6%) | 6mo | $999,999 | $470 | 74 |
| 81 Sargent Rd | 0.28mi | 3/3.0 | 1,791 (-10%) | 0mo | $1,300,000 | $726 | 63 |
| 127 Crisfield St | 0.51mi | 3/2.5 | 2,166 (+8%) | 2mo | $690,000 | $319 | 57 |
| 60 E Fort Hill Rd | 0.50mi | 3/2.5 | 1,792 (-10%) | 3mo | $870,000 | $485 | 53 |
| 25 Malvern Rd | 0.19mi | 2/3.5 (-1) | 2,256 (+13%) | 7mo | $825,000 | $366 | 51 |
| 2 Danby Pl | 0.41mi | 3/3.0 | 2,200 (+10%) | 8mo | $1,100,000 | $500 | 51 |
| 73 Ewart St | 0.66mi | 3/2.5 | 2,250 (+12%) | 4mo | $1,165,000 | $518 | 41 |
| 628 Scarsdale Rd | 0.68mi | 4/2.0 (+1) | 2,205 (+10%) | 5mo | $765,000 | $347 | 40 |
| 9 Dogwood Dr | 0.62mi | 4/2.5 (+1) | 2,197 (+10%) | 9mo | $1,260,000 | $574 | 38 |
| 32 Lynwood Rd | 0.68mi | 4/2.0 (+1) | 2,294 (+15%) | 2mo | $1,300,000 | $567 | 36 |
| 16 Greenvale Pl | 0.71mi | 3/2.5 | 2,280 (+14%) | 9mo | $1,170,000 | $513 | 32 |
Match score weights: distance 35% · size 25% · config 20% · recency 20%. Top-matched comps best support the ARV.
Projected returns pro-forma
-3.0% appreciation · 3.0% rent growth · sell at horizon
- IRR
- -14.5%
- Equity multiple
- 0.48×
- Total profit
- $-130,769
- Equity at exit
- $134,044
- IRR
- -5.9%
- Equity multiple
- 0.62×
- Total profit
- $-96,022
- Equity at exit
- $77,729
Cash invested: $251,720 (down + closing). Projections, not guarantees.
Landlord ↔ Tenant lean methodology
- Overall (CITY)
- 5 Strongly Tenant-Friendly
- State New York
- 15 Strongly Tenant-Friendly · D+10
- County
- — inherits STATE
- City Yonkers
- 5 Strongly Tenant-Friendly · D+20
ZIP-level market 10583
- Active inventory
- 293
- Price-to-rent
- 10.8×
Monthly cashflow live
- Estimated rent
- $6,955 high interval (Pro) →
- Mortgage (P&I)
- −$4,714
- Tax from tax record
- −$164 /mo · $1,962/yr
- Insurance
- −$375
- HOA
- −$0
- Vacancy / Maint / Mgmt
- −$1,460
- Net cashflow
- $242
Break-even live
Sensitivity live
| Price | -10% $751 | -5% $496 | +0% $242 | +5% $-13 | +10% $-1,340 |
|---|---|---|---|---|---|
| Rent | -10% $-308 | -5% $-33 | +0% $242 | +5% $516 | +10% $791 |
| Rate | -1.0pp $694 | -0.5pp $470 | base $242 | +0.5pp $9 | +1.0pp $-228 |
UW: 25.0% down · 7.5% · 30yr · 1.5% tax · 5.0% vac · 8.0% maint · 8.0% mgmt
Financing live
Cash to close
- Down payment
- $224,750
- Closing costs
- $26,970
- Reserves months
- —
- Total cash needed
- —
Loan-product check · same deal, 3 products live
Conventional
25% down · 7.5% · 30yr
- Down + closing
- —
- Monthly P&I
- —
- Monthly cashflow
- —
- DSCR
- —
- Eligible?
- —
Personal DTI + credit; lowest rate.
DSCR
20% down · 8.5% · 30yr
- Down + closing
- —
- Monthly P&I
- —
- Monthly cashflow
- —
- DSCR
- —
- Eligible?
- —
No personal income docs; deal must DSCR.
Hard money
10% down · 12.0% · 12mo
- Down + closing
- —
- Monthly P&I
- —
- Monthly cashflow
- —
- DSCR
- —
- Eligible?
- —
Short-term bridge; refi at stabilization.
Rent comps 9 comps
| Address | Beds | Baths | Sqft | Rent | $/sqft | DOM | Units | Dist |
|---|---|---|---|---|---|---|---|---|
| 36 Grand Blvd Unit 2 Scarsdale, NY | 3.0 | 2.0 | 1500 | $6,100 | $4.07 | 45d | 1 | 0.53mi |
| 96 Alkamont Ave Scarsdale, NY | 2.0 | 1.0 | 2000 | $3,500 | $1.75 | 45d | 1 | 0.60mi |
| 4 Kingwood Rd Scarsdale, NY | 3.0 | 2.5 | 2067 | $7,000 | $3.39 | 45d | 1 | 0.71mi |
| 154 Bell Rd Scarsdale, NY | 3.0 | 2.5 | 1611 | $7,900 | $4.90 | 0d | 1 | 0.98mi |
| 106 White Rd Scarsdale, NY | 3.0 | 2.0 | 1700 | $5,800 | $3.41 | 0d | 1 | 1.28mi |
| 106 White Rd Scarsdale, NY | 3.0 | 2.0 | 1700 | $5,999 | $3.53 | 24d | 1 | 1.28mi |
| 155 White Rd Scarsdale, NY | 3.0 | 1.5 | 1632 | $7,000 | $4.29 | 45d | 1 | 1.28mi |
| Young Pl Tuckahoe, NY | 3.0 | 2.5 | 1936 | $7,500 | $3.87 | 0d | 1 | 1.44mi |
| 45 Fisher Ave Tuckahoe, NY | 4.0 | 2.5 | 2850 | $8,500 | $2.98 | 4d | 1 | 1.50mi |
Listing history 10 events
-
2026-06-21days on market $899,000 Active 17 DOM
-
2026-06-18days on market $899,000 Active 14 DOM
-
2026-06-17days on market $899,000 Active 13 DOM
-
2026-06-16days on market $899,000 Active 12 DOM
-
2026-06-15days on market $899,000 Active 11 DOM
-
2026-06-13days on market $899,000 Active 9 DOM
-
2026-06-09days on market $899,000 Active 5 DOM
-
2026-06-08days on market $899,000 Active 4 DOM
-
2026-06-07remarks 549-char remark
-
2026-06-07$899,000 Active 3 DOM
ⓘ Source: listings_history table (triggers on properties + properties_extension) + one-shot
backfill from property_details.listing_events for pre-trigger history.
Tax reassessment forecast NY · Partial reset (capped growth)
- Current annual tax
- $1,962 · $164/mo
- Projected year-2 tax
- $8,578 · $715/mo
- Expected delta
- +$6,616/yr (+$551/mo · 337.2%)
ⓘ Screening estimate from a state-policy table — verify with the county assessor before closing.
Climate risk First Street
- Flood 1/10 Low FEMA zone X (unshaded) · 0% chance over 30 yrs
- Wildfire 1/10 Low
- Heat 6/10 Major 7 d/yr ≥99°F today · 15 d/yr by 30 yrs out
- Wind 6/10 Major 27% chance of damaging wind over 30 yrs
- Air quality 4/10 Moderate 3 unhealthy d/yr today · 5 by 30 yrs out
Nearby sold comps map
Loading sold comps map…
Walkable amenities ~0.75 mi
Loading nearby amenities…
Taxation est. · year 1
- Rental income
- $83,457
- − Mortgage interest
- −$50,358
- − Property taxes
- −$1,962
- − Insurance
- −$4,495
- − Repairs & maintenance
- −$6,677
- − Management
- −$6,677
- − Depreciation
- −$26,153
- Taxable loss
- −$12,864
- Est. tax savings @ 24.0%
- +$3,087
- After-tax cash flow
- $5,988/yr
For passive investors: Depreciation is non-cash, so a rental often shows a tax loss while cash-flowing — sheltering income. Rental losses are passive: they offset passive income freely, and up to $25,000/yr can offset ordinary (W-2) income if you actively participate and your MAGI is under $100k (phasing out to $0 by $150k); unused losses carry forward. On sale, claimed depreciation is recaptured at up to 25%, and gains may owe capital-gains tax (a 1031 exchange can defer both). Figures are a year-1 estimate at your 24.0% rate — not tax advice; consult a CPA.
Schools (NCES district)
- District
- Yonkers City School District
- NCES district ID
- 3631920
- Math proficiency
- 41% ▼ -1.00%
- Reading proficiency
- 54% ▲ 14.00%
- Median HH income
- $58,042
- Composite
- 41.43/100
- National rank
- #3471
- State rank
- #413 of 590 in NY
Livability — Yonkers
- Score
- 68/100
- State rank
- #528
- US rank
- #9394
Category grades
Schools grade is shown separately in the Schools card above.
Census & demographics
- Census place
- Yonkers, NY
- County
- Westchester County · 709,332 people
- City population
- 212,407
- Metro
- New York-Newark-Jersey City, NY-NJ-PA
- Population (ZIP)
- 40,207
- Household income
- $250,001
- Rent vs Own
- Severe rent burden
- 560.0
Population outlook (Westchester County) Hauer SSP2
- Today (2025)
- 1,028,035 people
- By 2030
- 1,051,636 · +2.3%
- By 2040
- 1,098,520 · +6.9%
- By 2050
- 1,136,044 · +10.5%
- By 2075
- 1,196,925 · +16.4%
- By 2100
- 1,175,147 · +14.3%
Race, ethnicity, and origin ACS 2023
- Neighborhood character
- Diverse neighborhood (Simpson 0.55)
- Race & ethnicity
- White 63% Asian 20% Hispanic / Latino 8% Two or more races 7% Black 3%
- Hispanic origin (detail)
- Puerto Rican 2% Dominican 2%
- Common ancestry
- Scotch-Irish 6% Romanian 5% Italian 3%
- Foreign-born
- 25% · Canada, China, South Korea
- Languages at home
- 72% English-only · Other Indo-European 8% Chinese 6% Spanish 5%
Political lean MEDSL · Westchester
- 2024 margin
- Strong D (+26.3) · D 63.1% · R 36.9%
- 2008→2024 swing
- -1.3pp toward R · 2008: 27.6pp · 2024: 26.3pp
- All cycles
- 2024: D+26.3 2020: D+36.3 2016: D+32.8 2012: D+22.2 2008: D+27.6
Not yet ingested
- Civics
- —
Market trends
- HPI YoY
- ▼ -851.83%
- Current HPI
- 283.4725
- Rent YoY
- —
- Metro
- New York-Newark-Jersey City, NY-NJ-PA
- State GDP YoY
- ▲ 2.60%
- F500 in state
- 92
Industry mix (Fortune 500 HQ in NY)
| Industry | F500 HQs | Revenue |
|---|---|---|
| Financial Services | 10 | $950B |
|
||
| Consumer Goods | 9 | $162B |
|
||
| Insurance | 4 | $225B |
|
||
| Telecommunications | 2 | $144B |
|
||
| Pharmaceuticals | 2 | $112B |
|
||
| Media / Entertainment | 2 | $69B |
|
||
Price history
+239.2% since first listed2 events — show timeline
- 2026-06-02 Listed $899,000 OneKey® MLS as Distributed by MLS Grid
- 1991-10-24 Sold (Public Records) $265,000 Public Records
Property tax history
-21.8%/yrLatest (2025): $1,962 · +1.3% YoY. Source: county tax records.
Cash-flow waterfall
monthlySold comps — $/sqft
last 12 mo · ≤1 miLoading sold comps…