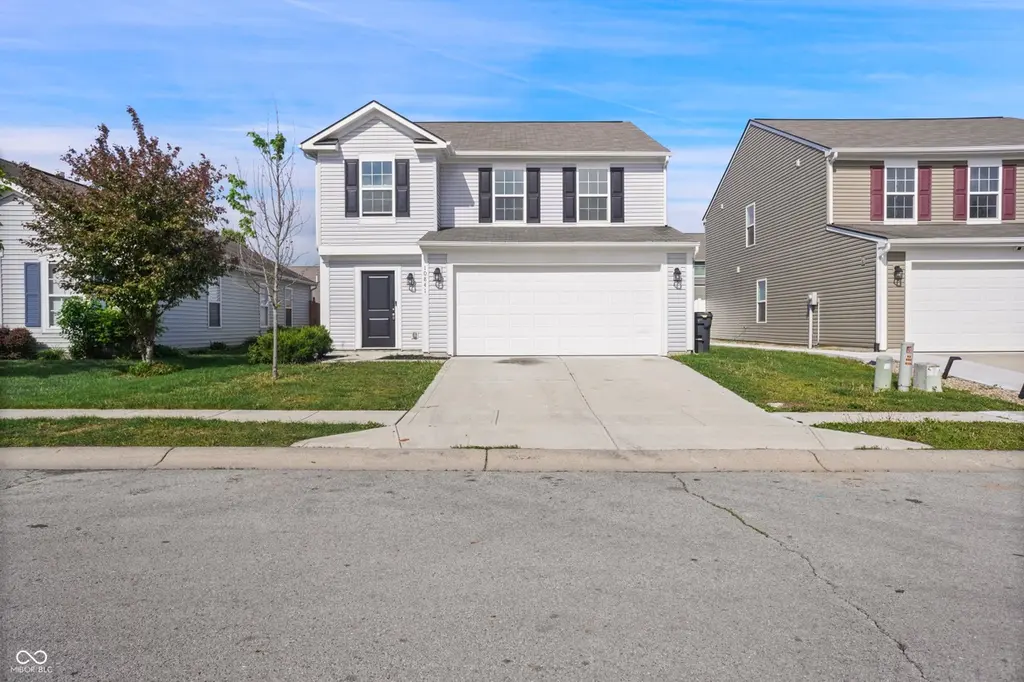
10841 Woods Dr · Ingalls, IN
Flood risk 1/10 · Minimal
- FEMA flood zone
- X (unshaded)
- Chance of flooding over 30 yrs
- 0.0%
- Est. flood insurance / yr
- $507 – $1,088
Fire risk 1/10 · Minimal
- Est. fire insurance / yr
- $717 – $1,331
Heat risk 3/10 · Minor
- Hot days now (above 101°F)
- 7 days/yr
- Hot days in 30 yrs
- 19 days/yr
Wind risk 2/10 · Minimal
- Chance of severe wind over 30 yrs
- 1.0%
Air-quality risk 2/10 · Minimal
- Unhealthy air days now
- 1 days/yr
- Unhealthy air days in 30 yrs
- 2 days/yr
Risk factors via First Street. Map © Google.
Why this score? — see what drove the D grade
The composite is a weighted blend of 9 inputs, each scored 0–100. Each bar is that input's sub-score; the figure is the points it added to the 100-point composite (weight × sub-score).
- ARV discount +10.7/15.0
- Appreciation +10.0/10.0
- Cash flow +6.0/30.0
- Schools +4.2/10.0
- Livability +3.2/5.0
- Rent growth +2.5/5.0
- Condition / age +2.5/5.0
- 1% rule +1.6/10.0
- DSCR +0.4/10.0
$285,000
🖨 Deal sheet 📄 Offer letter ✓ Due diligence
Listing remarks
." Welcome to this beautifully renovated 5 BED ROOM 3 FULL BATH home The Updated Kitchen Includes NEW Stainless Steel Appliances . Plenty of Counter Space . with NEW Interior paint, NEW flooring throughout the home . The primary bedroom featuring a full en-suite and walk in closet separate tub and shower and beautiful double bowl vanity
Key facts
- 4,487 sq ft lot
- 2 garage spots
- Built 2021
Property features AI
Finance
- HOA & community: Homeowners association with an annual fee of $250
Exterior
- Parking: Attached garage; Two-car garage (approximately 400 sq ft)
- Utilities: Public water; Municipal sewer connected
- Home design: Single family residence; Two levels
- Construction: Vinyl siding; Slab foundation
- Exterior features: No fence; Less than 1/4 acre lot
Interior
- Kitchen: Electric cooktop; Dishwasher; Microwave; Refrigerator; Garbage disposal; Electric water heater
- Bedrooms: Five bedrooms total (3 upstairs, 2 on the main level); Primary bedroom with walk-in closet
- Bathrooms: Three full bathrooms; Primary bathroom with double sinks and a full tub plus separate shower
- Heating & cooling: Electric heating with heat pump; Central air conditioning
- Interior features: Eat-in kitchen; Walk-in closets
Neighborhood map
What this means for you Summary
Snapshot
- This is a 4-bed/2.5-bath single-family listed at $285k.
Deal economics
- At list price, monthly cash flow is $-538 ($-6k/yr) — negative.
- To cash-flow at today's rent, offer at most $190k (33.4% below list).
- To meet the 1% rule (rent ≥ 1% of price), the offer needs to be $188k (33.9% below list).
- Recommended offer: $188k (33.9% below list) — sets the bar for 1% rule.
Location & tenants
- Location reads 64/100 on livability (#391 in IN) — a middle-class / working-renter tenant base. Strengths: crime A+, cost of living A+, housing A+; Watch: employment C-, amenities F, commute F.
- South Madison Community School Corporation (rural): math 44% / reading 52% proficiency, ranked #60 of 301 in IN (top 20%) — families likely to look elsewhere, expect single-tenant / working-renter base with shorter leases.
- Zoned schools: Pendleton Heights High School (math 36% / reading 77%, grade C, #70 of 369 statewide, top 19%, 1,357 students, 31% FRL).
- Market conditions: 10 active listings in the ZIP; 5 comparable units currently listed for rent nearby; rentals leasing fast (median 2d on market — plan ~1-2 weeks tenant-placement turnaround); 184 units permitted in Madison County in 2024 (0 in 5+ unit buildings).
Forward outlook
- In year one you build about $30k of equity ($2k loan paydown + $28k appreciation (10.0% local appreciation)).
- Madison County population projected at -14% by 2050 — secular population decline; favor cash flow + early exit over multi-decade hold.
- By year 2, paydown + projected appreciation supports a ~$49k cash-out refi (75% LTV) — recoverable capital for the next deal without selling this one.
Negotiation context
- Only 8 days on market — expect competitive offers; lowballing is unlikely to land.
Questions for the listing agent
- What do current leases actually rent for vs. the listed asking? Can we see a recent rent roll and the last 12 months of T-12 income?
- What does the HOA fee cover, when was the last increase, and are there any pending special assessments or reserve-fund shortfalls?
- Is there a deadline driving the sale (1031 exchange, divorce, estate, relocation)? That informs how much negotiation room exists.
- Schools are F-rated, which usually means shorter tenancies and higher turnover. Who's the typical renter profile here, and what's been the actual vacancy rate?
- The area grade is low — what's the realistic commute time and amenity access for the typical tenant pool here? Any planned neighborhood developments (good or bad) we should know about?
- What's the average days-on-market for RENTAL listings here right now (not sales)? A rising rental-DOM trend means longer vacancies and softer asking-rent achievability than the comps imply.
- What's the recent tenant-quality profile in this submarket — average credit score on applications, eviction rate, late-payment / NSF rate, and stable-employment percentage? A property-management company in the area should have these aggregated.
- How much new for-sale + rental construction is in the pipeline within 1–3 miles? Heavy new supply typically softens prices + rents 12–24 months out; constrained supply supports both.
Investment metrics
- 1% rule
- 0.66% ✗
- Cap rate
- 4.03%
- Cash-on-cash
- -8.10%
- DSCR
- 0.64
- GRM
- 12.6
CMA / ARV
- ARV (on-the-fly)
- $306,600
- Comps found
- 12
Show comp detail 12 sales within ~0.75 mi
| Address | Dist | Beds/Ba | Sqft | Sold | Price | $/sf | Match |
|---|---|---|---|---|---|---|---|
| 10841 Woods Dr | 0.00mi | 5/3.0 (+1) | 2,190 (0%) | 0mo | $285,000 | $130 | 93 |
| 10847 Grace Dr | 0.05mi | 4/2.5 | 2,328 (+6%) | 2mo | $249,900 | $107 | 86 |
| 10837 Mansfield Way | 0.10mi | 4/2.5 | 2,020 (-8%) | 10mo | $265,000 | $131 | 75 |
| 7647 Mansfield Way | 0.14mi | 3/2.5 (-1) | 2,336 (+7%) | 6mo | $270,000 | $116 | 72 |
| 7645 Wymm Ln | 0.10mi | 3/2.5 (-1) | 1,944 (-11%) | 3mo | $274,900 | $141 | 69 |
| 10915 Mansfield Way | 0.12mi | 3/2.5 (-1) | 1,954 (-11%) | 13mo | $271,000 | $139 | 61 |
| 578 N Crystal Dr | 0.57mi | 4/3.0 | 2,346 (+7%) | 4mo | $333,000 | $142 | 56 |
| 1299 W Crystal Dr | 0.59mi | 4/3.0 | 2,269 (+4%) | 11mo | $355,000 | $156 | 55 |
| 595 N Wyndstone Way | 0.65mi | 4/2.5 | 2,390 (+9%) | 0mo | $335,000 | $140 | 54 |
| 660 N Granite Dr | 0.66mi | 3/2.5 (-1) | 2,230 (+2%) | 10mo | $339,900 | $152 | 53 |
| 606 W 1050 N | 0.64mi | 4/2.0 | 2,015 (-8%) | 6mo | $330,000 | $164 | 50 |
| 562 N Wyndstone Way | 0.70mi | 4/2.0 | 2,463 (+12%) | 7mo | $310,000 | $126 | 39 |
Match score weights: distance 35% · size 25% · config 20% · recency 20%. Top-matched comps best support the ARV.
Projected returns pro-forma
10.0% appreciation · 3.0% rent growth · sell at horizon
- IRR
- 18.6%
- Equity multiple
- 2.52×
- Total profit
- $120,989
- Equity at exit
- $256,751
- IRR
- 17.3%
- Equity multiple
- 5.80×
- Total profit
- $383,387
- Equity at exit
- $553,692
Cash invested: $79,800 (down + closing). Projections, not guarantees.
Landlord ↔ Tenant lean methodology
- Overall (STATE)
- 90 Strongly Landlord-Friendly
- State Indiana
- 90 Strongly Landlord-Friendly · R+11
- County
- — inherits STATE
- City
- — inherits STATE
ZIP-level market 46048
- Home prices YoY
- 14.6%
- Active inventory
- 10
- Price-to-rent
- 12.6×
Monthly cashflow live
- Estimated rent
- $1,884 high interval (Pro) →
- Mortgage (P&I)
- −$1,495
- Tax from tax record
- −$392 /mo · $4,706/yr
- Insurance
- −$119
- HOA
- −$21
- Vacancy / Maint / Mgmt
- −$396
- Net cashflow
- $-538
Break-even live
UW: 25.0% down · 7.5% · 30yr · 1.5% tax · 5.0% vac · 8.0% maint · 8.0% mgmt
Financing live
Cash to close
- Down payment
- $71,250
- Closing costs
- $8,550
- Reserves months
- —
- Total cash needed
- —
Loan-product check · same deal, 3 products live
Conventional
25% down · 7.5% · 30yr
- Down + closing
- —
- Monthly P&I
- —
- Monthly cashflow
- —
- DSCR
- —
- Eligible?
- —
Personal DTI + credit; lowest rate.
DSCR
20% down · 8.5% · 30yr
- Down + closing
- —
- Monthly P&I
- —
- Monthly cashflow
- —
- DSCR
- —
- Eligible?
- —
No personal income docs; deal must DSCR.
Hard money
10% down · 12.0% · 12mo
- Down + closing
- —
- Monthly P&I
- —
- Monthly cashflow
- —
- DSCR
- —
- Eligible?
- —
Short-term bridge; refi at stabilization.
Rent comps 5 comps
| Address | Beds | Baths | Sqft | Rent | $/sqft | DOM | Units | Dist |
|---|---|---|---|---|---|---|---|---|
| 10845 Mansfield Way Ingalls, IN | 3.0 | 2.5 | 1516 | $1,825 | $1.20 | 10d | 1 | 0.09mi |
| 10918 Spirit Dr Ingalls, IN | 4.0 | 2.5 | 1633 | $1,695 | $1.04 | 1d | 1 | 0.11mi |
| 7587 Charlotte Dr Ingalls, IN | 3.0 | 2.5 | 2328 | $1,981 | $0.85 | 1d | 1 | 0.17mi |
| 10904 Wymm Ln Ingalls, IN | 4.0 | 2.5 | 2328 | $2,149 | $0.92 | 1d | 1 | 0.20mi |
| 7266 W Reformatory Rd Unit 7264 Pendleton, IN | 3.0 | 2.0 | 1492 | $1,700 | $1.14 | 1d | 1 | 1.02mi |
HOA detail
- Monthly dues
- $21 · $252/yr
Listing history 2 events
-
2026-05-02status Pending
-
2026-04-24$285,000 Active
ⓘ Source: listings_history table (triggers on properties + properties_extension) + one-shot
backfill from property_details.listing_events for pre-trigger history.
Tax reassessment forecast IN · Partial reset (capped growth)
- Current annual tax
- $4,706 · $392/mo
- Projected year-2 tax
- $4,706 · $392/mo
- Expected delta
- $0/yr ($0/mo · 0.0%)
ⓘ Screening estimate from a state-policy table — verify with the county assessor before closing.
Climate risk First Street
- Flood 1/10 Low FEMA zone X (unshaded) · 0% chance over 30 yrs
- Wildfire 1/10 Low
- Heat 3/10 Moderate 7 d/yr ≥101°F today · 19 d/yr by 30 yrs out
- Wind 2/10 Low 100% chance of damaging wind over 30 yrs
- Air quality 2/10 Low 1 unhealthy d/yr today · 2 by 30 yrs out
Nearby sold comps map
Loading sold comps map…
Walkable amenities ~0.75 mi
Loading nearby amenities…
Taxation est. · year 1
- Rental income
- $22,603
- − Mortgage interest
- −$15,964
- − Property taxes
- −$4,706
- − Insurance
- −$1,425
- − Repairs & maintenance
- −$1,808
- − Management
- −$1,808
- − HOA
- −$252
- − Depreciation
- −$8,291
- Taxable loss
- −$11,651
- Est. tax savings @ 24.0%
- +$2,796
- After-tax cash flow
- $-3,665/yr
For passive investors: Depreciation is non-cash, so a rental often shows a tax loss while cash-flowing — sheltering income. Rental losses are passive: they offset passive income freely, and up to $25,000/yr can offset ordinary (W-2) income if you actively participate and your MAGI is under $100k (phasing out to $0 by $150k); unused losses carry forward. On sale, claimed depreciation is recaptured at up to 25%, and gains may owe capital-gains tax (a 1031 exchange can defer both). Figures are a year-1 estimate at your 24.0% rate — not tax advice; consult a CPA.
Schools (NCES district)
- District
- South Madison Community School Corporation
- NCES district ID
- 1810440
- Math proficiency
- 44% ▼ -13.00%
- Reading proficiency
- 52% ▼ -6.00%
- Median HH income
- $63,565
- Composite
- 42.4/100
- National rank
- #3231
- State rank
- #60 of 301 in IN
Livability — Ingalls
- Score
- 64/100
- State rank
- #391
- US rank
- #14479
Category grades
Schools grade is shown separately in the Schools card above.
Census & demographics
- Census place
- Ingalls, IN
- City population
- 2,209
- Population (ZIP)
- 2,209
Population outlook (Madison County) Hauer SSP2
- Today (2025)
- 125,800 people
- By 2030
- 122,640 · -2.5%
- By 2040
- 115,420 · -8.3%
- By 2050
- 108,148 · -14.0%
- By 2075
- 91,838 · -27.0%
- By 2100
- 75,670 · -39.8%
Race, ethnicity, and origin ACS 2023
- Neighborhood character
- Predominantly White (79%)
- Race & ethnicity
- White 79% Hispanic / Latino 9% Black 9% Two or more races 7%
- Hispanic origin (detail)
- Mexican 7%
- Common ancestry
- Romanian 2% Slovak 2% Serbian 2%
- Foreign-born
- 4% · Canada
- Languages at home
- 94% English-only · Spanish 5%
Political lean MEDSL · Madison
- 2024 margin
- Strong R (+26.9) · D 35.6% · R 62.5% · Other 1.9%
- 2008→2024 swing
- -33.5pp toward R · 2008: 6.5pp · 2024: -26.9pp
- All cycles
- 2024: R+26.9 2020: R+22.6 2016: R+25.7 2012: R+4.5 2008: D+6.5
Not yet ingested
- Civics
- —
Market trends
- HPI YoY
- ▲ 39.30%
- Current HPI
- 308.7212
- Rent YoY
- —
- Metro
- —
- State GDP YoY
- ▲ 2.90%
- F500 in state
- 18
Industry mix (Fortune 500 HQ in IN)
| Industry | F500 HQs | Revenue |
|---|---|---|
| Industrial Machinery | 2 | $37B |
|
||
| Healthcare | 1 | $177B |
|
||
| Pharmaceuticals | 1 | $45B |
|
||
| Metals / Steel | 1 | $18B |
|
||
| Agriculture | 1 | $17B |
|
||
| Packaging | 1 | $12B |
|
||
Price history
2 events — show timeline
- 2026-05-02 Pending — MIBOR as Distributed by MLS Grid
- 2026-04-24 Listed $285,000 MIBOR as Distributed by MLS Grid
Property tax history
+83.3%/yrLatest (2024): $4,706 · +1.3% YoY. Source: county tax records.
Cash-flow waterfall
monthlySold comps — $/sqft
last 12 mo · ≤1 miLoading sold comps…